

The Traffic
The following output represents a handful of TCPdump records to provide the general "flavor" of the activity. The source and destination hosts are bold. These are the first ten records associated with the activity on June 29; there are four different source hosts involved in scanning ten different destination hosts.
The timestamps associated with the records should be regarded with caution. The sensor that captured these records is running Redhat Linux 7.1 with a packet-capturing mechanism known as turbopacket compiled into the kernel. It is supposed to contain a method for more efficient buffering, but it also appears that the timestamp precision has been lost. Timestamps should have microsecond fidelity, but these timestamps appear to have 10-ms resolution:
12:16:31.150575 ool-18bd69bb.dyn.optonline.net.4333 > 192.168.112.44.27374: S 542724472:542724472(0) win 16384 <mss 1460,nop,nop,sackOK> (DF) (ttl 117, id
13444)
12:16:31.160575 ool-18bd69bb.dyn.optonline.net.4334 > 192.168.112.45.27374: S 542768141:542768141(0) win 16384 <mss 1460,nop,nop,sackOK> (DF) (ttl 117, id
13445)
12:16:31.170575 24.3.50.252.1757 > 192.168.19.178.27374: S 681372183:681372183(0) win 16384 <mss 1460,nop,nop,sackOK> (DF) (ttl 117,id
54912)
12:16:31.170575 24-240-136-48.hsacorp.net.4939 >192.168.11.19.27374: S 3019773591:3019773591(0) win 16384 <mss 1460,nop,nop,sackOK> (DF) (ttl 117,
id 39621)
12:16:31.170575 ool-18bd69bb.dyn.optonline.net.4335 > 192.168.112.46.27374: S 542804226:542804226(0) win 16384 <mss 1460,nop,nop,sackOK> (DF) (ttl 117, id
13446)
12:16:31.170575 cc18270-a.essx1.md.home.com.4658 > 192.168.5.88.27374: S 55455482:55455482(0) win 8192 <mss 1460,nop,nop,sackOK> (DF) (ttl 117, id
8953)
12:16:31.170575 24.3.50.252.1759 > 192.168.19.180.27374: S 681485650:681485650(0) win 16384 <mss 1460,nop,nop,sackOK> (DF) (ttl 117, id
54914)
12:16:31.170575 cc18270-a.essx1.md.home.com.4659 > 192.168.5.89.27374: S 55455483:55455483(0) win 8192 <mss 1460,nop,nop,sackOK> (DF) (ttl 117, id
9209)
12:16:31.170575 24.3.50.252.1760 > 192.168.19.181.27374: S 681550782:681550782(0) win 16384 <mss 1460,nop,nop,sackOK> (DF) (ttl 117, id
54915)
12:16:31.170575 cc18270-a.essx1.md.home.com.4660 > 192.168.5.90.27374: S 55455484:55455484(0) win 8192 <mss 1460,nop,nop,sackOK> (DF) (ttl 117, id 9465)
DDoS or Scan
At first, it was not apparent if this was some kind of attempted DDoS or an actual coordinated scan of some sort. During the examination of the activity, we were fortunate (from the analysis perspective) to receive additional activity on July 2, 2001 at 16:00 that was remarkably similar.
After we received the second scan, we began in earnest to look at individual fields found in the
received packets of both sets of activity to interpret the nature and intent of the activity.
Source Hosts
In the first scan, 132,706 total packets were received and there were 314 unique source hosts involved. Of those hosts, only 17 (approximately 5.4 percent) did not have DNS registered host names. In the second scan, 157,842 total packets were received. There were 295 unique source hosts with only 24 (approximately 8.1 percent) with unresolved host names. This alone is quite telling. Two choices for categorizing the source hosts are that they either do or do not reflect the genuine source host that is sending the traffic. If the source host reflects the actual sender, no subterfuge is used in sending the packet. If the source host is not the actual sender, a spoofed source IP number is placed in the packet.
Typically, when source IP numbers are spoofed, it is a random generation of different IP numbers in the instance of a flood. Other attacks might use a selection of one or more source IP numbers that might be either a decoy or an eventual target of some kind. When the source host reflects the true sender, the intent is more likely than not to be able to receive a response to the sent traffic.
Therefore, it appears that the activity that was seen is using genuine source IP numbers. If this were a flood and the source IPs were spoofed using randomly generated IP numbers, it is statistically unlikely that these IP numbers would resolve to host names 91.9 to 94.6 percent of the time. It would be unusual that IP numbers would be spoofed using a predetermined set of IP numbers that resolved to host names, because this takes a lot of effort for little or no gain. It can be speculated that, because of the sheer number of source hosts involved, they most likely represent zombie hosts that have somehow been exploited and owned. Many of these source networks are associated with cable modem or DSL providers such as @Home and AOL. This corroborates the speculation of zombie hosts because home users are more likely to be unaware of security threats and less protected than most commercial or larger networks with
some kind of perimeter protection.
Destination Hosts
Next, the analysis moved to examination of the destination hosts to provide more evidence of a scan. The scanned network is Class B with the possibility of 65,535 IP numbers to scan. The first scan targeted 32,367 unique destination hosts and the second scan targeted 36,638 unique destination hosts. An initial unsubstantiated reaction to missed subnets was that there was some prior reconnaissance performed to directly target live hosts. After more thorough examination of the destination hosts, it was evident that many of the destination IP numbers that were scanned had no associated live hosts.
The more plausible explanation for the missing destination subnets and destination hosts is that perhaps the zombie or zombies that were assigned the mission of scanning those subnets were somehow not active or responsive during the scan and did not participate. A single missing destination host in an otherwise scanned subnet might be interpreted as a dropped initial packet rather than an omitted destination IP number.
Although one unique source host scanned most destination hosts, multiple source hosts scanned some destination hosts. The scanner appears to have some redundancy of scanned hosts to
ensure a response.
Scanning Rates
Another indication of a scan versus a flood was the scanning rate of the source hosts. Both scans sustained some kind of activity for five or six minutes; however, the ramp-up time was fast, and there was a burst of activity for the first two minutes.
The measure of bandwidth consumption was as follows. Each packet was a SYN packet with TCP options and no payload. Most packets had a length of 48 bytes, a few had more, and a few had 4 bytes less, depending on the number and types of TCP options used. Packets had a standard 20-byte IP header with no IP options. Because the majority of packets had a length of 48 bytes, this was used as the packet length for the computation of bandwidth consumption. Because throughput or bandwidth is measured in bits per second, the packet length was 384 (48 * 8)
bits.
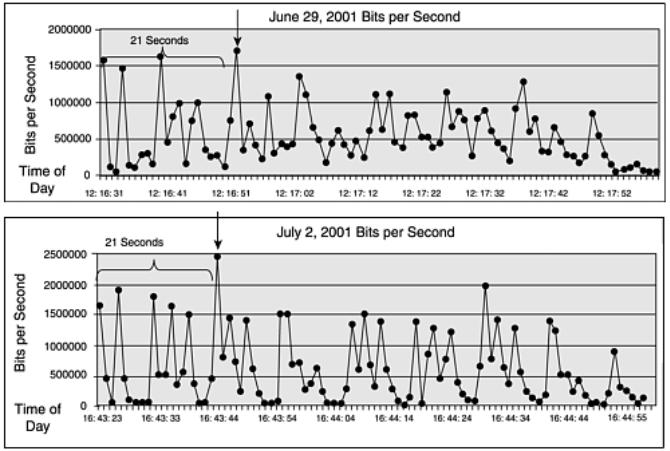
The scan on June 29 reached a maximum rate of 1.7Mbps at peak. The second scan on July 2 reached a maximum rate of 2.4Mbps at peak. This did not adversely affect the monitored site, but a site with a smaller ingress pipe such as a T-1 with 1.554Mbps capacity might have suffered a temporary denial of service as a side effect of the scan. Figure 11.1 shows the bits per
second during peak scan minutes.
Figure 11.1. Bits per second.
Looking at the plots in Figure 11.1 together, it is apparent from the general contours that the scanning rates for both scans were very similar. In fact, both scans reached peak scanning rates at exactly 21 seconds after the scan began. As discovered later, after examining the traffic using different representations, this peak activity indicated some kind of coordination by the "commander" who allocated scanning assignments and rates for the zombies.
Peak rates could have occurred because there were more scanning hosts during that second or because the number of packets sent by hosts increased. Further scrutiny of the data revealed that the peaks and valleys correlated with an increased number of scanning hosts.
The 21-second peak rate that was observed yet again on a third scan on November 1 was indeed a mystery. However, it was observed that the scanning hosts sent retries of initial SYN connections that received no response. This is typical TCP behavior, and many TCP/IP stacks will attempt 3 retries after the initial SYN, with a formula of waiting 3 seconds before the first retry, doubling the wait time to 6 seconds for the second retry and doubling the wait time yet again to 12 seconds for the third and final retry. Hence, the aggregate time that passes between the initial SYN and the final retry is 21 seconds. And so, when initial SYN attempts only were plotted by time as in Figure 11.2, the 21-second peak disappears.
Figure 11.2. June 29, 2001 initial SYN attempts.
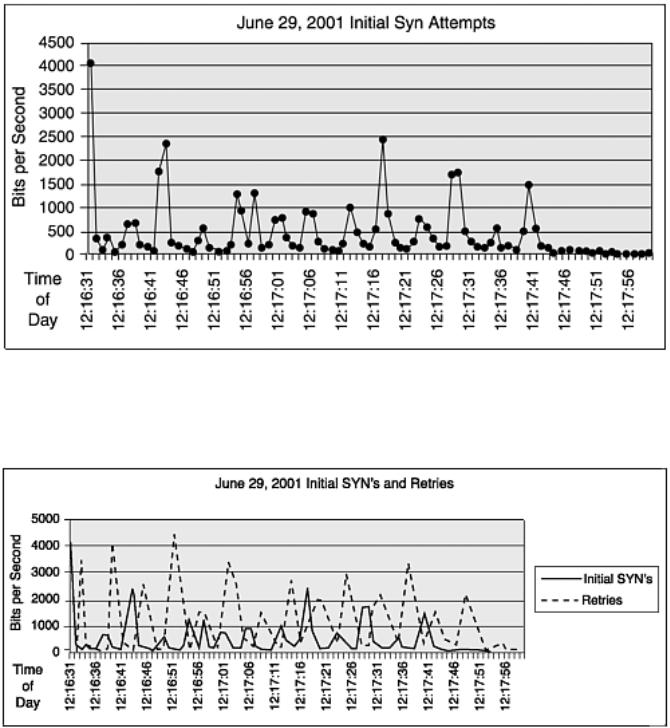
This only partially explains the 21-second peak. If this peak were due strictly to retries alone of the same hosts, similar peak activity should be observed at 3 and 9 seconds as well.
shows two separate types of connection attempts by time for the June 29 scan—the solid line shows initial SYN attempts and the dashed line shows retries of those initial SYN attempts. This more completely explains the 21-second peak.
Figure 11.3. June 29, 2001 initial SYNs and retries.
Peak activity occurs at 12:16:52. As expected, this corresponds to the 3rd retry of the spate of attempted SYN connections sent at 12:16:31. Furthermore, it corresponds to the second retry of the deluge of another set of initial SYN attempts sent 9 seconds before peak activity at 12:16:42. More so, in both scans, it appears, at least at first, that the wave of initial SYN connections comes in 12-second intervals. The overlap of retries from this particular timing pattern is why the 21-second peak activity was witnessed.