


4
Artifacts and Pitfalls of Perfusion MRI
4.1 Introduction
Focus Point
•Subject movement can be a significant source of artifact in any PWI method
•DSC:
•Absolute perfusion quantification is difficult.
•Bolus dispersion can lead to underestimation of CBF.
•Blood-brain barrier breakdown can result in contrast leakage.
•DCE:
•EPI susceptibility limitations.
•Difficulty in the AIF estimation.
•Systematic errors and variability of the results according to the models used.
•ASL:
•ASL techniques can be prone to static tissue subtraction errors.
•Quantification model errors.
•Labeling efficiency issues.
As described in the previous chapter, there are three different MR methods for measuring brain perfusion: the dynamic susceptibility contrast (DSC) and dynamic contrast-enhanced (DCE) imaging methods, which require exogenous contrast administration (intravenous bolus administration of gadolinium), and arterial spin labeling (ASL), which uses the patient's own water molecules as an endogenous diffusible tracer and is performed without exogenous contrast.
Over the past several years, many technical improvements in MR scanner hardware and software (higher field strength, multichannel coils, parallel imaging, etc.) have made these perfusion weighted imaging (PWI) techniques more accurate and robust and have enabled their implementation in research applications and clinical routines.
However, there remain a number of limitations and issues that must be taken into account whenever acquiring and interpreting perfusion methods since there are several assumptions and model fits involved, which can be prone to artifacts and pitfalls.
The scope of this chapter is not to convey the idea that PWI might be unreliable, but on the contrary to introduce and analyze the limitations and pitfalls in a qualitative way, as well as to evaluate possible mitigating strategies or solutions to overcome them. In that sense, the potential user of PWI techniques will be able to avoid or correct errors and make sound
75

76 |
Advanced MR Neuroimaging: From Theory to Clinical Practice |
interpretations, taking advantage of the very powerful current MR perfusion methodologies, which should be used to provide unique information regarding cerebral hemodynamics.
4.2 Dynamic Susceptibility Contrast (DSC) Imaging Limitations
4.2.1 Subject Motion
As in any other MRI sequence the movement of the patient is a significant source of artifacts. Especially in the DSC technique, due to it involving the rapid injection of a bolus of contrast agent (preferably with an injector system), a noticeable percentage of patients will probably move at the time of the injection. In a small number of patients, this motion can be so severe, that the data cannot be safely processed and the exam is useless.
Fortunately, there is a relatively easy solution if the motion is limited; cut the initial images (before the bolus reaches the brain) during which period the subject is more likely to move due to the injection. The perfusion data can then be calculated using the rest of the images, which can be of good quality. However, there remains the limitation of baseline image calculation since this will not correspond anatomically to the rest of the images, which can substantially degrade the signal–time curves.
A more complete and safer solution is to use image registration techniques to correct for subject movement. First, as a quality control method, an inspection of the raw data before signal processing is recommended so that signal discontinuities due to motion artifacts can be omitted from the baseline estimation or curve integration. Then, image registration for the alignment of the source perfusion dataset with T1-weighted and/or FLAIR images can be used to correct for subject movement (Willats et al., 2006). However, it has to be stressed that while in-plane motion is generally approachable to correct for, through-plane motion correction for 2D acquisitions with interslice spacing is especially difficult (Welker et al., 2015). This is because, in order to increase temporal resolution, limited spatial coverage is usually acquired, resulting in relatively large gaps between the slices acquired (Kosior et al., 2007). Eventually, if the motion exceeds certain limits, no registration technique can overcome the interpretation limitations and the study should be repeated if possible.
4.2.2 Relationship between MR Signal and Contrast Concentration
As discussed in the previous chapter one of the fundamental assumptions used in the DSC modeling approach is the so-called assumption of linearity; that is, the relaxation rate (R2 = 1/T2 ) is linearly proportional to the intravascular concentration of the contrast agent (Kiselev, 2001). In fact, based on this assumption, the contrast agent concertation is not directly measured in PWI, but rather indirectly estimated from the changes in the relaxation rates (R2 or R2*). However, it has been shown that this linear relationship may vary, depending on contrast agent concentrations and tissues, with the relaxation rate measured inside arteries varying nonlinearly. Based on theoretical models, it has been shown also that the coupling constant can strongly depend on the pulse sequence employed as well as the vascular morphology. For example, Boxerman et al., (1995) showed that the relaxivity of a tissue will depend on the proportion of different vessels locally involved since there exists a threshold in vessel diameter (10–20 μm) for the relaxivity to change. This would mean that venules and arterioles would contribute differently comparing to capillaries.
Hence the linearity assumption may introduce systematic errors especially regarding absolute quantification (Calamante et al., 2009). The study by Calamante et al. (2009) characterized the associated perfusion errors, concluding that large errors were found when the linear assumption was used and that errors could be greatly reduced when using a quadratic model,
Artifacts and Pitfalls of Perfusion MRI |
77 |
and quantifying perfusion as a relative measure. Nevertheless, it has to be stressed that the change in relative parameters (i.e., relative cerebral blood volume [rCBV] and relative mean transit time [MTT]) is less severe.
4.2.3 Bolus Delay and Dispersion
As analytically described in the previous chapter, the perfusion maps used in DSC imaging are calculated from the time curve data using deconvolution of the arterial input function (AIF) (Calamante et al., 2006).
Nevertheless, especially in patients with vascular abnormalities, the bolus can either get delayed in its transit to tissue or be dispersed, resulting in perfusion measurement errors since the AIF is commonly measured in a major artery. Hence, the inaccuracy in the AIF is one of the major potential sources of error in perfusion quantification. Its effect depends on the choice of deconvolution algorithm and has been shown to lead to CBF underestimation and consequently MTT overestimation (Calamante et al., 2000). More specifically, it has been shown that with delays of 1–2 sec, the underestimation in CBF can reach 40% and the overestimation in MTT 60%. Moreover, due to the different delays and dispersions among different areas, this error may vary drastically from one region of the brain to another. One way to mitigate this pitfall is by measuring the AIF locally, as close to the tissue of interest as possible (Lorenz et al., 2006; Willats et al., 2011). Generally, the effect of dispersion is more difficult to mitigate compared to delay since modeling of the vascular effects is required (Calamante et al., 2000; Calamante et al., 2013), and is usually left uncorrected, which should be taken into account, especially in stroke patients. An excellent recent review paper (Calamante, 2013) describes in exhaustive detail all the key factors that should be considered when measuring the AIF in DSC-MRI quantification, and all the issues that users must be aware of when performing or analyzing DSC-MRI.
4.2.4 BBB Disruption and Leakage Correction
Gadolinium-containing contrast agents are normally excluded by the blood-brain barrier (BBB) and cannot enter the extracellular spaces of the brain and spinal cord. The disruption of the BBB caused by diseases like enhancing tumors, subacute infarcts, etc., result in leakage of the contrast agent into the extravascular space. This leakage should be corrected for because it can lead to systematic errors due to the additional pronounced T1and T2*-relaxation effects that violate the fundamental assumption of tracer kinetic modeling on which DSC is based, that no recirculation of the contrast agent occurs (see Chapter 3, Section 3.2.2). Hence, T1 shortening from extravascular gadolinium can lead to increased signal and may blunt the desired T2* shortening on which DSC is based on.
Several strategies exist to minimize this effect, from simple techniques to more sophisticated models of the first pass kinetics (Bjornerud et al., 2011; Boxerman et al., 2012).
One simple and popular method is called preloading. Typically, one-fourth to one-third of the total dose is administered about 5–10 min before the dynamic imaging, and usually another sequence, like a T1-weighted to guide the perfusion section positioning, is run in between. This “preloading” of gadolinium reduces contaminating T1 effects by shortening the pre-bolus intra-voxel T1, raising the baseline signal so that T2* changes can then be better appreciated. Another approach is to reduce the RF-flip angle of the DSC acquisition sequence, although this is substantially restricted by signal-to-noise ratio limitations.
Other methods to compensate for gadolinium extravasation include model-based leakage correction algorithms that linearly fit the ΔR2*(t) effect to functions derived from nonenhancing tissue (Quarles et al., 2009; Schmainda et al., 2004), leading to estimates of a leakage
78 |
Advanced MR Neuroimaging: From Theory to Clinical Practice |
contamination term, generating corrected rCBV maps and vascular permeability measurements. Studies have shown that the preloading method with post-processing leakage correction techniques are the two methods that best distinguish rCBV in tumor from normal brain in the presence of gadolimium leakage effects (Paulson and Schmainda, 2008; Welker et al., 2015). In fact, the ASFNR recommendations for clinical performance of MR dynamic susceptibility contrast perfusion imaging of the brain of 2015, highly endorse the use of preload plus model-based post-processing leakage correction for single-echo gadolinium-based DSC-MRI.
4.2.5 Absolute versus Relative Quantification
The most common reported value associated with DSC-MRI techniques in the evaluation of brain tumors is rCBV since it can be derived qualitatively by integrating the relaxivity–time curves without adjustment for the AIF, especially if it is normalized to the contralateral normal appearing white matter (Welker et al., 2015; Sugahara et al., 2000). Thus, a region of perceived perfusion abnormality may be quantitatively evaluated taking into account the contralateral normal region, with the result expressed as a unitless ratio. Another analysis method is the display of histograms, which can provide a meaningful representation of the distribution of perfusion values within a given ROI.
One of the most important points in DSC quantification is the interand intra-subject comparisons with contralateral normalization. The main limitation is that measurements may vary with region of interest (ROI) size and more importantly placement, hence the methodology used should be consistent and comparable, avoiding large blood vessels or other structures that may influence the result (Calli et al., 2006). For example, bone or ventricles should always be excluded from a ROI, and a consistent evaluation of the anatomical region is needed since the proportion of gray matter and white matter may also confound perfusion results (Caseiras et al., 2008; Wetzel et al., 2002).
However, this technique of normalization can be subjective and introduces user-dependent variability. Moreover, it can be quite time consuming, especially taking into account the time restrictions during the clinical routine. To mitigate this problem, Bedekar et al., (2010), demonstrated a method called standardization as an objective means of translating all rCBV values to a consistent scale. They stated that this approach can reduce inter-patient and inter-study variability for the same tissue type, thus enabling easy and accurate visual and quantitative comparison across studies (Bedekar et al., 2010).
The subcommittee of the American Society of Functional Neuroradiology (ASFNR) Clinical Practice Committee, in their recommendations for clinical performance of DSC-MRI perfusion imaging (Welker et al., 2015), proposed that “clinical DSC-MRI results should be reported qualitatively unless sufficient age-matched normative data are available for the specific scanner, acquisition technique, and post-processing method employed.” It seems that the establishment of an appropriate normative database can be challenging and subjective; hence, relative quantitation may often be more meaningful than absolute quantification. Nevertheless, absolute quantification of CBV and CBF is possible but it requires specialized pulse sequences and acquisition methodologies with adequate processing software in order to derive the AIF (Essig et al., 2013).
Especially for an absolute quantification of CBF (i.e., milliliters per 100 grams per minute), a patient-specific scaling factor should be used. A number of methods have been proposed to mitigate absolute quantification, including ASL measurements deriving a patient-specific correction factor (the ASLand DSC-CBF ratio) calculated only in short-arrival-time regions (Zaharchuk et al., 2010), and a calibration approach using phase contrast magnetic resonance angiography (PC-MRA) measurements to encode the velocity of flowing spins (Bonekamp et al., 2011).

Artifacts and Pitfalls of Perfusion MRI |
79 |
4.3 Dynamic Contrast Enhancement (DCE) Imaging Limitations
DCE-MRI is generally more complex and challenging than DSC-MRI, especially regarding kinetic analysis and systematic errors that might be introduced. Nevertheless, an increase in the clinical use of DCE-MRI has been noted during the last few years, but mostly in academic medical centers. A convenient and practical approach in brain tumor MR perfusion is to perform DCE-MRI before DSC-MRI so that the administered gadolinium can be used as a preload for leakage correction (see Section 4.2.4).
4.3.1 Suitability of Tumor Lesions
According to the DCE MRI Technical Committee (2012) of the Radiological Society of North America (RSNA), part of the Quantitative Imaging Biomarkers Alliance (QIBA) initiative (http://rsna.org/QIBA_.aspx), there is also the issue of determining the suitability of tumor lesions to perform a DCE exam. “Patients suitable for DCE-analysis must possess at least one tumor >2 cm, away from areas subject to large degrees of cardiac pulsatility artifact, that is not largely cystic or necrotic.” Despite the efforts to enroll only suitable patients, on occasion, subsequent analysis might not be feasible due to the following reasons:
•Lack of a tumor of suitable size and/or necrotic
•Failure of gadolinium injection
•Patient motion not correctable with motion-correction algorithms
4.3.2 Subject Motion
Again, subject motion is a significant source of artifacts since various forms of patient motion may contribute to the degradation of signal (respiration, swallowing, involuntary head movement during injection) unless techniques are employed to mitigate their effects. Generally, motion artifacts will largely depend on the choice of imaging sequence used. For example, echo planar imaging (EPI) although very fast can be problematic since it has high suscepti- bility-related artifacts and is associated with image distortion and “N/2”-type ghosting. Rapid methods employing k-space sub-sampling suffer from point-spread function problems and three-dimensional methods may suffer from phase-wrap effects, and might generally cause a degradation in image quality. Fortunately, motion artifacts in the brain are generally smaller than in other areas of the body, and are amenable to correction via registration strategies as the motion is generally rigid body.
4.3.3 Estimation of Arterial Input Function (AIF)
A fundamental requirement for the extraction of pharmacokinetic information from DCEMRI data is the accurate determination of the arterial input function (AIF). Although ideally the AIF should be derived from the same DCE-MRI data, in practice, this can be challenging and depends on the location of the measurement or the particular method used to acquire the AIF (Garpebring et al., 2013). In particular, the poor temporal resolution or excitation as well as the flow sensitivity of the method used and saturation effects can lead to degradation of the AIF estimation. Therefore, alternative methods should be employed, like the “population-derived” AIF proposed by Parker et al. (2006), or additional acquisition strategies employing a measurement of a pre-bolus using higher temporal sampling (Viallon et al., 2015).
80 |
Advanced MR Neuroimaging: From Theory to Clinical Practice |
4.3.4 Temporal and Spatial Resolutions
Temporal and spatial resolution is obviously closely related to the extraction of pharmacokinetic information from DCE-MRI data. Pharmacokinetic modeling requires high temporal resolution to provide a comprehensive description of the underlying causes of contrast agent uptake in a tissue related to the pathology in question (Jahng et al., 2014). Hence very rapid data acquisitions are needed to examine the flow rates in DCE MRI. Unfortunately, there is a price tag for this and that is low signal to noise ratio (SNR) or loss of precision. Both temporal and spatial resolution may affect the estimation of AIF as mentioned above. Low temporal resolution may lead to inaccurate AIF while low spatial resolution may lead to a partial volume effect and introduce inaccuracies in AIF estimation.
4.3.5 Variability of Results According to the Models Used
The accuracy and precision of the derived DCE parameters is vital before it can be used on a larger scale since the aforementioned variety of factors may affect the clinical information. Many efforts are currently under way to evaluate the accuracy and assess the reliability of different models and software, using clinical data as well as phantoms (Huang et al., 2014; Kim et al., 2014; Kudo et al., 2013; Shin et al., 2014). For example in the work by Huang et al. twelve (12) different software packages were compared on the same DCE datasets and considerable differences were reported. Nevertheless, despite the considerable differences, nearly all algorithms managed a satisfactory prediction of the therapy response, which suggests that DCE has the potential to be used in clinical routines if the consistency in the acquisition and data post-processing and evaluation is optimized and standardized.
A major limitation that has to be taken into account is the relatively high temporal resolution needed for the models used (about 1 sec, while a typical temporal resolution currently used is 5 sec). Therefore, their use is still relatively confined. Another limitation is that multiple models may be appropriate for a given tissue type and this is a typical problem associated with DCE data post-processing. Obviously, the results would then depend on the chosen model (Haroon et al., 2004; Sourbron, 2010). Therefore an appropriate selection is a crucial parameter.
The easiest approach to tackle the model selection problem or a “general rule of thumb” is the following: the most appropriate model is the simplest that provides a good fit to the data (Sourbron, 2010)!
Nevertheless, the more complex the tissue behavior, the more important the fitting difficulties of the models due to inhomogeneities since identical effects are modeled in undifferentiated ways, causing kinetic time-course inaccuracies (Buckley, 2002). Hence, the quantification model should be improved to a so-called “tissue homogeneity model,” to consider the incomplete exchange of intravascular and extravascular water.
Conversely, a “compensation” of the model for effects that have been omitted using less detailed parameters may introduce systematic errors into the hemodynamic modeling, again causing inaccuracies. In conclusion, there is always a tradeoff between precision and accuracy, as fitting processes become more stable (better and more robust models) and noise levels are reduced.
4.3.6 Quality Assurance
Another issue in DCE-MRI is that a number of scanner dependent factors may unfavorably affect the quality of derived data. These factors include the stability of the MR scanner over the duration of the DCE-MRI protocol, the accuracy of the predetermined T1 relaxation estimates (derived from the static and dynamic data), geometric distortion over a large field of view, and the excitation slice profile (http://rsna.org/QIBA_.aspx). Additionally, there can be lack of consistency in patient set-up,
Artifacts and Pitfalls of Perfusion MRI |
81 |
difficulty in matching and image fusing anatomical locations over sequential studies, and challenges in ROI definition and placement for analysis. Quality assessment and control procedures should be an essential part of the DCE protocols, and should be tested and validated prior to the commencement of the exam. The stability of the scanner should be evaluated using dedicated test objects as well as volunteers for the estimation of artifacts, especially regarding the T1 measurements.
In conclusion, the quality of derived DCE-MRI data can be optimized, provided appropriate quality control procedures are followed and staff are appropriately trained to recognize the problems that may occur.
4.4 Arterial Spin Labeling (ASL) Imaging Limitations
There are a number of artifacts and pitfalls that can potentially affect correct perfusion quantification in the ASL techniques. The main potential sources of errors are described in the following section.
4.4.1 Subject Motion
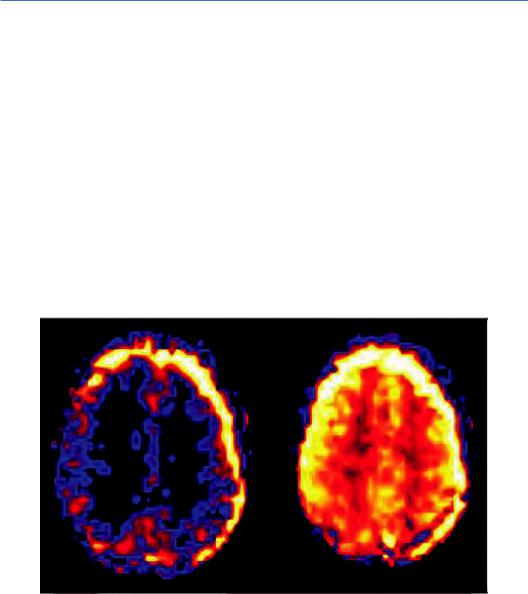
Patient motion is a common problem and a significant source of artifacts in ASL. The main reason is that, due to the relatively low SNR of the perfusion-weighted images in ASL, multiple repetitions are required (~40) to acquire enough data to increase it to satisfactory levels, resulting in very long scan times (>30 min), making the sequence sensitive to motion artifacts. In particular, patient movement between control and tagging sequences may appear as peripheral blurring around the area of interest or as variations in brightness, as illustrated in Figure 4.1.
Despite the use of signal intensity averaging and spatial coregistration steps, the most consistent motion-related pattern observed is high signal intensity strips in the periphery of the brain, producing false hypoor hyper-perfusion signals (Deibler et al., 2008). Moreover, when there are large position changes or sudden movements, image registration approaches may be of limited efficacy and it might be preferable to exclude the involved images from the data postprocessing with little decrease in SNR (Ferré et al., 2013).
FIGURE 4.1 Motion artifacts on successive ASL slices manifest by varying contrast and a bright halo at the edge of the images. (Courtesy of Allen D. Elster, MRIquestions.com.)
82 |
Advanced MR Neuroimaging: From Theory to Clinical Practice |
(a) |
(b) |
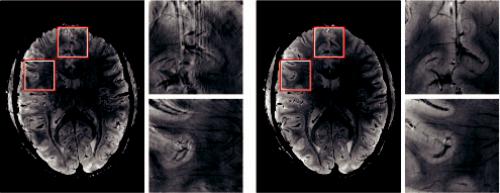
FIGURE 4.2 A slice by slice comparison of the corrected and uncorrected gradient echo images reveals the superior quality of the data acquired with motion correction. The images acquired without motion correction (a) show significant motion artifacts and blurring compared to (b). (From Stucht, D. et al., PLOS One, 10, e0133921, 2015. With permission.)
Very recently, conventional motion correction approaches have been replaced by imagebased prospective motion correction techniques, promising to alleviate the effects of even large position changes during the scan (Aksoy et al., 2014; Zun et al., 2014). One such method of image-based prospective motion correction is called PROMO (PROspective MOtion correction) and uses three orthogonal 2D navigator images with rigid-body tracking algorithm to correct for patient motion in real time. An example of the superior quality of motion correction algorithms is illustrated in Figure 4.2.
A slice by slice comparison of the corrected and uncorrected gradient echo images from Stucht et al. (2015) reveals the superior quality of the data acquired with motion correction.
State-of-the-art implementation of ASL includes background suppression with a separate neck labeling coil, which has been shown to improve sensitivity and reproducibility (Shen and Duong, 2011).
4.4.2 Physiological Signal Variations
Not infrequently, physiological modifications of signal intensity are observed and should be recognized in order to avoid mistaking them for pathology. If patients are scanned with their eyes open, bilateral regional increases in signal intensity of the occipital lobes can be observed, corresponding to visual cortex activation (Deibler et al., 2008). Amukotuwa et al. (2016) reported that following visual cortex activation, an increased occipital lobe CBF is more frequent and conspicuous with 2D PASL (utilizing an EPI readout) than with 3D pCASL, although they could not explain why (Amukotuwa et al., 2016). They overall suggest that it is preferable to ask patients to keep their eyes closed during the ASL sequence since this physiological occipital hyperperfusion is difficult to control for in the clinical population and may eventually mask or distract from pathological changes in CBF. Cortex activation has also been involved with phenomena related to the transit time and residual vascular signal (Ferré et al., 2013). Generally, a hyperfrontal pattern of regional CBF distribution has been previously reported using several perfusion methods; it is believed to be a normal finding in young and middle-aged patients and may decrease both with normal aging and with increasing cerebrovascular risk factors (Deibler et al., 2008).

Artifacts and Pitfalls of Perfusion MRI |
83 |
Another physiological variation is an increased signal-to-noise ratio as well as globally elevated absolute CBF values in pediatric patients. In fact, CBF values have been reported to increase to peak levels at about 3–8 years, and then gradually decrease to adult levels (Epstein, 1999; Wang et al., 2003). Deibler et al. report that possible explanations for this globally increased perfusion include higher baseline CBF, faster mean transit time, increased baseline magnetization values in gray and white matter, and increased T1 values in blood and tissue. Moreover, the immature paranasal sinus development in pediatric patients may play a role in the increased signal due to the decreased susceptibility artifacts.
On the other hand, one can observe areas of physiological hypoperfusion. These areas extend from the frontal and occipital horns to the frontal and parieto-occipital cortex. It is assumed that they generally correspond to the cerebral border zones between distal end branches of intracranial arteries (Hendrikse et al., 2008). This aspect may be important as it has been associated with the difficulty of obtaining reliable CBF measurements in the white matter (van Osch et al., 2009).
4.4.3 Magnetic Susceptibility Artifacts
The base of the skull, the temporal and frontal region as well as air field cavities are vulnerable to magnetic susceptibility artifacts, particularly visible with rapid acquisition EPI sequences, and are represented as signal intensity voids on ASL CBF maps. Furthermore, susceptibility artifacts are present around metallic implants and early post-surgical materials. Hematomas and calcifications might also be a problem in ASL as they may mask the underlying high signal intensity on ASL CBF maps. (Ferré et al., 2013). More specifically, calcified masses (e.g., meningiomas or oligodendrogliomas) may be particularly problematic in the assessment of tumor vascularity since susceptibility and neovascularity may coexist, producing competing effects (Deibler et al., 2008). These artifacts can be mitigated by improving imaging quality, using less sensitive image acquisition methods, parallel imaging and multi-channel coils (Boss et al., 2007; Ferré et al., 2012). However, in some instances ASL susceptibility artifacts manifest differently than conventional images. For example, in Figure 4.3a susceptibility artifact easily recognized on the source image may mimic a region of hypoperfusion/infarct on the ASL image.
FIGURE 4.3 A susceptibility artifact easily recognized on the source image (right) that mimics a region of hypoperfusion/infarct on the ASL image (left). (Courtesy of Allen D. Elster, MRIquestions.com.)
84 |
Advanced MR Neuroimaging: From Theory to Clinical Practice |
4.4.4 Coil Sensitivity Variations
It is possible that the receiver coils may exhibit asymmetric sensitivity and spatial variations due to defective elements. This might lead to regional signal differentiations adjacent to the problematic element, mimicking areas of hyperor hypoperfusion on ASL images. This artifact can be detected by evaluating the M0 image. It is then necessary to confirm and mitigate it, either by using an alternative coil if available, or by repositioning the patient’s head in a different area of the coil and repeating the exam. It can then be eliminated by image filtering or other post-processing techniques. Future applications of ASL may include M0 mapping and application of weighting factors to compensate for coil sensitivity issues (Deibler et al., 2008).
4.4.5 Labeling Efficiency
One of the most important parameters in ASL is obviously the labeling process. Since the overall signal is based on the subtraction of a “labeled” image (or “label” image) from an “unlabeled” image (or “reference” image) efficient labeling is the key to success. It is evident that labeling errors will produce errors in the perfusion parameters estimation. The labeling efficiency obtained in practice differs substantially between PASL and CASL sequences. For example, in the CASL technique, the labeling efficiency (also known as degree of inversion) is about 70% (Alsop and Detre, 1998). On the other hand, efficiency close to the ideal of 100% is often obtained using adiabatic RF pulses in PASL (Frank et al., 1997). Hardware limitations and power deposition restrictions may further reduce efficiency (Utting et al., 2003).
Another limitation that needs to be taken into account is that sections of the brain acquired toward the end of the labeling volume (please refer to Figure 3.9) may be less inversed (i.e., contain less label) than those acquired at the beginning. Consequently, signal intensity may be reduced in the more rostral images of the CBF maps when images are acquired from inferior to superior (Deibler et al., 2008).
To improve the overall labeling efficiency, there was a continuous effort by many research groups to further improve the labeling pulses. These efforts include, but are not limited to; mitigation of less labeling using a constant delay time (Yongbi et al., 2002), hyperbolic scant pulse (Silver et al., 1985), frequency offset corrected inversion pulse (Ordidge et al., 1996), and bandwidth-modulated adiabatic selective saturation and inversion pulse (Warnking and Pike, 2004).
4.4.6 Transit Time Effects
Another major pitfall in the quantitative estimate of cerebral perfusion with ASL is an intrinsic sensitivity of the method to the determination of the arterial transit time (ATT), that is, the time difference between the application of the spin inversion (or the tag) and the arrival of the tagged volume. The problem is that the ATT differs across the brain, even in healthy subjects, and that the ASL signal is exponentially dependent on this value. It may also vary regionally inside the brain as well as according to pathologies leading to underor overestimation of the CBF values (Qiu et al., 2010). This effect is more important in CASL techniques due to the much longer distance the blood has to travel between the labeling and exchange sites (Calamante et al., 2009).
Several techniques have been proposed to mitigate transit time effects, like the quantitative imaging of perfusion using a single subtraction (Alsop and Detre, 1996; Wong et al., 1998) or

Artifacts and Pitfalls of Perfusion MRI |
85 |
the concept of multiple post-labeling delay (PLD) acquisitions (Günther et al., 2001). Transit time is generally reduced with CASL and pCASL, while in PASL saturation pulses can be applied to the tagged volume to bypass the problem (Viallon et al., 2015).
In CASL transit time estimation typically requires the acquisition of multiple images with different delay time, while in PASL, different labeling time is used (Chen et al., 2012). It should be noted that the measurement of transit time involves the acquisition of a considerable amount of data, and therefore can be very time consuming. Moreover, both approaches cause an extension of scan time and this is a disadvantage as the risk for subject movement increases.
4.4.7 Errors from Quantification Models
There are several sources of error in the quantification of ASL perfusion values and therefore the models used should be as accurate and detailed as possible in order not to introduce systematic errors in the quantification procedure. The factors that affect quantification can either be assumed or directly measured and include the ATT, the T1 values of blood and tissue, the labeling efficiency and capillary permeability.
Most models include assumptions for these factors, which will be a source of error in perfusion quantification. For example, (1) most models use a fixed value for the T1 of blood since its estimation is difficult due to movement; (2) most models use the assumption of the free diffusion of water in a well-mixed tissue compartment although multiple compartments is a more accurate approach (Jahng et al., 2014); (3) many models may not include a vascular volume Vp, which can lead to significant errors in the fitted values of Ktrans (Buckley, 2002).
Nevertheless, in order for quantification of perfusion to be valid, the mitigation of errors should be implemented as follows:
1.Tissue T1 should be measured although this can lead to an increase of the total acquisition time. A very quick approach for T1 mapping based on two inversion recovery images and a reference image manages to map tissue T1 within a few seconds (Jahng et al., 2005, 2014).
2.To mitigate the error introduced from the single compartment models, separate blood and tissue component models should be preferred (Alsop and Detre, 1996).
4.5 Conclusions and Future Perspectives
As discussed in this chapter, the accuracy of brain perfusion quantification can be affected by a number of factors depending on the technique used. However, the scope of this chapter was not to convey the idea that perfusion techniques might be unreliable, but on the contrary to introduce and analyze the potential problems in terms of imaging artifacts and processingrelated factors. Thus, through increased knowledge, these limitations can be overcome, and allow their integration into modern clinical routine protocols. Indeed, these are powerful methodologies that should be used to provide unique information regarding cerebral hemodynamics through tumor cellularity, tissue invasion, metabolism, and microvasculature. Nevertheless, many of the artifacts shown in this chapter can be eliminated or significantly improved if promptly recognized, while solutions to many of these issues are the subject of current research. It seems that in the future, the use of protocols that combine exogenous contrast methods (DSC and DCE) with the endogenous contrast in ASL will have a great impact in the clinical routine.

86 |
Advanced MR Neuroimaging: From Theory to Clinical Practice |
References
Aksoy, M., Maclaren, J. R., Ooi, M., et al. (2014). Prospective optical motion correction for 3D pseudo-continuous arterial spin labeling. Proceedings of the 22nd Annual Meeting ISMRM, Milan, Italy, 424.
Alsop, D. C. and Detre, J. A. (1996). Reduced transit-time sensitivity in noninvasive magnetic resonance imaging of human cerebral blood flow. Journal of Cerebral Blood Flow & Metabolism, 16(6), 1236–1249. doi:10.1097/00004647-199611000-00019
Alsop, D. C. and Detre, J. A. (1998). Multisection cerebral blood flow MR imaging with continuous arterial spin labeling. Radiology, 208(2), 410–416. doi:10.1148/radiology.208.2.9680569 Amukotuwa, S. A., Yu, C., and Zaharchuk, G. (2016). 3D Pseudocontinuous arterial spin labeling in routine clinical practice: A review of clinically significant artifacts. Journal of
Magnetic Resonance Imaging, 43(1), 11–27. doi:10.1002/jmri.24873
Bedekar, D., Jensen, T., and Schmainda, K. M. (2010). Standardization of relative cerebral blood volume (rCBV) image maps for ease of both interand intrapatient comparisons. Magnetic Resonance in Medicine, 64(3), 907–913. doi:10.1002/mrm.22445
Bjornerud, A., Sorensen, A. G., Mouridsen, K., and Emblem, K. E. (2011). T1and T*2-dominant extravasation correction in DSC-MRI: Part I—Theoretical considerations and implications for assessment of tumor hemodynamic properties. Journal of Cerebral Blood Flow & Metabolism, 31(10), 2041–2053. doi:10.1038/jcbfm.2011.52
Bonekamp, D., Degaonkar, M., and Barker, P. B. (2011). Quantitative cerebral blood flow in dynamic susceptibility contrast MRI using total cerebral flow from phase contrast magnetic resonance angiography. Magnetic Resonance in Medicine, 66(1), 57–66. doi:10.1002/ mrm.22776
Boss, A., Martirosian, P., Klose, U., Nägele, T., Claussen, C. D., and Schick, F. (2007). FAIRTrueFISP imaging of cerebral perfusion in areas of high magnetic susceptibility differences at 1.5 and 3 Tesla. Journal of Magnetic Resonance Imaging, 25(5), 924–931. doi:10.1002/ jmri.20893
Boxerman, J. L., Hamberg, L. M., Rosen, B. R., and Weisskoff, R. M. (1995). MR contrast due to intravascular magnetic susceptibility perturbations. Magnetic Resonance in Medicine, 34(4), 555–566. doi:10.1002/mrm.1910340412
Boxerman, J. L., Prah, D. E., Paulson, E. S., Machan, J. T., Bedekar, D., and Schmainda, K. M. (2012). The Role of preload and leakage correction in gadolinium-based cerebral blood volume estimation determined by comparison with MION as a criterion standard. American Journal of Neuroradiology, 33(6), 1081–1087. doi:10.3174/ajnr.a2934
Buckley, D. L. (2002). Uncertainty in the analysis of tracer kinetics using dynamic contrastenhanced T1-weighted MRI. Magnetic Resonance in Medicine, 47(3), 601–606.
Calamante, F. (2013). Arterial input function in perfusion MRI: A comprehensive review. Progress in Nuclear Magnetic Resonance Spectroscopy, 74, 1–32. doi:10.1016/j.pnmrs.2013.04.002 Calamante, F., Connelly, A., and Osch, M. J. (2009). Nonlinear ΔR*2 effects in perfusion quantification using bolus-tracking MRI. Magnetic Resonance in Medicine, 61(2), 486–492.
doi:10.1002/mrm.21839
Calamante, F., Gadian, D. G., and Connelly, A. (2000). Delay and dispersion effects in dynamic susceptibility contrast MRI: Simulations using singular value decomposition. Magnetic Resonance in Medicine, 44(3), 466–473. doi:10.1002/1522-2594(200009)44:3 <466::aid-mrm18>3.3.co;2-d
Artifacts and Pitfalls of Perfusion MRI |
87 |
Calamante, F., Willats, L., Gadian, D. G., and Connelly, A. (2006). Bolus delay and dispersion in perfusion MRI: Implications for tissue predictor models in stroke. Magnetic Resonance in Medicine, 55(5), 1180–1185. doi:10.1002/mrm.20873
Calli, C., Kitis, O., Yunten, N., Yurtseven, T., Islekel, S., and Akalin, T. (2006). Perfusion and diffusion MR imaging in enhancing malignant cerebral tumors. European Journal of Radiology, 58(3), 394–403. doi:10.1016/j.ejrad.2005.12.032
Caseiras, G. B., Thornton, J., Yousry, T., Benton, C., Rees, J., Waldman, A., and Jager, H. (2008). Inclusion or exclusion of intratumoral vessels in relative cerebral blood volume characterization in low-grade gliomas: Does it make a difference? American Journal of Neuroradiology, 29(6), 1140–1141. doi:10.3174/ajnr.a0993
Chen, Y., Wang, D. J., and Detre, J. A. (2012). Comparison of arterial transit times estimated using arterial spin labeling. Magnetic Resonance Materials in Physics, Biology and Medicine, 25(2), 135–144. doi:10.1007/s10334-011-0276-5
DCE MRI Technical Committee. (2012, July). DCE MRI quantification profile, quantitative imaging biomarkers alliance. Version 1.0. Reviewed Draft. QIBA. Retrieved from http:// rsna.org/QIBA_.aspx.
Deibler, A., Pollock, J., Kraft, R., Tan, H., Burdette, J., and Maldjian, J. (2008). Arterial spinlabeling in routine clinical practice, part 1: Technique and artifacts. American Journal of Neuroradiology, 29(7), 1228–1234. doi:10.3174/ajnr.a1030.
Epstein, H. T. (1999). Stages of increased cerebral blood flow accompany stages of rapid brain growth. Brain and Development, 21(8), 535–539. doi:10.1016/s0387-7604(99)00066-2
Essig, M., Shiroishi, M. S., Nguyen, T. B., Saake, M., Provenzale, J. M., Enterline, D. et al. (2013). Perfusion MRI: The five most frequently asked technical questions. American Journal of Roentgenology, 200(1), 24–34. doi:10.2214/ajr.12.9543
Ferré, J., Bannier, E., Carsin-Nicol, B., Gauvrit, J., Mineur, G., and Raoult, H. (2013). Arterial spin labeling (ASL) perfusion: Techniques and clinical use. Diagnostic and Interventional Imaging, 94(12), 1211–1223.
Ferré, J., Petr, J., Bannier, E., Barillot, C., and Gauvrit, J. (2012). Improving quality of arterial spin labeling MR imaging at 3 tesla with a 32-channel coil and parallel imaging. Journal of Magnetic Resonance Imaging, 35(5), 1233–1239. doi:10.1002/jmri.23586
Frank, L. R., Wong, E. C., and Buxton, R. B. (1997). Slice profile effects in adiabatic inversion: Application to multislice perfusion imaging. Magnetic Resonance in Medicine, 38(4), 558–564. doi:10.1002/mrm.1910380409
Garpebring, A., Brynolfsson, P., Yu, J., Wirestam, R., Johansson, A., Asklund, T., and Karlsson, M. (2013). Uncertainty estimation in dynamic contrast-enhanced MRI. Magnetic Resonance in Medicine, 69(4), 992–1002. doi:10.1002/mrm.24328
Günther, M., Bock, M., and Schad, L. R. (2001). Arterial spin labeling in combination with a look-locker sampling strategy: Inflow turbo-sampling EPI-FAIR (ITS-FAIR). Magnetic Resonance in Medicine, 46(5), 974–984. doi:10.1002/mrm.1284
Haroon, H. A., Buckley, D. L., Patankar, T. A., Dow, G. R., Rutherford, S. A., Balériaux, D., and Jackson, A. (2004). A comparison of Ktrans measurements obtained with conventional and first pass pharmacokinetic models in human gliomas. Journal of Magnetic Resonance Imaging, 19(5), 527–536. doi:10.1002/jmri.20045
Hendrikse, J., Petersen, E. T., Laar, P. J., and Golay, X. (2008). Cerebral border zones between distal end branches of intracranial arteries: MR Imaging. Radiology, 246(2), 572–580. doi:10.1148/radiol.2461062100
88 |
Advanced MR Neuroimaging: From Theory to Clinical Practice |
Huang, W., Barbodiak, D. P., Chen, Y., Chang, M., Chenevert, T. L., Dyvorne, H. et al. (2014). Variations of dynamic contrast-enhanced magnetic resonance imaging in evaluation of breast cancer therapy response: A multicenter data analysis challenge. Translational Oncology, 7(1), 153–166.
Jahng, G., Calamante, F., Li, K., and Ostergaard, L. (2014). Perfusion magnetic resonance imaging: A comprehensive update on principles and techniques. Korean Journal of Radiology, 15, 554–577.
Jahng, G., Stables, L., Ebel, A., Matson, G. B., Meyerhoff, D. J., Weiner, M. W., and Schuff, N. (2005). Sensitive and fast T1 mapping based on two inversion recovery images and a reference image. Medical Physics, 32(6 Part 1), 1524–1528. doi:10.1118/1.1915014
Kim, H. S., Goh, M. J., Kim, N., Choi, C. G., Kim, S. J., and Kim, J. H. (2014). Which combination of MR imaging modalities is best for predicting recurrent glioblastoma? Study of diagnostic accuracy and reproducibility. Radiology, 273(3), 831–843. doi:10.1148/ radiol.14132868
Kiselev, V. (2001). On the theoretical basis of perfusion measurements by dynamic susceptibility contrast MRI. Magnetic Resonance in Medicine, 46(6), 1113–1122. doi:10.1002/mrm.1307 Kosior, R. K., Kosior, J. C., and Frayne, R. (2007). Improved dynamic susceptibility contrast (DSC)-MR perfusion estimates by motion correction. Journal of Magnetic Resonance
Imaging, 26(4), 1167–1172. doi:10.1002/jmri.21128
Kudo, K., Christensen, S., Sasaki, M., Østergaard, L., Shirato, H., Ogasawara, K. et al. (2013). Accuracy and reliability assessment of CT and MR perfusion analysis software using a digital phantom. Radiology, 267(1), 201–211. doi:10.1148/radiol.12112618.
Lorenz, C., Benner, T., Chen, P. J., Lopez, C. J., Ay, H., Zhu, M. et al. (2006). Automated perfusion-weighted MRI using localized arterial input functions. Journal of Magnetic Resonance Imaging, 24(5), 1133–1139. doi:10.1002/jmri.20717
Ordidge, R. J., Wylezinska, M., Hugg, J. W., Butterworth, E., and Franconi, F. (1996). Frequency offset corrected inversion (FOCI) pulses for use in localized spectroscopy. Magnetic Resonance in Medicine, 36(4), 562–566. doi:10.1002/mrm.1910360410
Parker, G. J., Roberts, C., Macdonald, A., Buonaccorsi, G. A., Cheung, S., Buckley, D. L. et al. (2006). Experimentally-derived functional form for a population-averaged high- temporal-resolution arterial input function for dynamic contrast-enhanced MRI. Magnetic Resonance in Medicine, 56(5), 993–1000. doi:10.1002/mrm.21066
Paulson, E. S. and Schmainda, K. M. (2008). Comparison of dynamic susceptibility-weighted contrast-enhanced MR methods: Recommendations for measuring relative cerebral blood volume in brain tumors. Radiology, 249(2), 601–613. doi:10.1148/radiol.2492071659 Qiu, M., Maguire, R. P., Arora, J., Planeta-Wilson, B., Weinzimmer, D., Wang, J. et al. (2010). Arterial transit time effects in pulsed arterial spin labeling CBF mapping: Insight from a PET and MR study in normal human subjects. Magnetic Resonance in Medicine, 63(2),
374–384. doi:10.1002/mrm.22218
Quarles, C. C., Gochberg, D. F., Gore, J. C., and Yankeelov, T. E. (2009). A theoretical framework to model DSC-MRI data acquired in the presence of contrast agent extravasation. Physics in Medicine and Biology, 54(19), 5749–5766. doi:10.1088/0031-9155/54/19/006
Schmainda, K. M., Badruddoja, M. A., Joseph, A. M., Krouwer, H. G., Lund, R., Pathak, A. P. et al. (2004). Characterization of a first-pass gradient-echo spin-echo method to predict brain tumor grade and angiogenesis. AJNR. American Journal of Neuroradiology, 25(9), 1524–1532.
Shen, Q.. and Duong, T. Q. (2011). Background suppression in arterial spin labeling MRI with a separate neck labeling coil. NMR in Biomedicine, 24(9), 1111–1118. doi:10.1002/nbm.1666
Artifacts and Pitfalls of Perfusion MRI |
89 |
Shin, K., Ahn, K., Choi, H., Jung, S., Kim, B., Jeon, S., and Hong, Y. (2014). DCE and DSC MR perfusion imaging in the differentiation of recurrent tumour from treatment-related changes in patients with glioma. Clinical Radiology, 69(6), e264–e272. doi:10.1016/j. crad.2014.01.016
Silver, M. S., Joseph, R. I., and Hoult, D. I. (1985). Selective spin inversion in nuclear magnetic resonance and coherent optics through an exact solution of the Bloch-Riccati equation. Physical Review A, 31(4), 2753–2755. doi:10.1103/physreva.31.2753
Sourbron, S. (2010). Technical aspects of MR perfusion. European Journal of Radiology, 76(3), 304–313. doi:10.1016/j.ejrad.2010.02.017
Stucht, D., Danishad, K. A., Schulze, P., Godenschweger, F., Zaitsev, M., and Speck, O. (2015). Highest resolution in vivo human brain MRI using prospective motion correction. PLOS One, 10(7), e0133921. doi:10.1371/journal.pone.0133921
Sugahara, T., Ikushima, I., Korogi, Y., Kira, T., Liang, L., Shigematsu, Y. et al. (2000). Posttherapeutic intraaxial brain tumor: The value of perfusion-sensitive contrastenhanced MR imaging for differentiating tumor recurrence from nonneoplastic contrastenhancing tissue. AJNR. American Journal of Neuroradiology, 21(5), 901–909.
Utting, J. F., Thomas, D. L., Gadian, D. G., and Ordidge, R. J. (2003). Velocity-driven adiabatic fast passage for arterial spin labeling: Results from a computer model. Magnetic Resonance in Medicine, 49(2), 398–401. doi:10.1002/mrm.10363
van Osch, M. J., Buchem, M. A., Hendrikse, J., Kies, D. A., Teeuwisse, W. M., and Walderveen, M. A. (2009). Can arterial spin labeling detect white matter perfusion signal? Magnetic Resonance in Medicine, 62(1), 165–173.
Viallon, M., Cuvinciuc, V., Delattre, B., Merlini, L., Barnaure-Nachbar, I., Toso-Patel, S. et al. (2015). Erratum to: State-of-the-art MRI techniques in neuroradiology: Principles, pitfalls, and clinical applications. Neuroradiology, 57(10), 1075–1075. doi:10.1007/s00234-015-1548-y
Wang, J., Detre, J. A., Haselgrove, J., Jahng, G., Licht, D. J., Liu, C. et al. (2003). Pediatric perfusion imaging using pulsed arterial spin labeling. Journal of Magnetic Resonance Imaging: JMRI, 18(4), 404–413.
Warnking, J. M. and Pike, G. B. (2004). Bandwidth-modulated adiabatic RF pulses for uniform selective saturation and inversion. Magnetic Resonance in Medicine, 52(5), 1190–1199. doi:10.1002/mrm.20262
Welker, K., Boxerman, J., Kalnin, A., Kaufmann, T., Shiroishi, M., and Wintermark, M. (2015). ASFNR recommendations for clinical performance of MR dynamic susceptibility contrast perfusion imaging of the brain. American Journal of Neuroradiology, 36(6), E41–E51. doi:10.3174/ajnr.a4341
Wetzel, S. G., Cha, S., Johnson, G., Lee, P., Law, M., Kasow, D. L. et al. (2002). Relative cerebral blood volume measurements in intracranial mass lesions: Interobserver and intraobserver reproducibility study. Radiology, 224(3), 797–803. doi:10.1148/radiol.2243011014
Willats, L., Christensen, S., Ma, H. K., Donnan, G. A., Connelly, A., and Calamante, F. (2011). Validating a local Arterial Input Function method for improved perfusion quantification in stroke. Journal of Cerebral Blood Flow & Metabolism, 31(11), 2189–2198. doi:10.1038/ jcbfm.2011.78
Willats, L., Connelly, A., and Calamante, F. (2006). Improved deconvolution of perfusion MRI data in the presence of bolus delay and dispersion. Magnetic Resonance in Medicine, 56(1), 146–156. doi:10.1002/mrm.20940
Wong, E. C., Buxton, R. B., and Frank, L. R. (1998). Quantitative imaging of perfusion using a single subtraction (QUIPSS and QUIPSS II). Magnetic Resonance in Medicine, 39(5), 702–708. doi:10.1002/mrm.1910390506
90 |
Advanced MR Neuroimaging: From Theory to Clinical Practice |
Yongbi, M. N., Fera, F., Yang, Y., Frank, J. A., and Duyn, J. H. (2002). Pulsed arterial spin labeling: Comparison of multisection baseline and functional MR imaging perfusion signal at 1.5 and 3.0 T: Initial results in six subjects. Radiology, 222(2), 569–575. doi:10.1148/ radiol.2222001697
Zaharchuk, G., Straka, M., Marks, M. P., Albers, G. W., Moseley, M. E., and Bammer, R. (2010). Combined arterial spin label and dynamic susceptibility contrast measurement of cerebral blood flow. Magnetic Resonance in Medicine, 63(6), 1548–1556. doi:10.1002/mrm.22329 Zun, Z., Shankaranarayanan, A., and Zaharchuk, G. (2014). Pseudocontinuous arterial spin labeling with prospective motion correction (PCASL-PROMO). Magnetic Resonance in
Medicine, 72(4), 1049–1056. doi:10.1002/mrm.25024