

50000 / book1
.pdfChapter 9 |
Renewable Energy in the Context of Sustainable Development |
Box 9.4 | Black carbon and aerosols: Climate effects of air pollutants.
Black carbon (BC) is a short-lived air pollutant formed by incomplete combustion of fossil or biomass fuels. Prime sources of BC are agricultural and forest fires, (diesel) combustion engines, in particular maritime vessels running on heavy oil, and residential use of heating and cooking fuels (Bond et al., 2004; Lack et al., 2008). BC emissions are particularly high in developing countries. BC has detrimental health effects (see Section 9.3.4.3), and can accelerate climate change both through its heat-absorbing properties in the atmosphere, and by reducing the albedo of cloud, snow and ice surfaces (Ramanathan and Carmichael, 2008; Flanner et al., 2009; Lau et al., 2010). BC is emitted together with organic carbon (OC), and other aerosols like sulphates, that have a negative effect on radiative forcing. Therefore, the net warming effect of aerosol emissions from combustion is sourceand location-dependent, and still uncertain. Available literature suggests that contained combustion of fossil fuels and residential combustion of solid biomass results in net warming, while the net effects of open combustion (field fires) of biomass sources are negative, due to a higher ratio of reflective OC to absorptive BC aerosols (Bond et al., 2004; M. Jacobson, 2004; Hansen et al., 2005; Koch et al., 2007). Both processes play a prominent role in the formation of atmospheric brown clouds and other processes that exhibit strong regional climate impacts (Ramanathan et al., 2005, 2007), for example, alteration of the Indian Monsoon (Auffhammer et al., 2006) or larger warming in elevated regions of the tropics (Gautam et al., 2009).
BC abatement has been proposed as a significant means not only for climate change mitigation, but also for addressing additional sustainability concerns such as air pollution, inefficient energy services, and related health impacts on the poor (Grieshop et al., 2009). The provision of energy efficient and smoke-free cookers and soot-reducing technologies for coal combustion in small industries could have major benefits by reducing radiative forcing and combating indoor air pollution and respiratory diseases in urban centres (Ramanathan and Carmichael, 2008; see Sections 2.5.4 and 9.3.4.3). A switch from diesel to LPG in the public transport system in Delhi has resulted in net GHG savings and substantial reductions in BC loads (C. Reynolds and Kandlikar, 2008). However, it has been suggested that removing the ‘masking’ effect of reflective aerosols through air pollution control measures might accelerate the impacts from already-committed-to warming (Ramanathan and Feng, 2008; Carmichael et al., 2009).
tion also varies significantly between urban and rural areas. Therefore, cumulative lifecycle inventory results, that is, quantities of pollutants emitted per unit of energy delivered, must be interpreted with care regarding conclusions about potential impacts on human health and the environment (Torfs et al., 2007). The following results can only act as basic data for the estimation of specific impacts (see Section 9.3.4.3). Indoor air pollution caused by solid fuels in traditional cookstoves is discussed in Box 9.4 and Section 9.3.4.3.
Heat and electricity supply
For space heating and electricity production with fossil fuels and biomass (wood) combustion, the dominant contributor to lifecycle inventory results (per kWh of end-use energy) is the combustion stage, with typically a 70 to almost 100% share of the overall emissions (e.g., Jungbluth et al., 2005; C. Bauer, 2007; Dones et al., 2007) (see Figure 9.12). However, in the case of long distance transport of coal, natural gas, oil and wood fuel, the transport stage might become more important (e.g., C. Bauer, 2007, 2008). In general, natural gas causes the lowest emissions among fossil fuels. Contributions of different sections of the energy chains as well as total emissions vary within orders of magnitude with power plant technology, application of pollution control technologies (flue gas desulphurization, particulate filters, etc.) and characteristics of fuel feedstock applied, as indicated by minimum and maximum values in Figure 9.12.
In the case of space heating, for example, minimum and maximum figures represent the most and least efficient technology options among
the datasets evaluated. Additionally, the type of fuel (e.g., wood logs, chips or pellets in case of biomass) affects the results. The figures for solar heating are valid for a certain location in central Europe, and variation in solar irradiation is not considered in the range shown. In the case of fossil electricity generation, the results include country-specific averages for current technology and fuel supply for all European and a few other countries, such as the USA and China. Minimum and maximum values therefore mainly represent the countries with the most and least efficient power plant and pollution control technology, respectively.
The results from this assessment show that non-combustion RE technologies and nuclear power cause comparatively minor emissions of air pollutants, only from upstream and downstream processes. Also, the variations in the results, depending on both technologies applied and site of power generation (in terms of, for example, solar irradiation (Jungbluth et al., 2009) and wind conditions (EWEA, 2004)), are in general much lower for RE and nuclear than for fossil power and heating systems. The potential increase in overall emissions from the power system due to a more flexible operation of fossil power plants in response to feed-in of variable renewable electricity is not taken into account. Although not shown in Figure 9.12, the type of electricity used for the operation of the geothermal heat pump has a significant impact on the performance of this technology (Heck, 2007).
LCA literature including results on air pollution in developing countries is scarce, and available case studies could not be integrated into the results displayed in a consistent way. However, emissions at the higher
737

Renewable Energy in the Context of Sustainable Development |
Chapter 9 |
(a) |
Heat |
Electricity |
|
||
[g/kWh] |
30 |
|
|
NOx minimum |
|
|
25 |
NOx maximum |
|
SO2 minimum |
|
|
|
|
|
|
SO2 maximum |
|
20 |
|
|
15 |
|
|
10 |
|
|
5 |
|
|
0 |
|
Boiler |
Boiler |
Boiler |
Wood, |
Biogas, |
Thermal |
Steam |
Steam |
Steam |
Steam |
Steam |
Combined |
Combined |
Steam |
Gen II |
Wood, |
Biogas, |
Run-of- |
PV, |
Solar |
On- & |
Enhanced |
|
|
|
Boiler |
Cogen |
Collector |
Turbine |
Turbine, |
Turbine |
Turbine, |
Turbine |
Cycle |
Cycle, incl. |
Turbine |
Reactor |
Steam |
Cogen |
River & |
Roof-Top |
Thermal |
Offshore |
Geoth. |
|
|
|
|
|
|
|
incl CCS |
|
incl CCS |
|
|
CCS |
|
|
Turbine |
|
Reservoirs |
|
|
|
System |
Coal |
Oil |
Natural |
Biomass |
Solar |
Hard Coal |
Lignite |
Oil |
Natural Gas |
|
Nuclear |
Biomass |
Hydro |
Solar |
Wind |
Geoth. |
||||||
|
|
Gas |
|
|
|
|
|
|
|
|
|
|
|
|
|
|
|
|
|
|
|
(b)
[g/kWh]
2.5
PM2.5 minimum
PM2.5 maximum
NMVOC minimum
2.0
NMVOC maximum
X Not Analyzed
1.5
1.0
0.5
|
|
|
|
|
|
|
|
|
|
|
|
|
|
|
|
X |
|
|
|
|
|
|
0.0 |
Boiler |
Boiler |
Boiler |
Wood, |
Biogas, |
Thermal |
Steam |
Steam |
Steam |
Steam |
Steam |
Combined |
Combined |
Steam |
Gen II |
Wood, |
Biogas, |
Run-of- |
PV, |
Solar |
On- & |
Enhanced |
|
||||||||||||||||||||||
|
|
|
|
Boiler |
Cogen |
Collector |
Turbine |
Turbine, |
Turbine |
Turbine, |
Turbine |
Cycle |
Cycle, incl. |
Turbine |
Reactor |
Steam |
Cogen |
River & |
Roof-Top |
Thermal |
Offshore |
Geoth. |
|
|
|
|
|
|
|
|
incl CCS |
|
incl CCS |
|
|
CCS |
|
|
Turbine |
|
Reservoirs |
|
|
|
System |
Coal |
Oil |
Natural |
Biomass |
Solar |
Hard Coal |
Lignite |
Oil |
Natural Gas |
Nuclear |
Biomass |
Hydro |
Solar |
Wind Geoth. |
|
|
Gas |
|
|
|
|
|
|
|
|
|
|
|
Figure 9.12 | Cumulative lifecycle emissions per unit of energy generated of (a) NOx and SO2 and (b) NMVOC and PM2.5 for current heat and electricity supply technologies (C. Bauer, 2008; Viebahn et al., 2008; Ecoinvent, 2009); traditional biomass use not considered. Figures for coal and gas power chains with CCS are valid for near-future forecasts (C. Bauer et al., 2009).
738

Chapter 9 |
Renewable Energy in the Context of Sustainable Development |
end of the ranges shown may typically apply to developing economies that use older technologies, have less pollution control measures in place and possibly consume lower-quality fuels. Also, lack of environmental regulation in developing countries results in comparatively higher emissions. Molina and Molina (2004) report outdoor urban air pollution in cities from industry, energy and transport that is a factor of 10 or higher than in developed nations; the location of the emission sources in combination with the prevailing meteorological conditions are important factors in this respect. Air pollution abatement has gained importance since the early 1990s, in particular in China, resulting in a slowdown of sulphur emissions in Asia (Carmichael et al., 2002). The substantial potential of RE to contribute to air pollution abatement has been studied in particular for emerging economies’ electricity and transport sectors (Boudri et al., 2002; Aunan et al., 2004; Ramanathan and Carmichael, 2008; Creutzig and He, 2009; see Sections 9.4.4 and 10.6).
Transport fuels
Under a lifecycle approach, well-to-wheels air pollutant emissions of biomass fuel/vehicle systems differ significantly. These differences are caused by the feedstock used for fuel production, biomass yields, fuel production pathways and technologies, location of biomass growth and harvesting, as well as fuel characteristics and vehicle technologies (von Blottnitz and Curran, 2007; Cherubini and Strømman, 2011).
The use of gaseous fuels—both fossil and biomass origin—tends to reduce air pollution compared to liquid fuels (Zah et al., 2007). The effects of using biomass fuels and bioethanol and biodiesel blends on tailpipe emissions have been examined by numerous authors with varying results (Schifter et al., 2004, 2011; Niven, 2005; Coelho et al., 2006; Fernando et al., 2006; Goldemberg et al., 2008; Graham et al., 2008; Pang et al., 2008; Coronado et al., 2009; Costa and Sodré, 2009; Demirbas, 2009; Hilton and Duddy, 2009; Roayaei and Taheri, 2009; Yanowitz and McCormick, 2009; Yoon et al., 2009; Zhai et al., 2009; Park et al., 2010). Fuel blends, combustion and ambient temperatures as well as additives play a decisive role in air pollutant formation (Lucon et
al., 2005; Coelho et al., 2006; Graham et al., 2008; Ginnebaugh et al., 2010). Overall, the studies tend to agree that carbon monoxide (CO) and hydrocarbon emissions are reduced by use of both ethanol and biodiesel blends compared to gasoline and diesel, respectively, while NOx emissions seem to be higher. Increased NOx and evaporative emissions from oxygenates of biofuel blends can lead to higher concentrations of tropospheric ozone (Schifter et al., 2004; Agarwal, 2007). Increased aldehyde emissions have been reported for bioethanol in Brazil, which are less toxic than the formaldehydes originating from fossil fuels (Goldemberg et al., 2008; Graham et al., 2008; Anderson, 2009). Second-generation and future biofuels are expected to improve performance, when the combustion system is specifically adapted (Pischinger et al., 2008; Ußner and Müller-Langer, 2009).
Notter et al. (2010) and Zackrisson et al. (2010) suggested that future electric or fuel cell vehicles (see Section 8.3.1) offer a substantial potential for reductions in air pollution (as well as other environmental burdens) if electricity or hydrogen from RE sources is used as the energy carrier.
Shifting emissions from urban to less-populated areas can result in less exposure and therefore reduced impacts on human health (see Section 9.3.4.3). Despite increases in total emissions, some bioethanol blends used in flex-fuel vehicles in Brazil contributed to reductions of up to 30% in urban emissions, as most emissions originated from farming equipment, fertilizer manufacture and ethanol plants located in rural areas (Huo et al., 2009b). Similarly, the formation of secondary pollutants as aerosols and ozone in towns might be reduced, depending on atmospheric conditions including background concentrations of pollutants.
9.3.4.3Health impacts
The most important energy-related impacts on human health are those associated with air pollutant emissions by fossil fuel and biomass combustion (Ezzati et al., 2004; W. Paul et al., 2007). Air pollution, even at
Table 9.9 | Health impacts of important air pollutants (adapted from Bickel and Friedrich, 2005).
Primary Pollutants1 |
Secondary |
Impacts |
|||
Pollutants2 |
|||||
|
|
|
|
||
Particles |
|
cardio-pulmonary morbidity (cerebrovascular and respiratory hospital admissions, heart failure, chronic bronchi- |
|||
(PM10, PM2.5, black carbon) |
|
tis, upper and lower respiratory symptoms, aggravation of asthma), mortality |
|||
SO |
2 |
sulphates |
like particles3 |
||
NO |
x |
nitrates |
morbidity, like particles3 |
||
NOx+VOC |
ozone |
respiratory morbidity, mortality |
|||
CO |
|
|
cardiovascular morbidity, mortality |
||
|
|
|
|||
Polyaromatic Hydrocarbon |
|
cancers |
|||
|
|
|
|||
Lead, Mercury |
|
morbidity (neurotoxic and other) |
|||
|
|
|
|
|
|
Notes: 1. Emitted by pollution source. 2. created by chemical reactions in the atmosphere. 3. lack of specifi c evidence, as most available epidemiological studies are based on mass PM without distinction of components or characteristics.
739

Renewable Energy in the Context of Sustainable Development
current ambient levels, aggravates morbidity (especially respiratory and cardiovascular diseases) and leads to premature mortality (Table 9.9; Cohen et al., 2004; Curtis et al., 2006). Although the health effects of ambient air pollution result from a complex mixture of combustion products and are therefore difficult to attribute to a certain source or pollutant, negative effects have been most closely correlated with three species of pollutants in epidemiological studies: fine PM, SO2, and tropospheric ozone (Ezzati et al., 2004; Curtis et al., 2006). Significant reductions in mass emissions of pollutants by deployment of RE should yield increased health benefits, and opportunities for policy measures combining climate change and (urban) air pollution mitigation are increasingly recognized (see Sections 9.4.4.1, 10.6 and 11.3.1).
Household environmental exposures, including indoor air pollution (IAP) from the combustion of solid heating and cooking fuels, generally decline with increased development, whereas community-level exposures have been found to increase initially, and then gradually decline, with important distinctions between rural and urban areas (Smith and Ezzati, 2005; HEI, 2010). Exposure to IAP from the combustion of coal and traditional biomass is recognized as one of the most important causes of morbidity and mortality in developing countries (Bruce et al., 2002; Ezzati et al., 2004; Smith and Ezzati, 2005; Zhang and Smith, 2007). For example, comparative quantifications of health risks showed that in 2000, more than 1.6 million deaths and over 38.5 million disability-adjusted life-years (DALYs) were attributable to indoor smoke from solid fuels (WHO, 2002; Smith and Mehta, 2003; Smith et al., 2004; Torres-Duque et al., 2008). Figure 9.13 illustrates the magnitude of the health problems associated with IAP, which is projected to exceed other major causes of premature deaths (e.g., HIV/AIDS, malaria and tuberculosis) by 2030 (IEA, 2010a).
Many health problems like chronic obstructive pulmonary disease, cataracts and pneumonia are most severe for women and children, which are most exposed to indoor emissions (Smith et al., 2000; Pokhrel et al., 2005; Barnes et al., 2009; Haines et al., 2009; UNDP and WHO, 2009), and generally affect the poorest segment of the population (see Section 9.3.2).
In traditional uses, biomass-based fuels yield worse results with respect to contaminant concentrations than charcoal or coal (Kim
Chapter 9
Deaths |
2.5 |
|
2.0 |
||
premature |
||
1.5 |
||
Million |
||
1.0 |
||
|
||
|
0.5 |
|
|
0.0 |
2008 2030 |
2008 |
2030 |
2008 |
2030 |
2008 |
2030 |
Malaria |
Tuberculosis |
Smoke from |
HIV/AIDS |
|||
|
|
|
Biomass |
|
|
|
Figure 9.13 | Premature deaths from household air pollution and other diseases in 2008 and projected for 2030 (IEA, 2010a).
Oanh and Dung, 1999; Bailis and Cutler, 2004; Zhang and Smith, 2007). Mitigation options—besides the more costly switch to cleaner fuels (see Section 9.3.2)—for health impacts from IAP include improved cookstoves (ICS), ventilation and building design and behavioural changes (Smith et al., 2000; Bruce et al., 2004; Mehta and Shahpar, 2004; Palanivelraja and Manirathinem, 2010). Modern bioenergy technologies (ICS, biogas) can provide health benefits without fuel switching (Smith et al., 2007; Bailis et al., 2009), as well as additional environmental and social advantages (Haines et al., 2009) (see Section 2.5.7.2).
Non-combustion-related health impacts
Health impacts from energy technologies other than those described above can be regarded as relatively minor. Table 9.10 provides an overview of areas of concern for RE technologies as identified in this report.
For nuclear power, radiotoxicity of spent fuels and uranium tailings, including windblown radioactive dust dispersal, and radon gas from the mining stage are the most prominent health concerns (OECD/NEA, 2002; Abdelouas, 2006; Al-Zoughool and Krewski, 2009). Increased cancer risk for residents, particularly children, near nuclear power plants has been studied with contrasting results in different countries (Ghirga, 2010).
Table 9.10 | Overview of potential impacts on human health by RE technologies as reported in Sections 2.5, 4.6, 5.6 and 7.6. For solar and ocean technologies, no impacts were identifi ed.
RE Technology |
Potential Health Concerns |
|
|
|
|
|
Depending on feedstock and agricultural management, direct and indirect exposure to agrochemicals and derivatives like pesticides or nitrates, or smoke due to |
|
Bioenergy |
residue burning may cause local impacts |
|
|
Health impacts related to air pollutant emissions by combustion1 |
|
Geothermal Energy |
For some operations, hydrogen sulphide emission may cause local impacts |
|
|
|
|
Reservoir Hydropower |
Standing water bodies can lead to spread of vector-borne diseases in tropical areas |
|
Concentrations of population and migrant workers during construction of large dams may cause public health concerns |
||
|
||
|
|
|
Wind Energy |
Nuisance from noise and flickering |
|
|
|
Note: 1. See previous subsection for details.
740

Chapter 9 |
Renewable Energy in the Context of Sustainable Development |
9.3.4.4Water
Water is a critical and highly localized resource with multiple and competing uses, including energy. The condition and amount of water resources in a given location will influence the selection, design and performance of an energy technology; impacts from energy technologies will also vary geographically and temporally. Hence, implications for the water-energy nexus must be considered within a SD context. Literature holistically evaluating the impacts of energy technologies on water resources is limited, especially from a lifecycle perspective. While some broad conclusions can be drawn from the evidence presented in the following sections, additional research is needed to confirm many of the results and fill existing knowledge gaps.
In 2006, the energy and industrial sectors accounted for 45% of freshwater withdrawals in Annex I countries and 10% of freshwater withdrawals in non-Annex I countries (Gleick, 2008). As lesser-developed countries industrialize and improve access to energy services, additional freshwater resources may be required to meet the water demands of increased energy production. However, various metrics indicate that many developing countries already experience water scarcity problems, and climate change may exacerbate water stress (Rijsberman, 2006; IPCC, 2008; Dai, 2011). Thermal power plants may be especially vulnerable to conditions of water scarcity and climate change due to their continuous water requirements. Also, hydropower and bioenergy are highly dependent on water availability, and exhibit potentials for both increased competition for and mitigation of water scarcity (see Sections 2.5.5.1 and 5.10).
Operational water use and water quality impacts of electricity generation
Electricity sector impacts involve both water withdrawal and consumption.Water withdrawal is the amount of water removed from the ground or diverted from a water source, while consumption is the amount of water that is lost through evaporation, transpiration, human consumption and incorporation into products (Kenny et al., 2009). Both metrics have an important impact on local water availability, and often with trade-offs such that using existing technology only one impact can be reduced at a time. Water consumption by industry and power plants, while accounting for less than 4% of global water consumption, is an important consideration for water-scarce regions; this is particularly relevant in the context of future resource development, with water being effectively removed from the system and not available for other uses, for example, agriculture or drinking water (Shiklomanov, 2000).
While water is used throughout the lifecycle of most technologies, operational cooling needs for thermal power plants result in the withdrawal and consumption of more water than any other lifecycle phase, with the exception of biomass feedstock production (Fthenakis and Kim, 2010). Figure 9.14 depicts the variability in operational water consumption rates associated with electricity generation units and cooling technologies. Water consumption varies widely both within cooling technology categories, but especially across categories. The choice of cooling system is often site-specific and based on water availability,
local environmental regulations or quality impacts, parasitic energy loads, costs, or other considerations (J. Reynolds, 1980; Bloemkolk and van der Schaaf, 1996). Non-thermal technologies, with the exception of hydropower, are found to have the lowest operational and lifecycle withdrawal and consumptive water use values per unit electricity generated (Tsoutsos et al., 2005; Fthenakis and Kim, 2010). Substantial evaporation can occur from hydroelectric reservoirs, yet reservoirs often provide other beneficial services besides power production (e.g., flood control, freshwater supply, and recreation), and allocation schemes for determining water consumption from various reservoir uses can significantly influence reported water consumption values (Gleick, 1993; LeCornu, 1998; Torcellini et al., 2003). Research may be needed to determine the net effect of reservoir construction on evaporation in a specific watershed. Data shown in Figure 9.14 are from studies of US systems only, but represent a wide range of technology vintages and climatic conditions, both of which can affect water use rates (B. Miller et al., 1992), and thus their results are applicable and comparable to water use rates in other countries (EC, 2006).
Data for geothermal energy are not included in Figure 9.14 because in most situations, geothermal fluids are utilized for cooling before reinjection, and therefore no freshwater is consumed (Franco and Villani, 2009; see Section 4.5.3). Depending on technology, resource type and cooling system used, geothermal operational water consumption can range from near zero up to 15 m3/MWh (Fthenakis and Kim, 2010).
Reduced water levels or higher temperatures in water bodies may require once-through cooled thermal power plants, which withdraw large volumes of water but consume comparatively little, to run at lower capacities or to shut down completely (Poumadère et al., 2005). Addressing this vulnerability by utilizing recirculating cooling technologies, which withdraw less water, could lead to increases in water consumption (Figure 9.14), reductions in plant-level thermal efficiencies and increases in operating and installed costs (Tawney et al., 2005). Ambient air temperature increases may lead to reduced plant-level thermal efficiency and cooling system performance, resulting in higher water use rates (B. Miller et al., 1992; Turchi et al., 2010). Thermal power plant vulnerability can be reduced by utilizing alternative water sources, such as municipal wastewater, or by utilizing a dry-cooling system, yet there are cost, performance and availability trade-offs and constraints (EPRI, 2003; Gadhamshetty et al., 2006). Reservoirs and river levels may also be affected by climate change, altering water availability and hydropower performance capabilities and output (Harrison and Whittington, 2002; IPCC, 2008).
Electricity generation units can affect water quality through thermal and chemical pollution. During normal operation, electricity generation units with once-through cooling systems can elevate the temperature of water bodies receiving the cooling water discharge, which can negatively affect aquatic ecosystems and reduce fish yields (Kelso and Milburn, 1979; Barnthouse, 2000; Poornima et al., 2005; Greenwood, 2008; Kesminas and Olechnoviciene, 2008; Shanthi and Gajendran, 2009). Deposition of air pollutant emissions from the combustion of fossil fuels to water bodies can also affect water quality (Larssen et
741
Renewable Energy in the Context of Sustainable Development |
|
|
|
|
|
|
|
Chapter 9 |
||||||||||||||||||
/MWh][m3 |
|
|
|
|
|
|
|
|
|
|
|
|
|
|
|
|
|
|
|
|
|
|
|
CoolingHybrid |
209 m3/MWh |
|
|
|
|
|
|
Recirculating Cooling |
|
|
|
|
|
Once-Through |
|
Pond |
Dry |
Non-Thermal |
|||||||||||
|
|
|
|
|
|
|
|
|
|
|
|
|
|
|
|
Cooling |
Cooling |
Cooling |
|
Technologies |
||||||
|
5 |
|
|
|
|
|
|
|
|
|
|
|
|
|
|
|
|
|
|
|
|
|
|
|
|
|
|
|
|
|
|
|
|
|
|
|
|
|
|
|
|
|
|
|
|
|
|
|
|
|
|
|
|
|
|
|
|
|
|
|
|
|
|
|
|
|
|
|
|
|
|
|
|
|
|
|
|
|
||
|
|
|
|
|
|
|
|
|
|
|
|
|
|
|
|
|
|
|
|
Non Renewables |
|
|
|
|
||
|
|
|
|
|
|
|
|
|
|
|
|
|
|
|
|
|
|
|
|
|
|
|
|
|||
ConsumptionWater |
|
|
|
|
|
|
|
|
|
|
|
|
|
|
|
|
|
|
|
Renewables |
|
|
|
|
||
|
|
|
|
|
|
|
|
|
|
|
|
|
|
|
|
|
|
|
|
|
|
|
||||
4 |
|
|
|
|
|
|
|
|
|
|
|
|
|
|
|
|
|
|
|
|
|
|
|
|
|
|
|
|
|
|
|
|
|
|
|
|
|
|
|
|
|
|
|
|
|
|
|
|
|
|
|
||
|
|
|
|
|
|
|
|
|
|
|
|
|
|
|
|
|
|
|
|
|
|
|
|
|
||
Operational |
|
|
|
|
|
|
|
|
|
|
|
|
|
|
|
|
|
|
|
|
|
|
|
|
|
|
3 |
|
|
|
|
|
|
|
|
|
|
|
|
|
|
|
|
|
|
|
|
|
|
|
|
|
|
|
|
|
|
|
|
|
|
|
|
|
|
|
|
|
|
|
|
|
|
|
|
|
|
|
||
|
|
|
|
|
|
|
|
|
|
|
|
|
|
|
|
|
|
|
|
|
|
|
|
|
||
|
|
|
|
|
|
|
|
|
|
|
|
|
|
|
|
|
|
|
|
|
|
|
|
|
||
|
|
|
|
|
|
|
|
|
|
|
|
|
|
|
|
|
|
|
|
|
|
|
|
|
|
|
|
2 |
|
|
|
|
|
|
|
|
|
|
|
|
|
|
|
|
|
|
|
|
|
|
|
|
|
|
|
|
|
|
|
|
|
|
|
|
|
|
|
|
|
|
|
|
|
|
|
|
|
|
|
|
|
|
|
|
|
|
|
|
|
|
|
|
|
|
|
|
|
|
|
|
|
|
|
|
|
|
|
|
|
|
|
|
|
|
|
|
|
|
|
|
|
|
|
|
|
|
|
|
|
|
|
|
|
|
|
|
|
|
|
|
|
|
|
|
|
|
|
|
|
|
|
|
|
|
|
|
|
|
|
|
|
|
|
|
|
|
|
|
|
|
|
|
|
|
|
|
|
|
|
|
|
|
|
|
|
|
|
|
|
|
|
|
|
|
|
|
|
|
|
|
|
|
|
|
|
|
|
|
|
|
|
|
|
|
|
|
|
|
|
|
|
|
|
|
|
|
|
|
|
|
|
|
|
|
|
|
|
|
|
|
|
|
|
|
|
|
|
|
|
|
|
|
|
|
|
|
|
|
|
|
|
|
|
|
|
|
|
|
|
1
0 |
|
|
|
|
|
|
|
|
|
|
|
|
|
|
|
|
|
|
|
|
|
|
|
|
|
|
|
|
|
|
|
|
|
|
|
|
|
|
|
|
|
|
|
|
|
|
|
|
|
|
|
|
|
|
|
|
|
|
|
|
|
|
|
|
|
|
|
|
|
|
|
|
|
|
|
|
|
|
|
|
|
|
|
|
|
|
|
|
|
|
|
|
|
|
|
|
|
|
|
|
|
|
|
|
CSP |
Biopower Steam |
Biopower Biogas |
Nuclear |
Natural Gas CC |
Natural Gas CC with CCS |
Coal |
Coal with CCS |
Coal IGCC |
Coal IGCC with CCS |
Biopower Steam |
Nuclear |
Natural Gas CC |
|
Coal |
Biopower Steam |
Nuclear |
Natural Gas CC |
Coal |
CSP |
|
CSP Dish Stirling |
Biopower Biogas |
Natural Gas CC |
CSP |
PV |
Wind |
Ocean |
Hydropower |
||||||
|
|
|
||||||||||||||||||||||||||||||||
|
|
|
|
|
|
|
|
|
|
|
|
|
|
|
|
|
|
|
|
|
|
|
|
|
|
|
|
|
|
|
|
|
|
|
N: |
18 |
4 |
1 |
5 |
4 |
1 |
16 |
2 |
7 |
3 |
1 |
3 |
|
3 |
|
9 |
1 |
1 |
1 |
7 |
11 |
|
2 |
1 |
2 |
4 |
2 |
2 |
1 |
|
4 |
|
|
|
Sources: |
|
|
|
|
|
|
|
|
|
|
|
|
|
|
|
|
|
|
|
|
|
|
|
|
|
|
|
|
|
|
|
|
|
|
11 |
3 |
1 |
5 |
4 |
1 |
8 |
1 |
2 |
1 |
1 |
3 |
|
3 |
|
4 |
1 |
1 |
1 |
2 |
4 |
|
2 |
1 |
2 |
2 |
2 |
2 |
1 |
|
2 |
|
|
|
|
|
|
|
|
|
|
|
|
|
|
|
|
|
|
|
|
|
|
|
|
|
|
|
|
|
|
|
|
|
|
|
|
|
|
|
Figure 9.14 | Ranges of rates of operational water consumption by thermal and non-thermal electricity-generating technologies based on a review of available literature (m3/MWh). Bars represent absolute ranges from available literature, diamonds single estimates; n represents the number of estimates reported in the sources. Note that upper values for hydropower result from few studies measuring gross evaporation values, and may not be representative (see Box 5.2). Methods and references used in this literature review are reported in Annex II.
Notes: CSP: concentrating solar power; CCS: carbon capture and storage; IGCC: integrated gasifi cation combined cycle; CC: combined cycle; PV: photovoltaic.
al., 2006). Hydroelectric facilities can impact both temperature and dissolved oxygen content of the released water while also altering the flow regime, disturbing ecosystems and disrupting the sediment distribution process (Cushman, 1985; Liu and Yu, 1992; Jager and Smith, 2008; see Section 5.6). Tidal energy facilities located at the mouths of estuaries could affect the hydrology and salinity of estuaries and ocean thermal
energy conversion technologies can alter local water quality through the accidental release of toxic chemicals, such as ammonia and chlorine (Pelc and Fujita, 2002; Vega, 2002; see Section 6.5). Geothermal facilities can affect both surface and ground water quality through spillage of geothermal fluids at the surface during operation, leakage from surface storage impoundments, and through contamination of
742

Chapter 9 |
Renewable Energy in the Context of Sustainable Development |
nearby freshwater wells (Brophy, 1997; Dogdu and Bayari, 2004; see Section 4.5).
Water use of upstream processes
Water use in upstream processes (see Figure 9.7) can be high for some energy technologies, particularly for fuel extraction and biomass feedstock production (Fthenakis and Kim, 2010). Specifically, unconventional fossil fuel (e.g., oil shale, shale gas) exploration and processing techniques can have significantly greater water use rates than conventional exploration techniques, and may require freshwater to be imported from other watersheds (GAO, 2010; Kargbo et al., 2010; Parfitt, 2010; Veil, 2010). Further research is necessary to determine water use as a function of output energy content of the extracted fuel in unconventional production to facilitate comparison to other conventionally produced fuels.
Biomass feedstock may be used for electricity generation or converted into liquid fuels. To account for both naturally variable precipitation and irrigation freshwater required in feedstock production, the water footprint metric is used (Gerbens-Leenes et al., 2009). The water footprint of feedstock production is highly dependent on feedstock type, geographic region and local climatic conditions, and crop management practices (Berndes, 2002, 2008; Gerbens-Leenes et al., 2009; Wu et al., 2009; Harto et al., 2010; Stone et al., 2010). These factors may change from year to year, and the water footprint for an individual case may differ substantially from the global average. Estimates of water footprints for biomass grown for multiple purposes can also vary significantly due to the choice of allocation method (S. Singh and Kumar, 2011).
The current water footprint of biomass feedstock production for electricity generation is approximately 70 to 400 times greater than operational water consumption requirements for thermal power plants (Gerbens-Leenes et al., 2009; S. Singh and Kumar, 2011). The current global average water footprint (weighted by production mass) of biofuel feedstock production ranges from about 60 to 600 litres per MJ fuel (Gerbens-Leenes et al., 2009). Biodiesel feedstock water footprints are nearly two to four times greater than the water footprint for ethanol crops, because oilseed crops are less water efficient (GerbensLeenes et al., 2009; S. Singh and Kumar, 2011). Refining and processing biofuels require around 0.1 to 0.5 litres of water per MJ fuel, which is far less than feedstock production requirements but still considerably higher than those of conventional petroleum products (Berndes, 2002; King and Webber, 2008; Wu et al., 2009; Harto et al., 2010; S. Singh and Kumar, 2011).
Without proper management, increased bioenergy production could therefore increase competition for water in critical areas (see Section 2.5.5.1; Dornburg et al., 2008; Berndes, 2010; Fingerman et al., 2010). However, the proportion of irrigation freshwater to total water consumed varies considerably, and the relationship between vegetation and hydrological processes at the landscape scale is complex. Certain
feedstock production systems may drive land use towards systems with higher water productivity and decreased water competition, as, for example, woody crops grown in multi-year rotations. Some perennials can improve water retention functions on degraded lands, and considerable water efficiency gains are possible with improved agricultural management.
Quality impacts of upstream processes
Feedstock production, mining operations and fuel processing can also affect water quality (Larssen et al., 2006). Effluent from coal mining can degrade local water quality by lowering pH and increasing concentrations of solids and heavy metals; leachate water from overburden dumps can also have high metal concentrations (Tiwary, 2001). Effluent from uranium mining for nuclear fuel can increase concentrations of uranium, radium, selenium, molybdenum and nitrate in surrounding surfaceand groundwater (R.F. Kaufmann et al., 1976; van Metre and Gray, 1992; Au et al., 1995; Voitsekhovitch et al., 2006; Carvalho et al., 2007). Radioactive water contamination can also occur from reprocessing of spent nuclear fuel, although releases can be greatly reduced through effective regulation (EC, 1999; Suzuki et al., 2008; Yamada and Zheng, 2008). Operational oil tanker discharges (i.e., dumping of oil during tanker cleaning operations) are a continuous source of water pollution (Jernelöv, 2010; Rogowska and Namiesnik, 2010). Most countries have established strict limits and safety standards to prevent water pollution, yet this does not always prevent accidents (see Section 9.3.4.7).
If conventional row-cropping production methods are used, bioenergy feedstock production can have water quality impacts from fertilizer and pesticide use similar to other row crops, yet second-generation feedstocks in many regions require lower chemical inputs for production than non-energy row crops (Paine, 1996; McLaughlin and Walsh, 1998; Lovett et al., 2009). Discharges of organic distillery wastes can pollute local water bodies, but can be reduced through existing anaerobic digestion technologies (Giampietro et al., 1997; Wilkie et al., 2000)
9.3.4.5Land use
Most energy technologies have substantial land requirements when the whole supply chain is included. However, literature reporting lifecycle estimates for land use by energy technologies is scarce. The limited evidence available suggests that lifecycle land use by fossil energy chains can be comparable and higher than land use by RE sources (Hirschberg et al., 2006; Fthenakis and Kim, 2009).
A variety of metrics has been used in the literature to describe and compare land requirements by the dominating stage of different RE technologies, that is, the area occupied by the generating facility or cultivated for biomass feedstock. Examples are area occupied (m2/kW) and percent effective land use (Trieb et al., 2009; Rovere et al., 2010) or land footprint (m2 per capita) (Denholm and Margolis, 2008). Aspects that
743

Renewable Energy in the Context of Sustainable Development |
Chapter 9 |
need to be considered for a proper interpretation and comparison of land requirements include:
•Properties and conditions of the land required (e.g., arable land or brown-fields, close or remote to centres of demand);
•Quality of land use (exclusive or allowing for multiple use); and
•Duration and reversibility of the land transformation (former land use/cover, reclamation times).
In particular, the assessment of environmental impacts of land transformation is very complex, with many methodological challenges yet to be solved (Dubreuil et al., 2007; Scholz, 2007). These include issues such as landscape fragmentation (Jordaan et al., 2009), impacts on life support functions and ecosystem services, impacts on naturalness of areas, like regeneration times after different types of use, and impacts on biodiversity (Lindeijer, 2000; Scholz, 2007; Schmidt, 2008) (see Section 9.3.4.6).
For fossil energy chains and nuclear power, land use is dominated by upstream and downstream processes (see Figure 9.7), depending on type of mining operations or extraction (e.g., onsite, leaching, surface or underground mining), quality of mineral deposits and fuel, and supply infrastructure (Hirschberg et al., 2006; Fthenakis and Kim, 2009; Jordaan et al., 2009). As a result of high ash content, waste disposal sites contribute significantly to land use of coal fired power stations (Mishra, 2004; NRC, 2010). Aboveground land transformation of nuclear power chains has lower ranges than do fossil fuel chains. However, the necessity of maintaining future disposal sites for high-level radioactive waste shielded from access for very long time spans (10,000 to 100,000 years) can increase the occupational land use of nuclear facilities substantially (Gagnon et al., 2002; Fthenakis and Kim, 2009).
For most RE sources, land use requirements are largest during the operational stage. An exception is the land intensity of bioenergy from dedicated feedstocks, which is significantly higher than for any other energy technology and shows substantial variations in energy yields per hectare for different feedstocks and climatic zones. If biomass from residues or organic wastes is used, additional land use is small (see Section 2.3.1).
To the extent that solar PV and solar thermal installations can be roofmounted, operational land use is negligible, while for central PV plants and CSP design considerations can influence extent and exclusiveness of the land use (Tsoutsos et al., 2005; Denholm and Margolis, 2008; see Section 3.6.1). Geothermal generation has very low aboveground direct land use, but it increases considerably if the geothermal field is included for risk of land subsidence (Evans et al., 2009). The conservation of scenic landscapes and outstanding natural features, and related conflicts with tourism may arise as areas of concern (see Section 4.5.3.3). Similarly, the obstruction of landscape views both onand offshore has emerged as an issue for wind energy (see Section 7.6.3.2).
Run-of-river hydropower has very low lifecycle land use, while the values for reservoir hydropower differ greatly depending on the physical conditions of the site (Gagnon et al., 2002). The impoundment and presence of a reservoir stands out as the most significant source of impacts (Egré and Milewski, 2002), with social issues such as involuntary population displacement or the destruction of cultural heritage adding a critical social dimension (see Sections 9.5.1 and 5.6.1.7). In the case of multipurpose reservoir use, inundation effects cannot be exclusively attributed to electricity generation (see Section 5.10). For wind, wave and ocean or tidal current energy, spacing between the facilities is needed for energy dissipation. Thus, the total land or ocean area transformed is quite large, but secondary uses such as farming, fishing and recreation activities are often feasible (Denholm et al., 2009; M. Jacobson, 2009), though constrained access for competing uses may be an issue for certain ocean technologies (see Section 6.5.2).
To conclude, it should be noted that land requirements for the establishment and upgrade of distribution and supply networks of future energy systems may be substantial, and may increase in the future with rising shares of variable renewable sources.
9.3.4.6Impacts on ecosystems and biodiversity
Closely connected to land use are (site specific) impacts on ecosystems and biodiversity. Energy technologies impact ecosystems and biodiversity mainly through the following pathways:
•Direct physical destruction of habitats and ecosystems in the case of reservoir creation and alteration of rivers, surface mining, tidal barrages, waste deposits and land use changes from, for example, forest or grasslands to managed lands;
•Fragmentation of habitats, degradation of ecosystems and disturbance of certain species, for example, by infrastructure, harvesting operations or modifications in the built environment; and
•Deterioration of habitats due to air and water pollution.
While the latter is largely associated with fossil energy technologies and mining (M. Jacobson, 2009), thermal pollution, which is affecting aquatic life, constitutes a serious concern for all thermal technologies. Potential impacts of severe accidents in the extraction stage of fossil fuels can also be relevant (see Sections 9.3.4.4 and 9.3.4.7).
The assessment of impacts on biodiversity are not part of LCA methodologies, and even though efforts are made to establish and integrate indicators into the context of LCA (e.g., (Schmidt, 2008), no framework for the comparison of lifecycle impacts of different energy chains is currently available. An overview of potential concerns associated with RE technologies is provided in Table 9.11, followed by a short description of the status of knowledge. A broader discussion including potential benefits and mitigation measures is available in
744

Chapter 9 |
Renewable Energy in the Context of Sustainable Development |
Table 9.11 | Overview of potential negative impacts and concerns regarding ecosystems and biodiversity related to RE technologies as reported in Chapters 2 through 7 of this report; in depth discussion of technology-specifi c impacts and appropriate mitigation measures can be found in Sections 2.5.5, 3.6.1, 4.5.3, 5.6.1, 6.5.2, 7.6.2 and 7.6.5.
|
Loss of high quality natural habitats by conversion to managed lands, pressure on conservation areas, effects on agro-biodiversity and |
|
Bioenergy (dedicated feedstocks) |
wildlife by agricultural intensification, soil degradation, eutrophication and pesticide emissions to aquatic habitats, introduction of |
|
|
invasive or genetically modified species |
|
|
|
|
Bioenergy (residues) |
Residue removal may lead to soil degradation, loss of woody debris habitats in forestry systems |
|
|
|
|
Solar PV (field installations) |
Disturbance through installation stage, plant community change due to shading effects |
|
|
|
|
CSP |
Disturbance of fragile desert ecosystems |
|
|
|
|
Geothermal |
Impacts of hazardous chemicals in brine fluids in case of surface disposal, modifications of habitats in conservation areas |
|
|
|
|
Hydropower (general effects) |
Alteration of littoral, riverine and lentic ecosystems, interference with fish migratory routes, reduced access to spawning grounds and |
|
rearing zones, change in sediment loads of the river |
||
|
||
|
|
|
|
Habitat and special biotope loss through inundation (change of terrestrial to aquatic and riverine to lentic ecosystems), impacts of |
|
Hydropower (typical for reservoirs) |
changes in chemical composition and water temperature (downstream), changes in seasonal flow and flooding regimes, extirpation |
|
|
of native species/introduction of non-native species, alteration of the hydrological cycle downstream |
|
|
|
|
Ocean Tidal Barrage |
Alteration of marine and coastal ecosystems, changes in water turbidity, salinity and sediment movements in estuary affecting |
|
vegetation, fish and bird breeding spaces |
||
|
||
|
|
|
Ocean Salinity Gradient |
Brackish waste water impacts on local marine and riverine environment |
|
|
|
|
Ocean (Ocean Thermal Energy Conversion) |
Up-welling effect of nutrient rich water to surface may impact aquatic life |
|
|
|
|
Ocean (Wave energy, ocean and tidal current) |
Rotating turbine blades, noise, vibration and electromagnetic fields may impact sensitive species (elasmobranchs, marine mammals), |
|
disturbance of pelagic habitats and benthic communities |
||
|
||
|
|
|
Wind (Onshore) |
Disturbance of air routes of migratory birds, collision fatalities of birds/raptors and bats, avoidance or displacement from an area, |
|
reduced reproduction |
||
|
||
|
|
|
Wind (Offshore) |
Sound waves during construction may negatively affect marine mammals, disturbance of benthic habitats |
|
|
|
the technology chapters (see Sections 2.5.5, 3.6.1, 4.5.3, 5.6.1, 6.5.2, 7.6.2 and 7.6.5).
Scientific evidence regarding the impacts of RE technologies on biodiversity varies: for bioenergy, both local impacts of different feedstock production systems and consequences of large-scale deployment have been studied. There is evidence for both positive and negative local impacts of different feedstock production and management systems (including use of organic residues) on biodiversity (e.g., Semere and Slater, 2007; Firbank, 2008; Fitzherbert et al., 2008; Baum et al., 2009; Lovett et al., 2009; Schulz et al., 2009; Fletcher et al., 2011; Riffell et al., 2011). However, the exploitation of large bioenergy potentials is considered a reason for concern, with potential impacts on already fragmented and degraded areas that are rich in biodiversity and provide habitat for endangered and endemic species (e.g., Firbank, 2008; Sala et al., 2009; WBGU, 2009; Dauber et al., 2010; Beringer et al., 2011; see Sections 2.2.4., 2.5.5, 9.4.3.5, and 9.4.4). The overall impacts of bioenergy on biodiversity will also depend on the balance between the long-term positive effects of reduced future climate change, and the short-term negative effects of land use change (Dornburg et al., 2008).
For site-specific effects, ample evidence largely based on environmental impact assessments is available for hydropower (e.g., Rosenberg et al., 1997; Fearnside, 2001; IUCN, 2001; see Section 5.6), and to a certain extent for onand offshore wind farms (see Section 7.6.2) and some solar technologies (e.g., Tsoutsos et al., 2005). Less evidence is available for geothermal energy, and the variety of marine and tidal devices—other than tidal barrages—are in a too early stage of development to assess their biodiversity effects. However, the long-term and
population-level consequences of large-scale deployment need further research for all energy technologies.
9.3.4.7Accidents and risks
The comparative assessment of accident risks associated with current and future energy systems is a pivotal aspect in a comprehensive evaluation of energy and sustainability. Accidental events can be triggered by natural hazards (e.g., Steinberg et al., 2008; Kaiser et al., 2009; Cozzani et al., 2010), technological failures (e.g., Hirschberg et al., 2004a; Burgherr et al., 2008), purposefully malicious action (e.g., Giroux, 2008), and human errors (e.g., Meshakti, 2007;Ale et al., 2008).This section compares risks from accidents of different energy technologies on the basis of objective information for the probability of an event and the consequences of that event, focusing on societal risk measures (e.g., Jonkman et al., 2003). Impacts from normal operation, intentional actions, and violations of ethical standards, as well as voluntary versus involuntary risks and aspects of risk internalization in occupational safety are not covered. Additional risks related to large-scale deployment of renewable technologies are also discussed.
The risks of energy technologies to society and the environment occur not only during the actual energy generation, but at all stages of the energy supply chain (Hirschberg et al., 1998; Burgherr and Hirschberg, 2008). It had already been recognized in the early 1990s that accidents in the energy sector form the second largest group of man-made accidents worldwide, however in terms of completeness and data quality their treatment was not considered satisfactory (Fritzsche, 1992). In response to this, the Energy-Related Severe Accident Database (ENSAD) was developed,
745

Renewable Energy in the Context of Sustainable Development |
Chapter 9 |
established and is continuously updated by the Paul Scherrer Institute (e.g., Hirschberg et al., 1998, 2003; Burgherr and Hirschberg, 2008). The results presented here are focused on so-called severe accidents because they are most controversial in public perception and energy politics. A detailed description of the methodological approach is given in Annex II.
First, two complementary, fatality-based risk indicators are evaluated to provide a comprehensive overview. Fatalities were chosen because fatality data is typically most reliable, accurate and complete (Burgherr and Hirschberg, 2008); reducing risks to acceptable levels often includes fatalities since they are amenable to monetization (Viscusi, 2010); and actual or precursor events can provide an estimate for the maximum fatality potential of a technology (Vinnem, 2010). The fatality rate is based on the expected number of fatalities which occur in severe (≥5 fatalities) accidents, normalized to the electricity generation in GW-years.The maximum consequences are based on the maximum number of fatalities that are reasonably credible for a single accident of a specific energy technology.
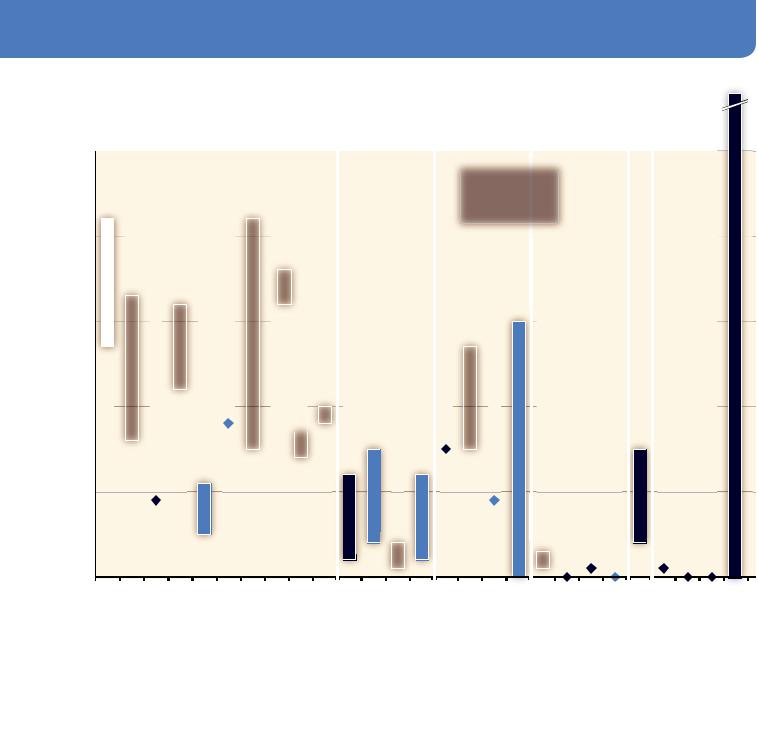
Figure 9.15 shows risk assessment results for a broad range of currently operating technologies. For fossil energy chains and hydropower, OECD and EU 27 countries generally show lower fatality rates and maximum consequences than non-OECD countries. Among fossil chains, natural gas performs best with respect to both indicators. The fatality rate for coal in China (1994 to 1999) is distinctly higher than for the other
non-OECD countries (Hirschberg et al., 2003; Burgherr and Hirschberg, 2007), however, data for 2000 to 2009 suggest that China is slowly approaching the non-OECD level (see Annex II). Among large centralized technologies, modern nuclear and OECD hydropower plants show the lowest fatality rates, but at the same time the consequences of extreme accidents can be very large. Experience with hydropower in OECD countries points to very low fatality rates, comparable to the representative Probabilistic Safety Assessment (PSA)-based results obtained for nuclear power plants, whereas in non-OECD countries, dam failures can claim large numbers of victims. Until 2010,12 two coremelt events have occurred in nuclear power stations, one at Three Mile Island 2 (TMI-2, USA, 1979) and one at Chernobyl (Ukraine, 1986) (see Annex II). However, the Chernobyl accident is neither representative of operating plants in OECD countries using other and safer technologies, nor of today’s situation in non-OECD countries (Hirschberg et al., 2004a; Burgherr and Hirschberg, 2008). New Generation III reactors are expected to have significantly lower fatality rates than currently operating power plants, but maximum consequences could increase due to the tendency towards larger plants (see Annex II). All other renewable technologies exhibit distinctly lower fatality rates than fossil chains, and are fully comparable to hydro and nuclear power in highly developed countries. Concerning maximum consequences, those renewable sources clearly outperform all other technologies because their decentralized nature strongly limits their catastrophic
Coal |
|
Oil |
|
Natural |
Gas |
Nuclear |
|
Hydro |
(Reservoir) |
Other |
Renewables |
|
|
|
|
|
|
OECD |
|
|
|
|
|
|
|
|
|
|
|
|
|
|
|
|
0.12 |
|
|
|
|
|
|
|
|
|
|
|
|
|
|
|
|
|
|
|
|
|
|
|
|
272 |
|
|
|
|
|
|
|
|
|||
|
|
|
|
|
|
EU 27 |
|
|
|
|
|
|
|
|
|
|
|
|
|
|
|
|
|
0.135 |
0.569 |
|
|
|
|
|
|
|
|
|
|
|
|
|
|
65 |
|
|
|
|
|
|
|
434 |
|
|
|
|
|
|
|
|
|||
|
|
|
|
|
|
|
|
|
|
|
|
|
|
|
|
|
|
|
|
|
|
|
|
|
|
|
|
|
|
|
|
|
|
|
|
|
|
|
|
|
|
|
|
|
|
|
|
|
|||||||||||
|
|
|
|
|
non-OECD w/o China |
|
|
|
|
|
|
|
|
|
|
|
|
|
|
|
|
|
|
|
|
|
|
|
|
|
|
|
|
|
|
|
|
|
|
|
|
|
|
|
|
|
|
|
|
|
|
|
|
||||||
|
|
|
|
|
|
|
|
|
|
|
|
|
|
|
|
|
|
|
|
|
|
|
|
|
|
|
|
|
|
|
|
|
|
|
|
|
|
|
|
|
|
|
|
|
|
|
|
|
|
||||||||||
1 |
|
|
|
|
China 1994-1999 |
|
|
|
|
|
|
|
|
|
|
|
|
|
|
|
|
|
|
|
|
|
5.92 |
|
|
|
|
|
|
|
|
|
|
|
|
|
|
|
|
|
|
284 |
|
|
|
|
|
|
|
|
|||||
|
|
|
|
|
|
|
|
|
|
|
|
|
|
|
|
|
|
|
|
|
|
|
|
|
|
|
|
|
|
|
|
|
|
|
|
|
|
|
|
|
|
|
|
|
|
||||||||||||||
|
|
|
|
|
|
OECD |
|
|
|
|
|
|
|
|
|
|
|
|
|
|
|
|
0.0932 |
|
|
|
|
|
|
|
|
|
|
|
|
|
|
|
|
|
|
|
|
|
|
|
|
252 |
|
|
|
|
|
|
|
|
|
||
|
|
|
|
|
|
|
|
|
|
|
|
|
|
|
|
|
|
|
|
|
|
|
|
|
|
|
|
|
|
|
|
|
|
|
|
|
|
|
|
|
|
|
|
|
|
||||||||||||||
|
|
|
|
|
|
EU 27 |
|
|
|
|
|
|
|
|
|
|
|
|
|
|
|
|
0.099 |
|
|
0.93 |
|
|
|
|
|
|
|
|
|
|
|
|
|
|
|
|
|
|
|
167 |
|
|
|
4, 386 |
|
|
|
|
|||||
|
|
|
|
|
|
|
|
|
|
|
|
|
|
|
|
|
|
|
|
|
|
|
|
|
|
|
|
|
|
|
|
|
|
|
|
|
|
|
|
|
|
|
|||||||||||||||||
|
|
|
|
|
|
non-OECD |
|
|
|
|
|
|
|
|
|
|
|
|
|
|
|
|
|
|
|
|
|
|
|
|
|
|
|
|
|
|
|
|
|
|
|
|
|
|
|
|
|
|
|
|
|
|
|
|
|
|
|||
|
|
|
|
|
|
|
|
|
|
|
|
|
|
|
|
|
|
|
|
|
|
|
|
|
|
|
|
|
|
|
|
|
|
|
|
|
|
|
|
|
|
|
|
|
|
|
|
|
|
|
|||||||||
|
|
|
|
|
|
OECD |
|
|
|
|
|
|
|
|
|
|
|
|
|
|
|
|
0.0721 |
|
|
|
|
|
|
|
|
|
|
|
|
|
|
|
|
|
|
|
|
109 |
|
|
|
|
|
|
|
|
|
|
|
|
|||
|
|
|
|
|
|
|
|
|
|
|
|
|
|
|
|
|
|
|
|
|
|
|
|
|
|
|
|
|
|
|
|
|
|
|
|
|
|
|
|
||||||||||||||||||||
|
|
|
|
|
|
EU 27 |
|
|
|
|
|
|
|
|
|
|
|
|
|
|
|
|
0.0679 |
|
|
|
|
|
|
|
|
|
|
|
|
|
|
|
27 |
|
|
|
|
|
|
|
|
|
|
|
|
|
|
EF: 502; |
|
|
|
||
|
|
|
|
|
|
|
|
|
|
|
|
|
|
|
|
|
|
|
|
|
|
|
|
|
|
|
|
|
|
|
|
|
|
|
|
|
|
|
|
|
|
|
|
|
|
|
|
|
|||||||||||
|
|
|
|
|
|
non-OECD |
|
|
|
|
|
|
|
|
|
|
|
|
|
|
|
|
0.115 |
|
|
|
|
|
|
|
|
|
|
|
|
|
|
|
|
|
|
|
|
|
|
243 |
|
|
|
|
LF: 9,738; |
|
|
|
|||||
|
|
|
|
Generation II (PWR; CH) |
|
|
|
|
|
|
|
|
|
|
|
EF: |
0.000414; LF: 0.00685; TF: 0.00726 |
|
|
|
|
|
|
|
|
|
|
|
|
|
|
|
|
|
|
|
|
|
|
|
|
|
|
||||||||||||||||
2 |
|
|
|
|
|
|
|
|
|
|
|
|
|
|
|
|
|
|
|
|
|
|
|
|
|
|
|
|
|
|
|
|
|
|
|
|
|
TF: 10,240 |
|
|
|
||||||||||||||||||
|
|
|
|
|
Chernobyl (RBMK) |
|
|
|
|
|
|
|
|
|
|
|
|
|
|
|
|
|
|
|
|
|
|
|
|
|
|
|
|
|
|
|
|
|
|
|
|
|
|
|
|
|
|
|
|
|
|
|
|
|
|
|
|
|
|
|
|
|
|
|
|
|
|
|
|
|
|
EF: 0.0302; LF (LL): 8.76; LF(UL): 32.1 (not shown) |
|
|
|
|
|
|
|
|
|
EF: 31 |
|
|
|
|
|
|
|
|
|
|
|
LF (LL) 9,000; LF (UL) 33,000 |
|
|
|
||||||||||||||||||||||
|
|
|
|
|
|
OECD |
|
|
|
|
|
|
0.0027 |
|
|
|
|
|
0.0853 |
|
|
|
|
|
|
|
|
|
|
|
|
|
14 |
|
|
|
|
|
|
116 |
|
|
|
|
|
|
|
|
|
|
|
|
|||||||
3 |
|
|
|
|
|
EU 27 |
|
|
|
|
|
|
|
|
|
|
|
|
|
|
|
|
|
|
7.01 |
|
|
|
|
|
|
|
|
|
|
|
|
|
|
|
|
|
|
|
|
|
|
26,000 |
|
|
|||||||||
|
|
|
|
|
|
|
|
|
|
|
|
|
|
|
|
|
|
|
|
|
|
|
|
|
|
|
|
|
|
|
|
|
|
|
|
||||||||||||||||||||||||
|
|
|
|
|
non-OECD |
|
|
|
|
|
|
|
|
|
|
|
|
|
|
|
|
|
|
|
|
|
|
|
|
|
|
|
|
|
|
|
|
|
|
|
|
|
|
|
|
|
|
|
|
|
|
|
|
||||||
|
|
|
|
|
|
|
|
|
|
|
|
|
|
|
|
|
|
|
|
|
|
|
|
|
|
|
|
|
|
|
|
|
|
|
|
|
|
|
|
|
|
|
|
|
|
|
|
||||||||||||
|
|
|
|
|
|
|
|
|
|
|
|
|
|
|
|
|
|
|
|
|
|
|
|
|
|
|
|
|
|
|
|
|
|
|
|
|
|
|
|
|
|
|
|
|
|
|
|
|
|
|
|
||||||||
non-OECD w/o Banqiao/Shimantan |
|
|
|
|
|
|
|
|
|
|
|
|
|
|
|
|
|
|
|
|
0.936 |
|
|
|
|
|
|
|
|
|
|
|
|
|
|
|
|
|
|
|
|
|
|
|
|
|
2,500 |
|
|
|
|
|
|||||||
|
|
|
|
PV (crystalline Silicon) |
|
0.000245 |
|
|
|
|
|
|
|
|
|
|
|
|
|
Nuclear: |
|
|
|
|
|
|
5 |
|
|
|
|
|
1 Details for coal China see Annex II |
|
|
|
|||||||||||||||||||||||
|
|
|
|
|
Wind Onshore (DE) |
|
|
|
|
|
|
0.00189 |
|
|
|
|
|
|
|
|
|
|
|
|
|
|
5 |
|
|
|
|
|
|
|
|
||||||||||||||||||||||||
|
|
|
|
|
|
|
|
|
|
|
|
|
|
|
|
|
|
|
EF = early fatalities |
|
|
|
|
|
|
|
|
|
|
2 |
Nuclear values also include latent fatalities (see Annex II) |
|
|
||||||||||||||||||||||||||
|
|
|
|
|
Wind Offshore (UK) |
|
|
|
|
|
|
|
|
0.00641 |
|
|
|
|
|
|
LF = latent fatalities |
|
|
|
|
|
|
|
|
10 |
|
|
3 Hydro non-OECD: Banqiao/Shimantan dam failures |
|
|
|
|||||||||||||||||||||||
4 |
|
|
|
|
Biomass: CHP Biogas |
|
|
|
|
|
|
|
|
|
|
0.0149 |
|
|
|
|
|
TF = total fatalities |
|
|
|
|
|
|
|
|
10 |
|
|
|
(China, 1975) together caused 26’000 fatalities |
|
|
|
|||||||||||||||||||||
|
|
|
|
|
|
|
|
|
|
|
|
|
|
|
|
|
|
|
LL / UL = lower /upper limit |
|
|
|
|
|
|
|
|
|
4 |
CHP biogas estimates include local distribution stage |
|
|
|
||||||||||||||||||||||||||
|
|
|
|
|
Geothermal: EGS |
|
|
|
|
|
0.00174 |
|
|
|
|
|
|
|
|
|
|
|
|
|
|
|
|
|
|
|
|
7 |
|
|
|
|
|
|
|
|
|
|
|
|
|
|
|
|
|
|
|
|
|
|
|
|
|||
|
|
|
|
|
|
|
|
|
|
|
|
|
|
|
|
|
|
|
|
|
|
|
|
|
|
|
|
|
|
|
|
|
|
|
|
||||||||||||||||||||||||
|
|
|
0.0001 |
0.001 |
0.01 |
|
|
|
0.1 |
1 |
10 |
|
1 |
10 |
|
|
|
|
100 |
1,000 |
10,000 |
|
100,000 |
||||||||||||||||||||||||||||||||||||
|
|
|
|
|
|
|
|
|
|
|
|
|
|
|
|
|
|
|
|
|
|
|
|
[Fatalities / GWeyr] |
|
|
|
|
|
|
|
|
|
|
|
|
|
|
|
|
|
|
|
|
|
|
|
Fatalities |
|||||||||||
|
|
|
|
|
|
|
|
|
|
|
|
|
|
|
|
|
|
|
|
|
|
|
|
|
|
|
|
|
|
|
|
|
|
|
|
|
|
|
|
|
|
|
|
|
|
|
|
|
|
|
|
||||||||
Figure 9.15 | Comparison of fatality rates and maximum consequences of currently operating large centralized and decentralized energy technologies. Fossil and hydropower is based on the ENSAD database (period 1970 to 2008); for nuclear PSA is applied; and for other renewable sources a combination of available data, literature survey and expert judgment is used. See Annex II for methodological details. Note: RBMK = reaktor bolshoy moshchnosty kanalny,a boiling water-cooled graphite moderated pressure tube type reactor; PWR = pressurized-water reactor; CHP = combined heat and power; EGS = Enhanced Geothermal Systems.
12 A third core-melt event that occurred in Fukushima, Japan, in March 2011 is not included in the current analysis.
746