

VanTonderJT
.pdf32
Chapter 4
Irrigated wheat growth and yield response to potassium humate under glasshouse conditions
4.1 Introduction
In South Africa irrigated wheat contributes about 17% to the total wheat production (United States Department of Agriculture – USDA, 20 06). The total wheat production of the country averaged 1.95 million ton annually since 2002. During the same period total wheat consumption was estimated at 2.63 million ton per annum (National Department of Agriculture – NDA, 2007). Hence since 2002 between 0.83 and 1.35 million ton of wheat was imported annually from Argentina, United States, Australia, Canada and some European countries (USDA, 2006). This is one of the reasons why wheat production has to be enhanced, especially under irrigation for its stabilizing effect.
Research showed that the application of commercial products like humates to soil could be useful in enhancing the growth and yield of crops like wheat (Majathoud, 2004). Considering the benefits attributed to the usages of humates they may also be of great value in South Africa since cropping has lead to a decrease of organic matter in soils (Almendros et al., 2005). In many instances the decline of organic matter is 50% or more. This is alarming since organic matter is one of the most important contributers to maintain soils in good quality. Soils of good quality are essential for sustained cropping (Percival et al., 2000).
It is especially the humus fraction of organic matter that has beneficial influences on soils and plants (Hopkins & Stark, 2003). This fraction comprise of a heterogeneous mixture of humic substances that arise from the decay of animal and plant residues. These humic substances can benefit plants directly or indirectly by influencing the soil. Benefits ascribed to them are increased water and nutrient holding capacity, increased reserves of slow releasing nutrients, enhanced solubility of phosphorus, zinc, iron, manganese and copper (Vaughan & Linehan, 1976; Mylonas & McCants, 1980; Majathoud, 2004). They are also able to buffer pH changes, improve aggregation, decrease erosion, enlarge the root
33
systems, and increase growth of plants as a result of inert hormones (Hopkins & Stark, 2003; Jones et al., 2007).
Taking all the benefits addressed to humic substances of organic matter into consideration an investigation on commercial humates is justified. The objective with this glasshouse research was to establish whether application of a commercially available K-humate to soils enhanced the growth and yield of irrigated wheat.
4.2 Materials and methods
4.2.1 Pot experiment
A pot experiment was conducted during the 2006 growing season in a glasshouse at the University of the Free State, Bloemfontein.
Baviaans, a spring type wheat with a high yielding ability and well adapted to the summer rainfall irrigation areas of South Africa, was selected. This cultivar also exhibits a good hectoliter mass, tillering ability, sprouting resistance and straw strength. The latter is of great importance to counteract lodging during the grain filling and mature growth stages. Regarding diseases, it is susceptible to stem rust, moderately susceptible to leaf rust and scab but resistant against stripe rust (ARC-Small Grain Institute, 2007). The recommended planting date for Baviaans is 1 to 30 June. Hence this experiment was planted on the 12th of June at the recommended seeding rate of 100 kg ha-1 (0.68 g pot-1) with a 0.2 m row spacing.
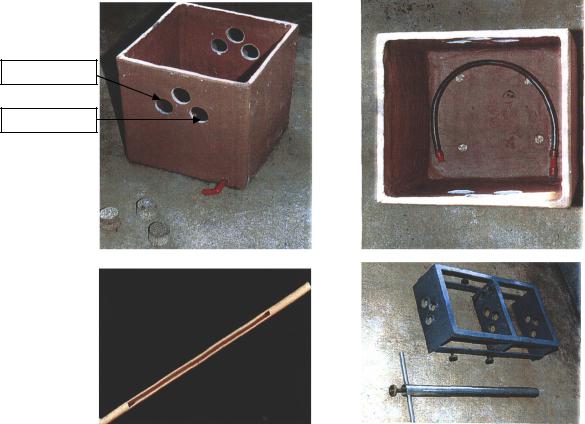
Topsoils of three textural classes (Table 4.1) were selected for this experiment viz. a loamy sand (Soil 1), sandy clay loam (Soil 2) and clay loam (Soil 3). Asbestos pots (0.34 x 0.34 x 0.35 m) with a volume of 40.5 L were used (Figure 4.1 – a). A gravel layer approximately 30 mm thick (5 kg) was placed at the bottom of each pot to facilitate drainage. A cloth was placed on the gravel layer separating the soil and the gravel to prevent the soil from penetrating the gravel. Each pot was filled with approximately 55 kg of soil after the soil was air-dried, sieved through a 2 mm screen and thoroughly mixed.
34
Unfertilised zone
Fertilised zone
a) |
|
b) |
c) |
Figure 4.1 Example of experimental pots (a – side a nd top view, b – tube to apply fertiliser in the band, and c – stainless steel tube and frame for root extraction from the fertilised zone and unfertilised zones).
Table 4.1 Physical properties of the topsoils used in this experiment
|
|
Soil |
|
|
|
|
|
Property |
Loamy sand (S1) |
Sandy clay loam (S2) |
Clay loam (S3) |
|
|
|
|
Bulk density (kg m-3) |
1.47 |
1.53 |
1.45 |
Particle size distribution (%) |
|
|
|
Sand |
86 |
67 |
44 |
Silt |
6 |
11 |
19 |
Clay |
8 |
22 |
37 |
|
|
|
|
Fertilisation was based on a yield potential of 8 t ha-1 and the fertility status as reported by Omnia NutriologyTM of the three soils (Table 4.2). Their fertility status was generally good
35
except for P in soil 3. Hence to reduce the complexity of the experiment it was decided to follow a collective fetiliser approach for the soils. Therefore, a total of 180 kg N ha-1, 30 kg P ha-1 and 20 kg K ha-1 were applied to soils 1, 2 and 3. The P deficiency of soil 3 was corrected by applying an additional 20 kg P ha-1. The time, source, rate and method of fertiliser application is summarised in Table 4.3.
The K-humate treatments were applied to the soils as coatings on the granular fertiliser either as a single application (100% at planting) or as a split application (50% banded at planting and 50% topdressed at tillering). The granular fertiliser at planting was applied with a tube (Figure 4.1 – b) exactly in the middle of the fertilised zone as in Figure 4.1 – a and the roots were extracted from the fertilised and unfertilised zones by means of a 50 mm stainless steel tube (Figure 4.1 – c).
The experiment was laid out as a complete randomised block design with a factorial combination consisting of two main factors, viz. three textural classes (8, 22 and 37% clay) and four K-humate applications (0 L ha-1 control, 3 L ha-1 single application and 3 and 6 L ha-1 split application). Effects of the treatment combinations were evaluated at three growth stages (tillering = G5; stem elongation = G10 and maturity = G25). Every treatment combination was replicated thrice for each growth stage, therefore, 108 pots were used.
The soils were maintained at field capacity by weighing the pots on a weekly basis. Distilled water was used to eliminate further addition of nutrients. Care was also exercised not to water soils above field capacity to avoid leaching of nutrients. The glasshouse temperatures were maintained at 18 ± 5 0C during the day and at 10 ± 5 0C during the night with a natural light regime. Throughout the duration of the experiment the plants were free of diseases and/or pests, hence no control measures were necessary.
36
Table 4.2 Chemical properties of the topsoils used in this experiment
|
|
|
Soil |
|
|
|
|
|
|
Property |
|
Loamy sand (S1) |
Sandy clay loam (S2) |
Clay loam (S3) |
|
|
|
|
|
Nutrients |
(mg kg-1) |
|
|
|
P |
(Bray 1) |
17 |
17 |
6 |
K |
(NH4OAC) |
198 |
143 |
153 |
Ca |
(NH4OAC) |
582 |
257 |
441 |
Mg |
(NH4OAC) |
181 |
68 |
131 |
Na |
(NH4OAC) |
36 |
6 |
6 |
Zn |
(Melich 3) |
0.3 |
0.8 |
0.4 |
Fe |
(Melich 3) |
49 |
64 |
134 |
Mn |
(Melich 3) |
45 |
18 |
49 |
Cu |
(Melich 3) |
0.2 |
1.9 |
1.5 |
B |
(Warm water) |
0.12 |
0.13 |
0.19 |
S |
(Ca(H2PO4)2) |
56 |
56 |
100 |
Ratios |
|
|
|
|
(Ca/Mg) |
|
1.96 |
2.27 |
2.05 |
(Ca+Mg)/K |
|
8.68 |
5.06 |
8.38 |
pH |
(KCl) |
6.4 |
4.6 |
4.8 |
Org C |
(m/m) |
0.19 |
0.11 |
0.35 |
CEC |
(%) |
5.06 |
2.24 |
3.7 |
|
|
|
|
|
37
Table 4.3 Time, source, method and rate of fertiliser application
Time of |
Source |
Method of |
|
Rate |
|
Contribution for |
each |
|||
application |
|
application |
|
|
|
|
element |
|
|
|
|
|
|
|
(kg ha-1) |
|
(g pot-1) |
N |
P |
|
K |
Pre-plant |
Superphosphate |
Broadcast, |
incur- |
190 |
|
2.196 |
|
19.95 |
|
|
|
(10.5) only to |
porated to 100 mm |
|
|
|
|
|
|
|
|
|
clay loam soil |
|
|
|
|
|
|
|
|
|
|
Greensulph (27) |
Broadcast, |
incur- |
370 |
|
4.277 |
99.9 |
|
|
|
|
|
porated to 100 mm |
|
|
|
|
|
|
|
|
At planting |
2:3:2 (22) |
Banded |
|
320 |
|
2.176 |
20.16 |
30.08 |
|
20.16 |
Tillering |
Greensulph (27) |
Topdressed |
|
111 |
|
1.283 |
29.97 |
|
|
|
Flag leaf |
Grensulph (27) |
Topdressed |
|
111 |
|
1.283 |
29.97 |
|
|
|
Total |
|
|
|
|
|
|
180 |
50 |
|
20 |
4.2.2 Observations
All the aboveand below-ground plant parameters listed were measured at the three
growth stages, except leaf area.
4.2.2.1 Above-ground plant parameters
1.Leaf area (cm2 m-2) – a LICOR 3000 leaf area meter was used to determ ine the leaf area of each plant after it was cut just above the soil surface. The total leaf area of all plants per pot was measured by using only the leaf blades.
2.Total biomass (g m-2) – after the leaf area was measured the plant mate rial was dried at 60oC until a constant water content to determine the dry mass.
3.Number of ears (m-2) – the number of ears of all plants per pot was co unted.
4.Numbers of spikelets (spikelets ear-1) – the number of spikelets per ear of all plants per pot was counted.
5.Numbers of kernels (kernels ear-1) – the number of kernels per ear of all plants per pot was counted.
6.Grain yield (g m-2) – the total grain yield per pot was weighed after the seed was dried to a constant moisture content.
38
4.2.2.2 Below-ground plant parameters
1.Root length (mm) – the roots were separated from th e soil by washing it over a 2 mm screen with water at low pressure. A modified infrared root line intersection counter was used to measure the root lengths (Rowse & Phillips, 1974). Roots in the fertilised zone, unfertilised zone and remaining soil of a pot were measured separately.
2.Root mass (g) – after the root length was measured, roots were dried at 60oC to a constant moisture content and weighed.
4.2.3Statistical analyses
As described in section 4.2.1 a complete radomised block design with a factorial combination consisting of two main factors, viz. three soils and four K-humate applications replicated thrice for each of the three growth stages was used. The experimental data was analysed with the NCSS (Number Cruncher Statistical System) statistical package (Hintze, 1998). The least significant difference (LSD) was calculated at P ≤ 0.05. This was done to compare the treatment means using the Tukey-Kramer multiple comparison test (Gomez & Gomez, 1984).
4.3 Results and discussion
A summary on the analyses of variance evaluating the effect of treatment factors, viz. K- humate and soil type at three growth stages on selected plant parameters is given in Table 4.4. Inspection of the results showed that with the exception of tiller number at stem elongation, the application of K-humate as a main factor had no significant effect on any of the measured plant parameters. Soil type as a main factor showed that there was a significant difference at the three growth stages, especially at maturity for the majority of parameters. A significant interaction between K-humate and soil type was also observed for leaf area at tillering.
Both growth and yield component parameters were used to evaluate the effect of K- humate application rates with the three textural soils on wheat production. The growth and production were evaluated at different growth stages and are presented in Tables 4.4 - 4.20. For all parameters the growth stages were grouped where applicable and the different
39
soil textures were annotated as: 8% clay - S1; 22% clay - S2 and 37% clay - S3. Analysis of variance is presented in Appendix 4.1 – 4.35.
4.3.1 Above ground plant parameters
4.3.1.1 Total biomass
Total biomass production in above-ground vegetative parts of wheat were not significantly influenced by either K-humate application or soil used at any of the growth stages (Appendix 4.1 – 4.3). Though insignificant the 6 L K-humate ha-1 split application increased total biomass production slightly at tillering (9.2%) and maturity (2.9%) compared to the control (Table 4.5).
Total biomass production showed no significant differences as a result of the soils used. However the same trend was observed for the different growth stages regarding soil. The loamy sand soil (S1) and sandy clay loam soil (S2) yielded similarly but constantly higher dry matter yields than the clay loam soil (S3), viz. on average 15.3% at tillering, 13.0% at stem elongation and 10.6% at maturity.
The observed increase in dry matter production is in correspondence with findings of researchers using fulvic and humic acids that positively influenced shoot growth of various plants when applied as a foliar or in a nutrient solution (Chen et al., 2004). Aparicio et al. (2002) stated that increased grain yields were mainly due to increases in total dry matter with negligible increases in harvest index. Final yields often depended on the translocation of assimilates from leafs and stems to the grain meaning that the higher the total biomass at anthesis, the higher the yield.
40
Table 4.4 Summary on analyses of variance indicating the effect of treatment factors on the measured plant parameters
Factors |
|
|
|
Root |
Root mass |
Total |
Root |
Root |
Total |
|
Number |
Number |
|
Thousand |
|
|
|
|
|
mass in |
in |
length in |
length in |
|
of |
of |
|
|
|||
|
Dry |
Leaf |
Tiller |
fertilised |
unfertilised |
root |
fertilised |
unfertilised |
root |
Seed |
spikelets |
kernels |
Yield |
kernel |
Number |
|
matter |
area |
number |
zone |
zone |
mass |
zone |
zone |
length |
yield |
per ear |
per ear |
per ear |
mass |
of ears |
Tillering |
|
|
|
|
|
|
|
|
|
|
|
|
|
|
|
Application rate (R) |
ns |
ns |
ns |
ns |
ns |
ns |
ns |
ns |
ns |
|
|
|
|
|
|
Soil (S) |
ns |
* |
* |
ns |
ns |
ns |
ns |
ns |
ns |
|
|
|
|
|
|
R x S |
ns |
* |
ns |
ns |
ns |
ns |
ns |
ns |
ns |
|
|
|
|
|
|
Stem elongation |
|
|
|
|
|
|
|
|
|
|
|
|
|
|
|
Application rate (R) |
ns |
ns |
* |
ns |
ns |
ns |
ns |
ns |
ns |
|
|
|
|
|
|
Soil (S) |
ns |
ns |
* |
* |
* |
ns |
ns |
* |
ns |
|
|
|
|
|
|
R x S |
ns |
ns |
ns |
ns |
ns |
ns |
ns |
ns |
ns |
|
|
|
|
|
|
Maturity |
|
|
|
|
|
|
|
|
|
|
|
|
|
|
|
Application rate (R) |
ns |
|
ns |
ns |
ns |
ns |
ns |
ns |
ns |
ns |
ns |
ns |
ns |
ns |
ns |
Soil (S) |
ns |
|
ns |
* |
* |
* |
* |
* |
ns |
* |
* |
* |
* |
ns |
ns |
R x S |
ns |
|
ns |
ns |
ns |
ns |
ns |
ns |
ns |
ns |
ns |
ns |
ns |
ns |
ns |
* - P ≤ 0.05 |
|
|
|
|
|
|
|
|
|
|
|
|
|
|
|
ns - not significant |
|
|
|
|
|
|
|
|
|
|
|
|
|
|
|
41
Table 4.5 Total biomass production (g m-2) at three growth stages as affected by K- humate applications to three soils
Growth stage |
Soil |
|
K-humate application (L ha-1) |
|
|
|
|
|
0 - control |
3 - single |
3 - split |
6 - split |
|
|
S1 |
128.0 |
125.2 |
128.8 |
132.6 |
126.8 |
Tillering |
S2 |
126.6 |
113.2 |
118.0 |
139.1 |
124.2 |
|
S3 |
98.0 |
116.0 |
100.8 |
113.6 |
107.1 |
|
|
117.5 |
118.1 |
115.9 |
128.4 |
|
Stem |
S1 |
537.5 |
417.2 |
433.4 |
508.0 |
474.0 |
elongation |
S2 |
461.6 |
457.4 |
508.1 |
437.2 |
466.1 |
|
S3 |
431.4 |
419.0 |
401.5 |
383.1 |
408.8 |
|
|
476.8 |
431.2 |
447.7 |
442.8 |
|
|
S1 |
1244.9 |
1322.6 |
1288.7 |
1313.5 |
1292.4 |
Maturity |
S2 |
1327.7 |
1323.1 |
1173.6 |
1401.3 |
1306.4 |
|
S3 |
1180.3 |
1165.0 |
1183.4 |
1151.4 |
1170.0 |
|
|
1251.0 |
1270.3 |
1215.2 |
1288.7 |
|
S = Soil |
R = Application |
|
SxR = Soil x Application |
|
|
||
Tillering S = |
ns |
Stem elongation S |
= |
ns |
Maturity S |
= |
ns |
R = |
ns |
R = |
ns |
R = |
ns |
||
SxR = |
ns |
SxR |
= |
ns |
SxR |
= |
ns |
4.3.1.2 Leaf area
Appendix 4.4 clearly indicated a significant difference in leaf area as a result of the interaction between K-humate application and soil texture. At tillering the greatest leaf area was obtained with the 6 L K-humate ha-1 split application on the loamy sand soil (S1) (Table 4.6). This leaf area was significantly greater than that obtained with the 3 L K-humate ha-1 single application on the sandy clay loam soil (S2), and with the control and 6 L K-humate ha-1 split application on the clay loam soil (S3).
No significant difference in leaf area was observed at stem elongation for either of the main effects (Appendix 4.5). Leaf area on the clay loam soil (16324.2 cm2m-2) at tillering was 17.5% and 5.0% smaller than the leaf areas of the loamy sand soil and sandy clay loam soil, respectively. At stem elongation the leaf area of the clay loam soil was on average 9.5% smaller than that of the other two soils. This corresponds with the reported dry matter production (section 4.3.1) and verifies the reduction in dry matter as a result of a smaller leaf area.