

2812 |
CHAPTER 34. PROBLEM-SOLVING AND DIAGNOSTIC STRATEGIES |
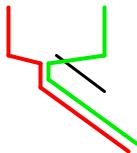
Note the careful use of the words “likely” and “probable” in the hypotheses. Hypotheses are uncertain by their very nature, and are never “proven” in any final sense. Even though our initial approach of sketching and comparing data pathways suggests a problem between the ISDN router and the DeviceNet network connecting the protective relays together, it is still possible for the problem to lie somewhere closer to the display station. If, for example, the display station relied on dedicated software “drivers” to properly poll and interpret data from the protective relay network that were not used to do the same for weather station data, the problem could actually lie within the display station! A corrupted relay driver would prevent that station from properly displaying protective relay data and yet permit the display of weather station data. In order for our data path tracing procedure to encompass this possibility, we would need to show the pathways splitting within the display station, so they would no longer be common to each other:
Relay |
|
|
Weather |
|
|
station |
|
driver |
|
|
|
|
|
driver |
|
software |
|
|
|
|
|
software |
|
|
|
|
|
|
|
|
|
|
|
|
|
|
|
|
|
|
|
|
|
Good
Bad
As always, the assumptions we embed into our hypotheses can skew their validity. If we assume completely overlapping data paths for protective relay and weather data within the display station, we would not recognize the possibility of a driver problem.
34.7Common diagnostic mistakes
Volumes could be written about poor diagnostic technique. The following mistakes are not intended to comprise a comprehensive list, but are merely warnings against errors that are all too common among students and within the profession.
34.7. COMMON DIAGNOSTIC MISTAKES |
2813 |
34.7.1Failing to gather data
Perhaps the most common mistake made by technicians attempting to diagnose a system problem is failing to gather data (i.e. taking measurements and performing simple system tests) during the troubleshooting process. Even a small amount of data gathered from a system may profoundly accelerate the process of diagnosis.
A colleague of mine has a very descriptive term for the poor habit of looking for faults before gathering data: Easter-Egging. The idea is that a technician goes about finding the problem in a system the same way they might go about searching for eggs hidden on Easter morning: randomly. With Easter egg hunting, the eggs could literally be hidden anywhere, and so there is no rational way to proceed on a search. In like manner, a technician who lacks information about the nature or source of a system problem is likely to hunt in random fashion for its source. Not only will this likely require significant time and e ort, but it may very well fail entirely.
A much more e cient way to proceed is to gather new data with each and every step in the troubleshooting process. By “gathering data,” I mean the following:
•Taking measurements with test equipment (multimeter, pressure gauges, etc.)
•Observing equipment indicator lights
•Stimulating the system and observing its response(s)
•Using your other senses (smell, hearing, touch) to gather clues
•Documenting new data in a notepad to help track and analyze the results of your measurements and tests
2814 |
CHAPTER 34. PROBLEM-SOLVING AND DIAGNOSTIC STRATEGIES |
34.7.2Failing to use relevant documentation
Diagrams are indispensable “maps” for solving problems in complex systems. A critical first step in diagnosing any system problem is to obtain correct diagrams of the system, so that you may see the pathways of power and signals in the system. Attempting to diagnose a system problem without consulting the relevant diagrams is like trying to find your way around a city without a map.
A corollary to the rule of obtaining relevant diagrams is to use them when reasoning through fault scenarios. All too often I see students locate the diagram for a system, glance at it, then set it aside and proceed to stumble through the rest of the diagnosis because they try to trace all the signal paths in the real world as they assess fault possibilities and devise tests. Diagrams are laid out in a clean and logical format for a reason: it is much easier to follow the flow of signals and power in a diagram than it is to follow the same flow through the convoluted paths of real-world wires and cables. If you reject the diagram in favor of tracing all pathways by looking at the real-world system, you are needlessly adding complexity to the problem: not only do you have to reason through the fault hypotheses and diagnostic tests, but you also must mentally “un-tangle” the signal paths as they are laid out in the real world (which can be a daunting task in itself!). Do all your diagnostic thinking while looking at the diagram, and refer to the real-life system only when the time comes to execute a diagnostic test. The result will be a much faster and less frustrating experience than if you try to trace everything in real life.
When diagnosing a problem in a system where one or more of the key components are unfamiliar to you, it is important to consult the relevant technical literature on those components. This is especially true if the component in question has been identified as suspect by your diagnostic test(s) and it is quite complex (e.g. loop controller, PLC, motor drive, data acquisition module, etc.). Just a few minutes’ worth of reading the manual may save you hours of fruitless diagnosis.
This point also underscores the necessity of technical reading as a skill to be practiced and honed at every opportunity. Being able to quickly locate pertinent information in a dense technical document is key to fast and e cient troubleshooting!
34.7. COMMON DIAGNOSTIC MISTAKES |
2815 |
34.7.3Fixating on the first hypothesis
When diagnosing a faulted system, an e cient strategy is to brainstorm multiple hypotheses accounting for the symptoms, then devise tests to support or discredit those hypotheses in the fewest steps.
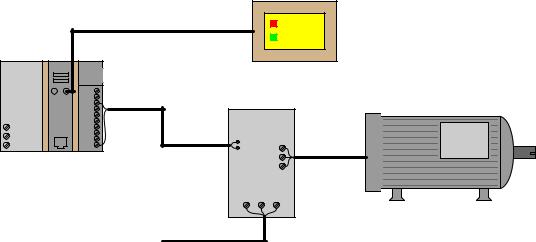
Let me illustrate by example. Suppose a pump motor is controlled by a PLC, the PLC sending a command signal to a variable-frequency motor drive (VFD) to command the motor to start and stop:
|
|
|
|
Touch-screen panel |
|
|
|
|
(HMI) |
|
|
|
data cable |
Pump start |
|
|
|
|
Pump stop |
Power |
Processor |
Output |
|
|
|
0 |
4 |
|
|
supply |
|
2 |
6 |
|
|
|
1 |
5 |
|
|
|
3 |
7 |
|
|
|
VDC |
control cable |
|
|
|
OUT1 |
|
|
|
|
OUT0 |
|
Motor |
|
|
OUT2 |
|
|
|
|
OUT3 |
|
VFD |
|
|
OUT4 |
|
|
L1 |
|
OUT5 |
|
|
L2/N |
|
OUT6 |
|
|
|
OUT7 |
|
|
|
|
|
|
|
|
Gnd |
|
COM |
|
power cable |
|
|
|
|
From
480 VAC  power cable
power source
If the motor refuses to start when the “Pump start” icon is pressed on the HMI screen, a competent troubleshooter will begin to mentally list a range of problems that could prevent the motor from starting:
•Motor faulted
•VFD lacking power
•VFD not configured properly to receive signal from PLC
•PLC output defective, not sending signal to VFD
•PLC program halted or faulty
•HMI not sending signal to PLC
•. . . etc.

2816 |
CHAPTER 34. PROBLEM-SOLVING AND DIAGNOSTIC STRATEGIES |
After brainstorming such a list, a competent troubleshooter will then devise a simple test to “divide the problem space in half.” One such test3 in this system would be to use a multimeter to measure the electrical signal from the PLC’s output card to the VFD input terminals. If a signal appears when the “Pump start” icon on the HMI is pressed, it means everything in the HMI and PLC is working as it should, and that the problem must lie with the VFD or beyond. If no signal appears, it means the problem lies with the VFD, HMI, or associated cabling. Again, the wise strategy is to brainstorm multiple hypotheses explain why the motor won’t start, then execute simple tests to eliminate most of those hypotheses so you may focus on those that are most likely.
By contrast, a novice might only think of one possibility – such as the VFD being improperly configured – and then immediately fixate on that hypothesis by inspecting the drive parameters looking for one that is improperly set. If the fault lies elsewhere, the novice could spend all day reviewing VFD parameters and never find the problem. Given the wide range of possible faults, fixating on any one fault from the start is very likely a waste of time. I have watched technicians and students alike waste hours of time trying to find a fault that was not where they were looking, simply because that was the first area they thought of to look toward. Only after squandering valuable time on one failed hypothesis will the novice then consider other possibilities and other tests.
3Other possible tests include inspecting the LED status light on that PLC output card channel (a light indicates the HMI and PLC program are working correctly, and that the problem could lie within the output card or beyond to the motor) or measuring voltage at the drive output (voltage there indicates the problem must lie with the motor or the cable to the motor rather than further back).