

54 |
7 Ultrasound Harmonic Imaging |
7.2Methods Used to Isolate the Second Harmonic Signal Component
The usual method used to isolate the second harmonic signal component is the harmonic band filtering technique. The intensity of the second harmonic echo is 10– 20 dB lower than that of the fundamental frequency. Hence one needs a low-noise, wide dynamic range receiver to receive and process the relatively weak signal [5].
An object within the ultrasonic field where the second harmonics is present will be interrogated by both the fundamental frequency and the harmonic frequency. Harmonics are generated as a result of propagation through tissue. This mechanism of second harmonics generation is different from that of harmonics due to the scattering from microbubble contrast agents, due to the expansion and contraction of the bubbles caused by the ultrasonic force. The detected signals or the returning echo will contain both the fundamental frequency component and the harmonic frequency component. After the reflection, the propagation of echoes at relatively low intensity will not generate additional harmonic components. A high-pass filter is used to remove the fundamental echo signal and only the tissue harmonic component is processed for image formation.
Ideally, there should not be overlapping between the fundamental and the harmonic bands. The transmitted pulse must be carefully shaped and controlled to prevent high-frequency components within the harmonic region. The presence of these high frequencies will give rise to echoes of the same frequency including clutter and noise. The fundamental and the harmonic bands can be separated by elongating the transmission pulse to form a narrow transmission bandwidth. This may degrade the axial resolution. However, the longer transmitted spatial pulse can be compensated to some extent by the increased detection frequency of the second harmonics.
7.3 Advantages of Harmonic Imaging
The unwanted effects of side lobes, grating lobes, and clutter are produced at the fundamental frequency. The echoes generated by the sources are also occurred at the fundamental frequency. They are suppressed in the harmonic image.
In harmonic imaging, reverberation artifacts are reduced. This is because the echoes from reflections in general do not generate harmonics due to their low amplitude. Multiple scattering and distortion at the fundamental frequency are suppressed in the harmonic image [6].
In harmonic imaging, there is reduction of acoustic noise. This enhances contrast resolution and border delineation. Hence the detection and characterization of lowcontrast solid lesions are improved. Also acoustic enhancement and shadowing are more easily demonstrated [7].
7.3 Advantages of Harmonic Imaging |
55 |
The source of harmonic production is due to the high acoustic pressure occurs near the main beam axis and within the focal zone. The width of the harmonic beam is effectively narrower than the main beam at the fundamental frequency. The narrowing of beam width improves lateral resolutions [6].
7.4 Disadvantages of Harmonic Imaging
Due to the fact that only a small fraction of the transmitted probe energy is converted into the second harmonics and thus available for echo generation, the signal-to-noise ratio is lower and consequently harmonic imaging is less sensitive than conventional B-mode echocardiography.
The signal-to-noise ratio can be improved by lowering the transmitted frequency and reducing the receiver bandwidth. Due to the higher attenuation rates for harmonics, the overall penetration in harmonic imaging is less than that for conventional B-mode echocardiography. The drawback is not that severe because harmonics travel only a portion of the total path length.
Axial resolution for all reflections and contrast resolution for targets with small axial dimensions are likely to be inferior in harmonic imaging.
Due to the lack of harmonics in the incident ultrasound wave, structures located near the transducer are depicted with poor contrast.
7.5 Experimental Techniques in Nonlinear Acoustics
The simplest experimental method is known in the generation of higher harmonics. This is using the terms I with frequency 0 and, IV with frequency ω0 of Eq. (7.19):
1 |
aL2 z sin(2 0τ) and |
|
1 |
a2H z sin(2 0τ) |
|
2 |
2 |
||||
|
|
||||
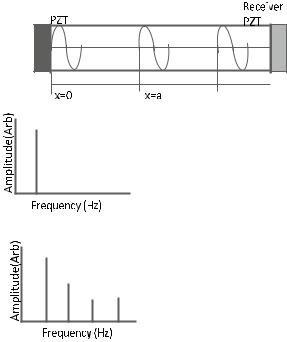
First the amplitudes of generated higher harmonics is investigated. A single frequency acoustic wave is introduced into an object by a piezoelectric transducer made of lead-zirconate titanate (PZT). As the sound wave is propagating in the nonlinear medium, it is distorted with the generation of nonlinear effect. The sound wave is then received by another PZT transducer and recorded on an oscilloscope where the frequency content can be presented. This accumulated effect is shown in Fig. 7.2a [4].
Here a pure sinusoidal wave is sent into materials with uniformly distributed nonlinearity at x = 0. Then the shape of the wave is investigated at discrete distances. The wave has become mildly distorted at distance xa . This distorted wave is the input from distance xa to xb. The wave has become more distorted at distance xb. After analysing the frequency contents of the these waves, it shows that the amplitude of
56
Fig. 7.2 Schematic wave propagating being distorted in a nonlinear medium.
b Frequency content of response from an undamaged material. c Frequency content of response from a damaged material. (After Haller [4])
7 Ultrasound Harmonic Imaging
(a) 
x=b
ω
(b) undamaged sample
ω
2ω
3ω 4ω
(c) damaged sample
the frequencies 2ω, 3ω, …, nω have decreased and this can be used as an indicator for nonlinearity and for damage detection. (Please refer to the difference between Fig. 7.2b and c). The nonlinearity factor can be calculated from this [8, 9].
7.6Application of Ultrasound Harmonic Imaging to Tissue Imaging
Tissue harmonic imaging was introduced in 1997 [10] during the studies of the harmonic frequencies from insolating microbubbles realized that human tissues could also produce diagnostically useful harmonic waves. When the acoustic pressure in a soft tissue is small, that is less than 0.5 MPa, the tissues behave in a linear fashion and sound wave containing new frequencies are not generated. Nonlinear propagation occurs when high pressure sound wave, that is higher than 0.5 MPa propagates through a compressible medium and the transmitted ultrasound wave induces less compression than rarefaction. The production of harmonic sound waves including those from the edges of the sound beam is proportional to the square of the fundamental intensity. This is highest at the beam centre where the beam intensity is greatest and at the focal zone, where the beam is narrowest. Weaker sound waves produce little or no harmonics. These waves are from the edges of the sound beam and
7.6 Application of Ultrasound Harmonic Imaging to Tissue Imaging |
57 |
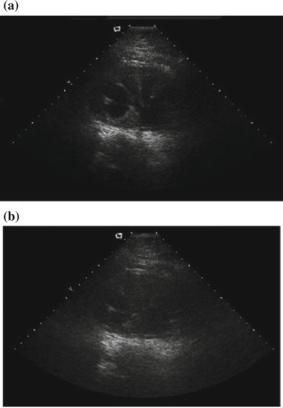
Fig. 7.3 Comparison of tissue harmonic imaging (THI) with fundamental imaging. Sonograms of the kidney obtained at 4 MHz: a harmonic and
b fundamental. (After Hedrick and Metzger [11])
scattered echoes, side lobes and grating lobes. Images produced with tissue harmonic imaging are superior to conventional gray-scale images of cysts and abnormality that contain fat, calcium or air. There are several clinical advantages. A comparison of tissue harmonic imaging with fundamental imaging is shown in Fig. 7.3 [11].
7.7Applications of Ultrasonic Harmonic Imaging to Nondestructive Testing
The experiment is performed using commercially available piezoceramic transducers (PZT) glued with epoxy. One PZT transducer acts as an actuator to generate the sound wave in the specimen and the other PZT transducer acts as a receiver of the sound wave. For the higher harmonics experiment, a single sinusoidal sound wave is sent to the specimen by the signal generator through one PZT transducer. The signal is distorted by the cracks and other defects on its way to the other PZT transducer acting