

Ace_The_Case_2nd_Ed
.pdfTable 10: Pakistani production and consumption of copper semis, 1997-2002 (tonnes)
|
1997 |
1998 |
1999 |
2000 |
2001 |
2002e |
|
|
Total |
|
|
|
|
Production |
16,000 |
11,445 |
10,225 |
14,025 |
14,025 |
14,025 |
Consumption |
17,564 |
12,545 |
11,126 |
14,897 |
15,843 |
15,105 |
Net imports |
1,564 |
1,100 |
901 |
872 |
1,818 |
1,080 |
|
|
Wirerod |
|
|
|
|
Production |
16,000 |
11,445 |
10,225 |
14,025 |
14,025 |
14,025 |
Imports |
507 |
210 |
42 |
79 |
1,460 |
600 |
Exports |
0 |
0 |
0 |
0 |
0 |
0 |
Consumption |
16,507 |
11,655 |
10,267 |
14,104 |
15,485 |
14,625 |
|
|
Net imports of other semis |
|
|
|
|
Cu sheet & strip |
45 |
34 |
29 |
32 |
18 |
30 |
Alloy sheet & strip |
144 |
113 |
268 |
216 |
82 |
100 |
Cu tube |
373 |
426 |
379 |
366 |
177 |
200 |
Alloy tube |
495 |
318 |
183 |
178 |
81 |
150 |
Table 11: Saudi Arabian production and consumption of copper semis, 1997-2002 (tonnes)
|
1997 |
1998 |
1999 |
2000 |
2001 |
2002e |
|
|
Total |
|
|
|
|
Production |
153,900 |
179,600 |
164,300 |
179,000 |
172,000 |
167,500 |
Consumption |
200,200 |
222,488 |
198,507 |
235,258 |
225,300 |
220,800 |
Net imports |
46,300 |
42,888 |
34,207 |
56,258 |
53,300 |
53,300 |
|
|
Wirerod |
|
|
|
|
Production |
153,900 |
179,600 |
164,300 |
179,000 |
172,000 |
167,500 |
Imports |
1,000 |
1,085 |
1,239 |
1,704 |
2,000 |
2,000 |
Exports |
300 |
3,919 |
1,372 |
445 |
300 |
300 |
Consumption |
154,600 |
176,766 |
164,167 |
180,259 |
173,700 |
169,200 |
|
|
Net imports of other semis |
|
|
|
|
Cu sheet & strip |
39,000 |
38,406 |
28,903 |
48,438 |
45,000 |
45,000 |
Alloy sheet & strip |
1,000 |
1,042 |
806 |
1,152 |
1,000 |
1,000 |
Cu tube |
4,000 |
3,872 |
3,378 |
3,554 |
4,000 |
4,000 |
Alloy tube |
1,600 |
2,402 |
1,252 |
1,855 |
1,600 |
1,600 |
www.AceTheCase.com |
- 111 - |
Copyright 2007 |

Table 12: Turkish production and consumption of copper semis,
1997-2002 (tonnes)
|
1997 |
1998 |
1999 |
2000 |
2001 |
2002e |
|
|
|
Total |
|
|
|
Production |
209,650 |
233,650 |
234,650 |
276,650 |
255,720 |
295,650 |
Consumption |
198,250 |
223,712 |
226,532 |
269,494 |
240,697 |
281,950 |
Net imports |
-11,400 |
-9,938 |
-8,118 |
-7,156 |
-15,023 |
-13,700 |
|
|
|
Wirerod |
|
|
|
Production |
175,000 |
199,000 |
200,000 |
242,000 |
221,000 |
261,000 |
Imports |
15,000 |
15,856 |
9,999 |
10,260 |
9,943 |
10,000 |
Exports |
34,000 |
34,023 |
25,624 |
24,554 |
28,565 |
27,000 |
Consumption |
156,000 |
180,833 |
184,376 |
227,706 |
202,378 |
244,000 |
|
|
Copper Sheet, Strip and Plate |
|
|
|
|
Production |
20,000 |
20,000 |
20,000 |
20,000 |
20,000 |
20,000 |
Imports |
1,700 |
1,721 |
1,966 |
2,816 |
3,162 |
3,000 |
Exports |
100 |
100 |
293 |
884 |
1,509 |
1,800 |
Consumption |
21,600 |
21,621 |
21,673 |
21,932 |
21,653 |
21,200 |
|
|
Copper Water and ACR Tube |
|
|
|
|
Production |
10,000 |
10,000 |
10,000 |
10,000 |
10,000 |
10,000 |
Imports |
4,000 |
4,427 |
4,337 |
5,109 |
3,724 |
4,500 |
Exports |
200 |
259 |
149 |
374 |
535 |
600 |
Consumption |
13,800 |
14,168 |
14,188 |
14,735 |
13,189 |
13,900 |
|
|
Copper Alloy Strip |
|
|
|
|
Production |
3,000 |
3,000 |
3,000 |
3,000 |
3,000 |
3,000 |
Imports |
2,000 |
2,230 |
1,544 |
1,252 |
1,560 |
1,500 |
Exports |
300 |
282 |
367 |
1,444 |
2,872 |
3,500 |
Consumption |
4,700 |
4,948 |
4,177 |
2,808 |
1,688 |
1,000 |
|
|
Copper Alloy Tube |
|
|
|
|
Production |
1,650 |
1,650 |
1,650 |
1,650 |
1,720 |
1,650 |
Imports |
600 |
608 |
540 |
777 |
257 |
400 |
Exports |
100 |
116 |
71 |
113 |
188 |
200 |
Consumption |
2,150 |
2,142 |
2,119 |
2,314 |
1,789 |
1,850 |
www.AceTheCase.com |
- 112 - |
Copyright 2007 |

Table 13: South East Asian production and consumption of
copper semis, 1997-2002 (tonnes)
|
1997 |
1998 |
1999 |
2000 |
2001 |
2002e |
|
|
|
Total |
|
|
|
Production |
532,200 |
375,000 |
436,719 |
471,813 |
498,683 |
555,968 |
Consumption |
604,097 |
440,781 |
533,732 |
560,447 |
619,253 |
707,066 |
Net imports |
71,897 |
65,781 |
97,013 |
88,634 |
120,570 |
151,098 |
|
|
|
Wirerod |
|
|
|
Production |
445,200 |
304,000 |
346,650 |
365,000 |
386,100 |
439,300 |
Imports |
10,088 |
13,119 |
23,589 |
31,722 |
27,984 |
49,065 |
Exports |
356 |
9,315 |
9,415 |
5,079 |
6,952 |
7,000 |
Consumption |
454,932 |
307,804 |
360,824 |
391,643 |
407,132 |
481,365 |
|
|
Copper Sheet, Strip and Plate |
|
|
|
|
Production |
15,000 |
10,000 |
20,000 |
16,000 |
17,000 |
18,500 |
Imports |
15,023 |
30,865 |
28,140 |
34,030 |
65,559 |
52,252 |
Exports |
199 |
1,208 |
2,557 |
2,726 |
2,583 |
2,500 |
Consumption |
29,824 |
39,657 |
45,583 |
47,304 |
79,976 |
68,252 |
|
|
Copper Water and ACR Tube |
|
|
|
|
Production |
59,000 |
50,000 |
59,069 |
69,613 |
74,383 |
76,668 |
Imports |
21,096 |
17,633 |
19,002 |
22,487 |
21,617 |
27,332 |
Exports |
15,626 |
22,430 |
25,071 |
37,100 |
37,000 |
41,000 |
Consumption |
64,470 |
45,203 |
53,000 |
55,000 |
59,000 |
63,000 |
|
|
Copper Alloy Strip |
|
|
|
|
Production |
8,000 |
8,000 |
6,000 |
6,200 |
6,200 |
6,500 |
Imports |
30,369 |
29,848 |
45,300 |
48,094 |
51,538 |
71,850 |
Exports |
346 |
607 |
1,438 |
4,091 |
1,064 |
1,900 |
Consumption |
38,023 |
37,241 |
49,862 |
50,203 |
56,674 |
76,450 |
|
|
Copper Alloy Tube |
|
|
|
|
Production |
5,000 |
3,000 |
5,000 |
15,000 |
15,000 |
15,000 |
Imports |
13,097 |
10,088 |
23,599 |
10,350 |
11,065 |
11,000 |
Exports |
1,249 |
2,212 |
4,136 |
9,053 |
9,594 |
8,000 |
Consumption |
16,848 |
10,876 |
24,463 |
16,297 |
16,471 |
18,000 |
www.AceTheCase.com |
- 113 - |
Copyright 2007 |

Table 14: Gulf States production and consumption of
copper semis, 1997-2002 (tonnes)
|
1997 |
1998 |
1999 |
2000 |
2001 |
2002e |
|
|
Total |
|
|
|
|
Production |
28,000 |
31,990 |
37,810 |
40,000 |
40,000 |
41,000 |
Consumption |
54,000 |
63,290 |
72,410 |
81,000 |
96,200 |
96,300 |
Net imports |
26,000 |
31,300 |
34,600 |
41,000 |
56,200 |
55,300 |
|
|
Wirerod |
|
|
|
|
Production |
28,000 |
31,990 |
37,810 |
40,000 |
40,000 |
41,000 |
Imports |
20,000 |
21,600 |
25,300 |
29,300 |
36,400 |
39,000 |
Exports |
0 |
0 |
0 |
0 |
0 |
0 |
Consumption |
48,000 |
53,590 |
63,110 |
69,300 |
76,400 |
80,000 |
|
Net imports of other semis |
|
|
|
||
Cu sheet & strip |
1,000 |
1,500 |
2,000 |
3,300 |
4,000 |
4,500 |
Alloy sheet & strip |
900 |
900 |
1,100 |
700 |
1,300 |
1,300 |
Cu tube |
2,400 |
3,200 |
3,200 |
4,700 |
5,800 |
6,500 |
Alloy tube |
1,700 |
4,100 |
3,000 |
3,000 |
8,700 |
4,000 |
www.AceTheCase.com |
- 114 - |
Copyright 2007 |

Table 15: Iranian production and consumption of copper
semis, 1997-2002 (tonnes)
|
1997 |
1998 |
1999 |
2000 |
2001 |
2002e |
|
|
|
Total |
|
|
|
Production |
83,457 |
69,446 |
97,399 |
97,221 |
94,693 |
98,988 |
Consumption |
81,215 |
67,145 |
90,864 |
91,586 |
98,098 |
102,892 |
Net imports |
-2,242 |
-2,301 |
-6,535 |
-5,635 |
3,405 |
3,904 |
|
|
Wirerod |
|
|
|
|
Production |
76,100 |
61,000 |
82,000 |
82,800 |
85,800 |
85,800 |
Imports |
8 |
8 |
1 |
394 |
945 |
806 |
Exports |
400 |
439 |
484 |
1,379 |
318 |
484 |
Consumption |
75,708 |
60,568 |
81,517 |
81,815 |
86,427 |
86,122 |
|
|
Copper Sheet, Strip and Plate |
|
|
|
|
Production |
1,020 |
1,048 |
4,075 |
3,194 |
506 |
1,950 |
Imports |
470 |
370 |
177 |
142 |
1,070 |
1,961 |
Exports |
1,000 |
1,015 |
3,093 |
2,173 |
506 |
731 |
Consumption |
490 |
403 |
1,159 |
1,163 |
1,070 |
3,180 |
|
|
Copper Tube |
|
|
|
|
Production |
2,481 |
2,428 |
2,764 |
2,980 |
2,778 |
3,302 |
Imports |
700 |
968 |
1,003 |
1,184 |
2,304 |
2,798 |
Exports |
50 |
52 |
72 |
69 |
43 |
41 |
Consumption |
3,131 |
3,344 |
3,695 |
4,095 |
5,039 |
6,059 |
|
|
Copper Alloy Strip |
|
|
|
|
Production |
3,399 |
4,347 |
7,748 |
7,723 |
5,296 |
7,329 |
Imports |
50 |
76 |
29 |
424 |
796 |
897 |
Exports |
2,600 |
2,825 |
4,669 |
4,683 |
1,985 |
2,617 |
Consumption |
849 |
1,598 |
3,108 |
3,464 |
4,107 |
5,609 |
|
|
Copper Alloy Tube |
|
|
|
|
Production |
457 |
624 |
812 |
524 |
313 |
607 |
Imports |
600 |
630 |
664 |
606 |
1,165 |
1,315 |
Exports |
20 |
22 |
91 |
81 |
23 |
0 |
Consumption |
1,037 |
1,232 |
1,385 |
1,049 |
1,455 |
1,922 |
www.AceTheCase.com |
- 115 - |
Copyright 2007 |
Possible Solution and Discussion:
Rather than simply present a two page summary solution, we have decided to provide you with more detail and show some of the rough workings, notes and initial analysis that you would want to perform in order to construct a 2 page summary analysis. Remember, you only have 1 hour, so be sure to keep things simple and make sure you can draw out a story from the data. We have decided to focus on China and create a story around its growing demand for wirerod.
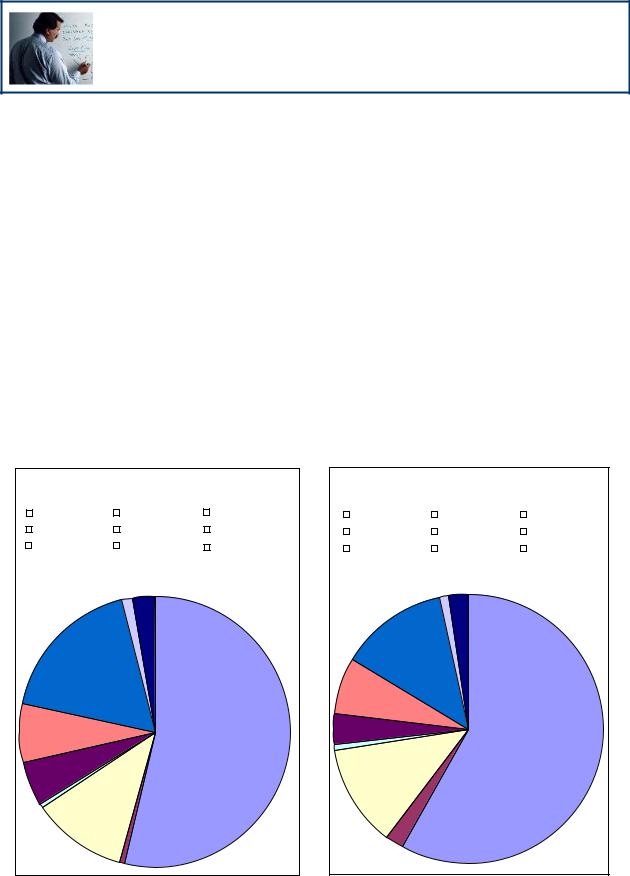
The data in Table 2 and the charts below show that China is by far the largest producer of copper semi’s in the region. It produced just over half of the regional total in 1997 alone. Its share of the total production has only increased over time whereby in 2002 it was producing close to two thirds of the regional total. As a side note, South East Asia’s production levels decreased over this time.
1997 Copper Semi Production
|
|
China |
|
Egypt |
|
India |
|
|
Pakistan |
|
Saudi Arabia |
|
Turkey |
|
|
|
|
|||
|
|
|
|
|||
|
|
South East Asia |
|
Gulf States |
|
Iran |
|
|
|
|
|
|
|
2002 Copper Semi Production
|
|
China |
|
Egypt |
|
India |
|
|
|
|
|||
|
|
Pakistan |
|
Saudi Arabia |
|
Turkey |
|
|
|
|
|||
|
|
South East Asia |
|
Gulf States |
|
Iran |
|
|
|
|
|||
|
|
|
|
|
|
|
www.AceTheCase.com |
- 116 - |
Copyright 2007 |

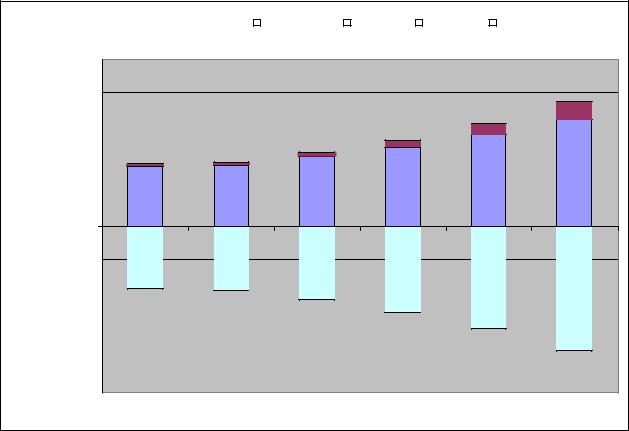
Staying in Table 2 and looking at the chart below it can be seen that China’s overall demand for Copper semis has historically been greater than production, meaning they have to import many tonnes to meet demand. This supply-demand differential gap has been rising in recent years.
China - Production and Consumption |
|
|
Production |
|
Consumption |
|
|
|
|||
of Copper Semis |
|
|
|
||
|
|
|
|
|
3,500,000 |
|
|
|
|
|
3,000,000 |
|
|
|
|
|
2,500,000 |
|
|
|
|
|
2,000,000 |
|
|
|
|
|
Tonnes |
|
|
|
|
|
1,500,000 |
|
|
|
|
|
1,000,000 |
|
|
|
|
|
500,000 |
|
|
|
|
|
0 |
|
|
|
|
|
1997 |
1998 |
1999 |
2000 |
2001 |
2002e |
|
|
|
Year |
|
|
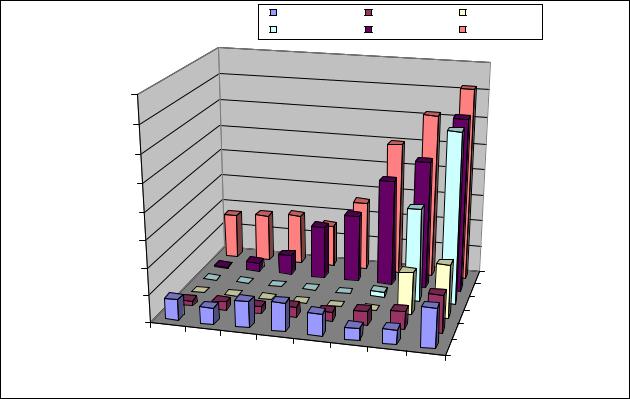
In Table 3. we see that wirerod is the most prevalent copper semi being produced and consumed in China. From the graph below we can see that imports of wirerod have increased 6 fold in order to meet demand within the country, whilst consumption has doubled. Exports within the graph are negligible and this is reflected in the data.
What must be happening is that China’s economy is growing so fast (evident by the growth in consumption) that business’s are having to import more and more tonnes of wirerod to meed their needs.
On a similar note ACR Tube (Air Conditioning and Refrigeration) consumption has tripled and ACR tube inputs have doubled. China also does not export any of this copper semi.
www.AceTheCase.com |
- 117 - |
Copyright 2007 |
Tonnes
China - Wirerod |
|
|
Production |
|
Imports |
|
Exports |
|
Consumption |
|
|
|
|
|
|||||
|
|
|
|
|
|
|
|
|
|
2,500,000
2,000,000
1,500,000
1,000,000 |
|
|
|
|
|
500,000 |
|
|
|
|
|
0 |
|
|
|
|
|
1997 |
1998 |
1999 |
2000 |
2001 |
2002e |
-500,000 |
|
|
|
|
|
-1,000,000 |
|
|
|
|
|
-1,500,000 |
|
|
|
|
|
-2,000,000 |
|
|
|
|
|
-2,500,000 |
|
|
|
|
|
|
|
|
Year |
|
|
With dramatic increases in both of these copper semis, we could be led to believe that there may have been an increase in the level of construction and development in China, with buildings demanding wirerod for concrete reinforcement and ACR tube for air conditioning.
Table 4 and the chart below illustrates that China originally sourced the majority of its wirerod from Taiwan, however recently South Korea, Russia and Kazakhstan have become major players in the exporting of wirerod to China. This graph also highlights the massive growth in wirerod now crossing into China.
In terms of the ACR Tube, China sources almost all of its import requirements from Japan. This is evident in Table 7.
www.AceTheCase.com |
- 118 - |
Copyright 2007 |
Chinese Imports of Wirerod by Origin |
|
Others |
|
Australia |
Russia |
|
||
|
|
Kazakhstan |
South Korea |
Taiwan |
|
|||
80,000 |
|
|
|
|
|
|
|
|
70,000 |
|
|
|
|
|
|
|
|
60,000 |
|
|
|
|
|
|
|
|
50,000 |
|
|
|
|
|
|
|
|
Tonnes 40,000 |
|
|
|
|
|
|
|
|
30,000 |
|
|
|
|
|
|
|
|
20,000 |
|
|
|
|
|
|
Taiwan |
|
|
|
|
|
|
|
|
|
|
10,000 |
|
|
|
|
|
|
South Korea |
|
|
|
|
|
|
|
Kazakhstan |
|
|
|
|
|
|
|
|
|
|
|
0 |
|
|
|
|
|
|
Russia |
Country |
|
|
|
|
|
|
Australia |
||
1995 1996 1997 |
|
|
|
|
|
|
||
1998 |
1999 |
|
|
|
Others |
|
||
|
|
2000 |
2001 |
2002 |
|
|
||
|
|
|
|
|
|
|
||
|
|
|
|
|
|
|
|
|
|
Year |
|
|
|
(1-10) |
|
|
|
From this graph we could speculate that countries such as Kazakhstan and Russia have only just realised the growth potential in China for wirerod and started exporting to China on a dramatically increased scale, or perhaps certain trade barriers between these nations have finally been lifted.
Finally, looking at many of the other wirerod producing nations in the region (Tables 8-15) we can see that wirerod is in high demand but not heavily exported. This leaves the door wide open for resource rich nations in the region such as India, Australia and some of the African nations to take advantage of the Chinese wirerod demand boom and the general wirerod production shortage in the region.
In conclusion these nations just mentioned should perform further research on this topic and consider extracting the required metal ore from the earth and either shipping it over as ore, metal or finished wirerod, because with the growth boom in China, other nations in the region will be soon to follow.
www.AceTheCase.com |
- 119 - |
Copyright 2007 |
Question:
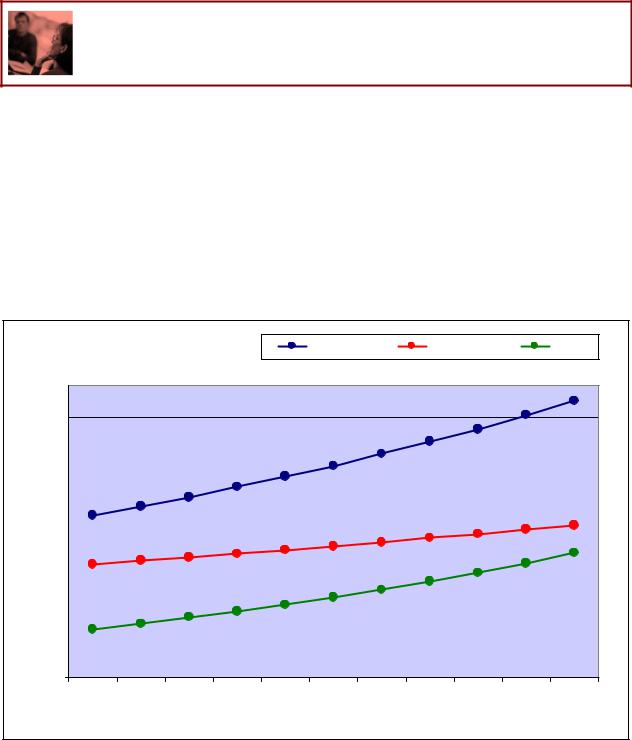
Interpret and explain the following chart.
In this style of case question, you are presented only with the chart below and no further information. You must be able to explain to the interviewer what may be happening within the business that this chart possibly reflects. Essentially, this type of charts based case is designed to assess your graphical analytical skills and to see how you deal with ambiguity. Feel free to make any necessary assumptions, but ensure these assumptions are consistent with each other.
Example Company Ltd. |
Revenue |
Expenses |
Profit |
|
180 |
|
|
|
|
|
|
|
|
|
|
|
160 |
|
|
|
|
|
|
|
|
|
|
|
140 |
|
|
|
|
|
|
|
|
|
|
|
120 |
|
|
|
|
|
|
|
|
|
|
Millions |
100 |
|
|
|
|
|
|
|
|
|
|
80 |
|
|
|
|
|
|
|
|
|
|
|
$ |
|
|
|
|
|
|
|
|
|
|
|
|
60 |
|
|
|
|
|
|
|
|
|
|
|
40 |
|
|
|
|
|
|
|
|
|
|
|
20 |
|
|
|
|
|
|
|
|
|
|
|
0 |
|
|
|
|
|
|
|
|
|
|
|
2007 |
2008 |
2009 |
2010 |
2011 |
2012 |
2013 |
2014 |
2015 |
2016 |
2017 |
|
|
|
|
|
|
Year |
|
|
|
|
|
www.AceTheCase.com |
- 120 - |
Copyright 2007 |