
- •Foreword
- •Preface
- •Contents
- •Symbols
- •1 Electromagnetic Field and Wave
- •1.1 The Physical Meaning of Maxwell’s Equations
- •1.1.1 Basic Source Variables
- •1.1.2 Basic Field Variables
- •1.1.3 Maxwell’s Equations in Free Space
- •1.1.4 Physical Meaning of Maxwell’s Equations
- •1.1.5 The Overall Physical Meaning of Maxwell’s Equations
- •1.2 Electromagnetic Power Flux
- •1.2.1 The Transmission of Electromagnetic Power Flux
- •1.2.2 Capacitors—Electrical Energy Storage
- •1.2.3 Inductor—Magnetic Energy Storage
- •1.2.4 Examples of Device Properties Analysis
- •1.3.1 Boundary Conditions of the Electromagnetic Field on the Ideal Conductor Surface
- •1.3.2 Air Electric Wall
- •2 Microwave Technology
- •2.1 The Theory of Microwave Transmission Line
- •2.1.1 Overview of Microwave Transmission Line
- •2.1.2 Transmission State and Cutoff State in the Microwave Transmission Line
- •2.1.3 The Concept of TEM Mode, TE Mode, and TM Mode in Microwave Transmission Line
- •2.1.4 Main Characteristics of the Coaxial Line [4]
- •2.1.5 Main Characteristics of the Waveguide Transmission Line
- •2.1.6 The Distributed Parameter Effect of Microwave Transmission Line
- •2.2 Application of Transmission Line Theories in EMC Research
- •3 Antenna Theory and Engineering
- •3.1 Field of Alternating Electric Dipole
- •3.1.1 Near Field
- •3.1.2 Far Field
- •3.2 Basic Antenna Concepts
- •3.2.1 Directivity Function and Pattern
- •3.2.2 Radiation Power
- •3.2.3 Radiation Resistance
- •3.2.4 Antenna Beamwidth and Gain
- •3.2.6 Antenna Feed System
- •4.1.1 Electromagnetic Interference
- •4.1.2 Electromagnetic Compatibility
- •4.1.3 Electromagnetic Vulnerability
- •4.1.4 Electromagnetic Environment
- •4.1.5 Electromagnetic Environment Effect
- •4.1.6 Electromagnetic Environment Adaptability
- •4.1.7 Spectrum Management
- •4.1.9 Spectrum Supportability
- •4.2 Essences of Quantitative EMC Design
- •4.2.2 Three Stages of EMC Technology Development
- •4.2.3 System-Level EMC
- •4.2.4 Characteristics of System-Level EMC
- •4.2.5 Interpretations of the EMI in Different Fields
- •4.3 Basic Concept of EMC Quantitative Design
- •4.3.1 Interference Correlation Relationship
- •4.3.2 Interference Correlation Matrix
- •4.3.3 System-Level EMC Requirements and Indicators
- •4.3.5 Equipment Isolation
- •4.3.6 Quantitative Allocation of Indicators
- •4.3.7 The Construction of EMC Behavioral Model
- •4.3.8 The Behavior Simulation of EMC
- •4.3.9 Quantitative Modeling Based on EMC Gray System Theory
- •5.2 Solution Method for EMC Condition
- •5.3 EMC Modeling Methodology
- •5.3.1 Methodology of System-Level Modeling
- •5.3.2 Methodology for Behavioral Modeling
- •5.3.3 EMC Modeling Method Based on Gray System Theory
- •5.4 EMC Simulation Method
- •6.1 EMC Geometric Modeling Method for Aircraft Platform
- •6.2.1 Interference Pair Determination and Interference Calculation
- •6.2.2 Field–Circuit Collaborative Evaluation Technique
- •6.2.3 The Method of EMC Coordination Evaluation
- •6.3 Method for System-Level EMC Quantitative Design
- •6.3.2 The Optimization Method of Single EMC Indicator
- •6.3.3 The Collaborative Optimization Method for Multiple EMC Indicators
- •7.1 The Basis for EMC Evaluation
- •7.2 The Scope of EMC Evaluation
- •7.2.1 EMC Design
- •7.2.2 EMC Management
- •7.2.3 EMC Test
- •7.3 Evaluation Method
- •7.3.1 The Hierarchical Evaluation Method
- •7.3.2 Evaluation Method by Phase
- •8 EMC Engineering Case Analysis
- •8.1 Hazard of Failure in CE102, RE102, and RS103 Test Items
- •8.2 The Main Reasons for CE102, RE102, and RS103 Test Failures
- •8.2.1 CE102 Test
- •8.2.2 RE102 Test
- •8.2.3 RS103 Test
- •8.3 The Solutions to Pass CE102, RE102, and RS103 Tests
- •8.3.1 The EMC Failure Location
- •8.3.2 Trouble Shooting Suggestions
- •A.1 Pre-processing Function
- •A.2 Post-processing Function
- •A.3 Program Management
- •A.4 EMC Evaluation
- •A.5 System-Level EMC Design
- •A.6 Database Management
- •References
312 |
8 EMC Engineering Case Analysis |
problems, it is also extremely difficult to find and eliminate because when the equipment was tested, the manufacturers usually have additional shielding measures to pass the test, or in the worst-case condition, the test was not carried out according to the actual installation on the platform. For example, many sensors on an aircraft are not tested, so the signals collected by the sensors are often simulated. As a result, although the equipment passed the 200 V/m test required by RE103, in the actual platform, however, there is often unstable interference which is difficult to reproduce, locate, and eliminate. Such interference may happen throughout the entire service period; in addition, when the platform is in an environment with field strength below 200 V/m, it is obvious that the platform is interfered, which will cause serious flight safety problems.
8.2The Main Reasons for CE102, RE102, and RS103 Test Failures
The monitoring object of the CE102 test is the input leads of the EUT power supply. The main reason for the test failure is that the power supply filtering of the equipment is not properly designed. Since the internal power consumption of each equipment is not the same, it is necessary that the power input passes multiple power conversion modules to fulfill the requirements for the internal modules of the equipment. In this circumstance, it is required to filter not only at the input leads of the primary power supply, but also at the input end of each secondary power supply. Moreover, each power supply filter must be designed for the specific situation; otherwise, signals exceeding the standard will be generated and it will enter the primary power supply through the secondary power supply, causing the CE102 result of the entire equipment to exceed the standard. A common cause of the excess result of CE102 is the pulsewidth modulation (PWM) signal during DC–DC conversion. The signal is usually at tens of kilohertz or hundreds of kilohertz, with strong amplitude and harmonics. It appears as a strong signal with a fixed interval in the CE102 test.
The monitoring object of the RE102 test is the radiation emissions generated by the equipment and subsystem cases and all interconnecting cables. The main reason for the test failure is that the interference signal is radiated from the slots, openings of the case, or connection cables due to poor design of the internal circuit EMC. Generally, the test frequency of RE102 is 10 kHz–18 GHz. According to the frequency characteristics of the signal, the wavelength of the radiated emission signal in the low-frequency band is longer, and the radiation is difficult to leak with respect to the slot of the case. Therefore, the excessive radiation at low frequencies is mostly transmitted through cables. In the high-frequency band, the signal wavelength is shorter, the cable attenuation is larger, and the excess radiation is emitted from the case slots; the boundary between the high and low frequency is related to the equipment size and cable length, and the empirical value is about 200 MHz. Although the radiation exceeding the standard of RE102 emits from the case slots, openings,
8.2 The Main Reasons for CE102, RE102, and RS103 Test Failures |
313 |
and cables, the reason for the excessive radiation is the internal circuit design. One of the most important points to be protected in internal circuits is the crystal. The crystal oscillator is a narrowband signal, often with strong amplitude and various harmonics. It appears as continuous multiple peaks with the excess result from RE102 test.
RS103 test is to simulate the field generated by the antenna transmission and use the field to illuminate the equipment case and cable to observe whether the equipment is susceptive. Similar to the RE102, the common test frequency is 10 kHz–40 GHz. According to the frequency characteristics of the signal, the low-frequency coupling channel is usually cables, and the high-frequency coupling channel is the case slots and openings. The susceptibility of the equipment usually goes into the equipment through cables, openings, and slots of the case, causing the internal circuit to respond and form interference. For cable coupling, cables and equipment interconnection connectors are the key parts to be protected against susceptibility. For aperture coupling, we need to focus on the treatment of the openings and the slots of the case. In general, to avoid susceptibility, we need to consider shielding and grounding of the cable; 360° bonding and filtering at the connector; internal filtering and wiring; design of the grounding system of the equipment.
8.2.1 CE102 Test
Example 8.1 A motor-type product uses 28 V DC and 115 V AC power. After the preliminary test, it was found that the 28 V DC passed the CE102 test, while the 115 V AC failed the test. The failure frequencies were mainly concentrated at 10–700 kHz, and the maximum value exceeded the limit for about 30 dB. To investigate this problem, two sets of contrast tests were carried out.
(1)Comparison between rotating and nonrotating motor in CE102 test. With all the other circuits working normally, the product was under CE102 test with rotating motor and nonrotating motor. From the test result (Fig. 8.1), we found that the rotating motor was only about 5 dB larger than the result of the nonrotating motor. The two results had the same trend and the same frequency band that exceed the standard. Therefore, the interference of the motor rotation to the power line is not the main factor of the CE102 failure.
(2)Comparison between the PWM control signal sent and unsent without motor rotation. In the motor driver circuit module, the PWM signal is used to control the rotation of the motor. When the motor was not rotating, the product was subject to CE102 test with the PWM control signal being sent and unsent. The test results (Fig. 8.2) show that when the PWM control signal was not sent, the test results all met the standard limit value requirements, and when the PWM control signal was sent, the test was failed.
The contrast test shows that sending PWM control signal will cause the product’s 115 V AC to fail the CE102 test. Now, we will analyze the result with the schematic diagram of the circuit (Fig. 8.3).

314 |
8 EMC Engineering Case Analysis |
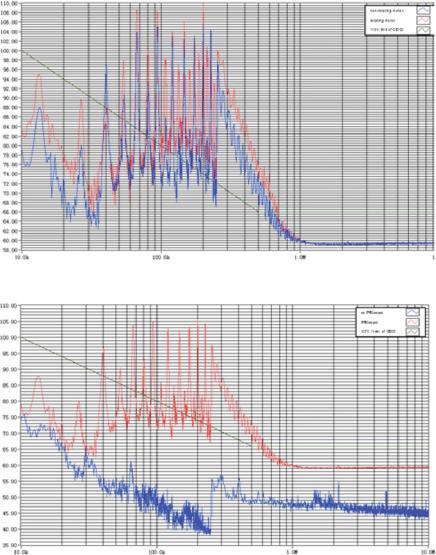
Fig. 8.1 Comparison of CE102 test curves between rotating motor and nonrotating motor
Fig. 8.2 Comparison of the CE102 test curve with PWM control signals sent and unsent

8.2 The Main Reasons for CE102, RE102, and RS103 Test Failures |
315 |
13.3kHz Low Voltage Level
PWM Signal
|
|
|
|
280V Chopped Wave |
|
Treble Phase |
Rectifier |
280V DC |
|
Motor |
|
115V |
Driver Control |
||||
|
|
|
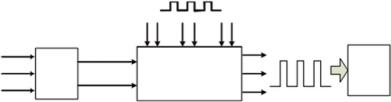
Fig. 8.3 Schematic diagram of the motor driver module
The 115 V three-phase AC power was rectified to generate 280 V DC. The 280 V DC was controlled by PWM signal to form 280 V chopping wave to drive the motor. When the 280 V chopping wave was formed, with the rising and falling of voltage, the burrs was generated to form an EMI source, which went back to the 280 V DC bus bar and affected the 115 V three-phase AC line. At the same time, it can be seen from the CE102 test results that the peak of the failure curve is 3–46 harmonics, and the odd-order harmonic amplitude is greater than the even-order harmonic amplitude. Therefore, when designing the driver circuit, the filtering measures matched with the driver control circuit should be added to the 280 V DC bus to suppress the conduction interference.
8.2.2 RE102 Test
Example 8.2 A product failed RE102 test, and the failure frequency points were concentrated at 2–30 MHz, and the maximum value was 5 dB larger than the limit.
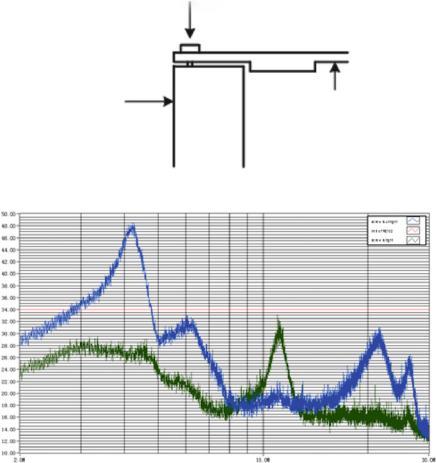
In the problem diagnosis test, it was found that the RE102 test results were inconsistent before and after the product case was opened for simple adjustment. Therefore, it was suspected that the shielding of the case was unstable, resulting in inconsistent test results. Through experiments, it was found that the RE102 test results were very different when the case screws were tightened and untightened (a half turn to lose after tightening). Since the shield design of the upper cover of the product was not good enough, the upper cover of the case was so thin that it deformed after being subjected to force, thereby creating a slot. Therefore, the screws must be tightened firmly; otherwise, the cover on the case would be poorly connected, resulting in leakage of electromagnetic energy. Figure 8.4 shows the bonding situation between the upper cover and the sidewall of the case.
After the old cables were replaced and the screws were tightened, the product passed the RE102 test. The comparison of the RE102 test curve with the screw tightened and untightened is shown in Fig. 8.5.

316 |
8 EMC Engineering Case Analysis |
Screw
Case |
Case |
side wall |
top cover |
Fig. 8.4 Bonding situation between the top cover and the sidewall of the case
Fig. 8.5 Comparison of RE102 test curve with screw tightened and untightened
Example 8.3 A subsystem for a certain mission consists of 14 pieces of equipment, and it failed the RE102 test. The failure frequencies were concentrated at 30–200 MHz, and the maximum value was 5 dB over the limit.
Necessary accessory equipment was added so that the 14 pieces of equipment could work separately. Each of the equipment went through the RE102 tests, and one piece of equipment was suspected to be the cause of the RE102 failure. Then, a copper mesh was used to cover the connectors, keys, fan power cable and other parts of the equipment, and the RE102 test is performed again. Through the tests, it was found that when the copper mesh covered the fan power cable, the RE102 test could be passed. Figure 8.6 shows the fan power cable and structure of the case.