

4.3.5 Form of a dot
The halftone structure can be completely defined by a single screen function, as well as in combinations of dots alphabet or spot function with the threshold function. Alphabet can be represented, in turn, by a set of bitmaps (Figure 4.10) or by defining the halftone dot shape with a separate matrix - spot function which cells numbers indicate only the order of the microdots inking as the dot grows, out of dependence on the signal value. Regardless of the shapes and relative position of the dot and blank, these values connection with the change in the ink coverage area inside the screen mesh provides a threshold function (Figure 4.14), which maps the alphabet symbol or microdots amount n in the matrix to the current signal value N.
|
|
|
Figure 4.14. Relation between the tone value S or the inked microdots amount n with the quantization level number N of the equi-contrast signal: for offset plates of positive (1) and negative (2) copying; for gravure (3) |
|
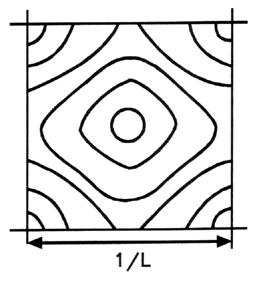
Figure 4.15. Iso-weight lines within the screen function period for providing the minimal perimeter of dots and blanks, as well as smoothing the tone jump at an adjacent dots touching in midtones
|
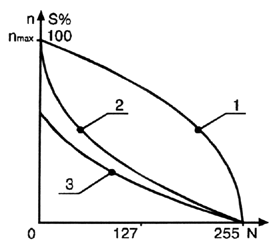
The shape of curves 1 and 2 in figure 4.14 corresponds to the logarithmic relationship between the visually uniform (proportional to the optical density) signal and the absorption as an ink coverage.
As shown in Table 1, the tone dispersion parameters, such as margins of its spatial bounds, continuity, linearity, discreteness, and direction (geometry), strongly correlate to related properties of a halftone structure or an image itself. Bounds of dispersion define, for example, the print screen period (ruling) finally affecting an image sharpness and definition.
Table 1: Parameters of tone scale spatial dispersion and properties of a thereby produced halftone structure
Dispersion parameter |
Halftone structure property |
spatial bounds |
screen period (definition) |
continuity |
AM, FM (stochastic) |
linearity |
tone response curve |
discreteness |
number of gray levels |
direction |
form of print element, screen geometry |
The analytical setting of screen geometry as a function of microdot coordinates is now more widely used. Due to its generalized form, such particular parameters as the screen ruling, angling and degree of dot ellipticity can be set in the RIP at the image output.
The form of dots and blanks has to ensure unambiguous, with minimal distortion, transmission their area (tone and color of the future image) from the bit map onto the film, plate, offset blanket, paper. Such distortions can occur due to the dot gain, printing parameters instability (within the technological tolerances), plate wear in long runs and for the other reasons.
Such requirements are best met by round elements as having a minimum perimeter for a given area. However, the transition from round elements of lighter colors to round blanks in the shadows as the growth of tone is not possible. Therefore, the most common is so-called Euclidean law of their form transformation. Round elements of highlights are gradually converted into square ones, getting a chessboard in middle tones. Its square spaces make round, moving further to deep shadows.
However, the simultaneous touch of neighboring dots at all four sides with a smooth increase in tone is accompanied by a noticeable jump [2.5]. In this regard, for medium tones their elliptic or rhombic form is rational, in which the contact occurs first, for example, at S = 45%, in one direction only on two sides, and then, for example, at S = 55%, in the transverse direction in the other two. The tone jump is thus split into two smaller ones and becomes less noticeable.
The degree of shape deviation for the dots from round or square is characterized by their ellipticity. For example, at its values 0.5; 0.6;... 1.0, the rhombic dots touch each other initially (in one direction), reaching an area of 25%, 30% ... 50%. According to ISO 12647, the direction coinciding with the larger size of the ellipse or rhomb is called the principle axis, relative to which the screen angle for one or another of the process inks is defined. Lines of the close weight values, taking into account the above considering for the halftone dots geometry, illustrates figure 4.15.
The threshold function is selected according to the type of printing and equipment, the specifics of obtaining intermediate copies on film or plate, etc. Examples of such dependencies are given in figure 4.14. The both axes scales, as schematically explains figure 4.16, are discrete. Therefore, in curve segments with a large slope 1, the signal change by one level is responded by adding several microdots, while in segments with a small slope 2 vice versa. If in the first case the number of halftone symbols is excessive in relation to the signal discreteness, but in the second case, due to the insufficient size of the matrix (amount of microdots), the values of signal neighboring levels are responded without ink coverage variation.
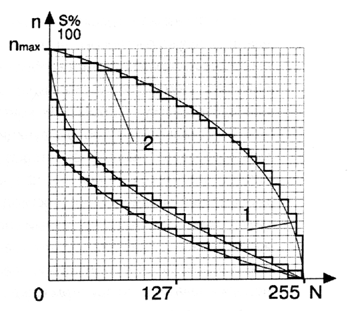
Figure 4.16. The size nmax of the microdots matrix is finite and therefore may be excessive (1) or insufficient (2) with respect to the quantized image signal N in different areas of the tone range
Curve 3 in the figures 4.14 and 4.16 shows that about the 30% of microdots is set on a gravure plate out of connection with the tone value to build between cells the partitions, which serve as a support for the squeegee (“doctor blade”), removing excess ink previous to contact with a paper.
Optimal screen function or form of such graphs is corresponded by the utmost uniform step wedge, which can be produced at given printing conditions. The criterion of equal contrast here can be the presence of just noticeable steps between all adjacent patches of the wedge. It can reach 16, 32 or 64 patches, depending on the paper quality and other parameters that characterize the noise level of a particular technology. If at the same time each of the subsequent patches is provided by each sixteenth, thirty-second or sixty-fourth level of the eight-bit signal it can be considered that this signal is also perceivably uniform.
In this case, the printing system is linear and is characterized by the minimum possible loss of gradations. Otherwise, for the complete use of a system tone rendition facilities, appropriate changes are made to the relationship between the quantization level (signal value) and the wedge patch numbers. To limit the loss of such a nonlinear correction allows more than double the signal levels number (256) over the amount of steps, separately reproduced in the most advanced printing technology.6