

я |
4. Screening
4.1 Tone measure spatial dispersion
4.2 Optical methods
4.2.1 Halftoning photo effect in screening
4.2.2 Projection screening
4.2.3 Contact screening
4.2.4 Photomechanic equipment
4.3 Electronic dot generation
4.3.1 Basic principles
4.3.2 Continuous modulation of halftone dot area
4.3.3 Discrete dot area control
4.3.4 Screen function
4.3.5 Form of a dot
4.3.6 Error diffusion halftoning
4.3.7 Halftoning at lacking the resolution output
Summary issues
Tests
4. Halftoning
4.1 Tone measure spatial dispersion
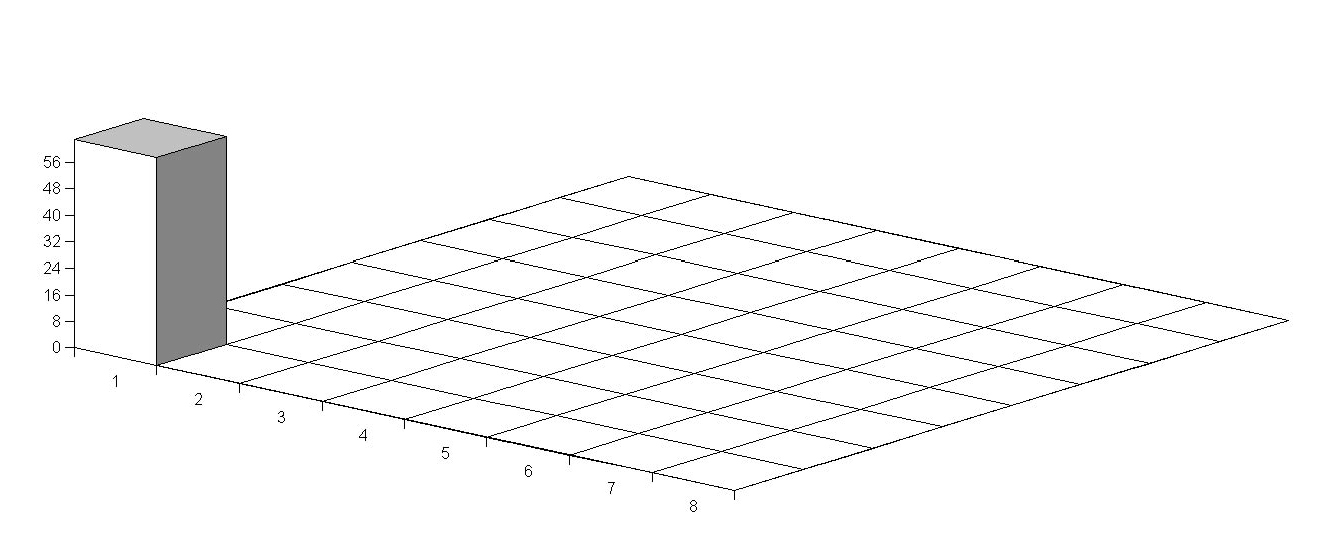
In the certain point of a photograph the value of reflection can vary within its whole range. Similarly, within whole brightness range, the pixel intensity varies on TV screen or computer monitor any of the tone measure quantization levels can be assigned to the certain element of an image file in the so called raster graphics (Figure 4.1 a).
Autotype principle involves the separation of these levels within sampling area, screen mesh or some other print unit portion among the microdots or sub-elements thereof to make their blackening responsible to the difference just between some adjacent tone levels [4.1].
а) b) c)
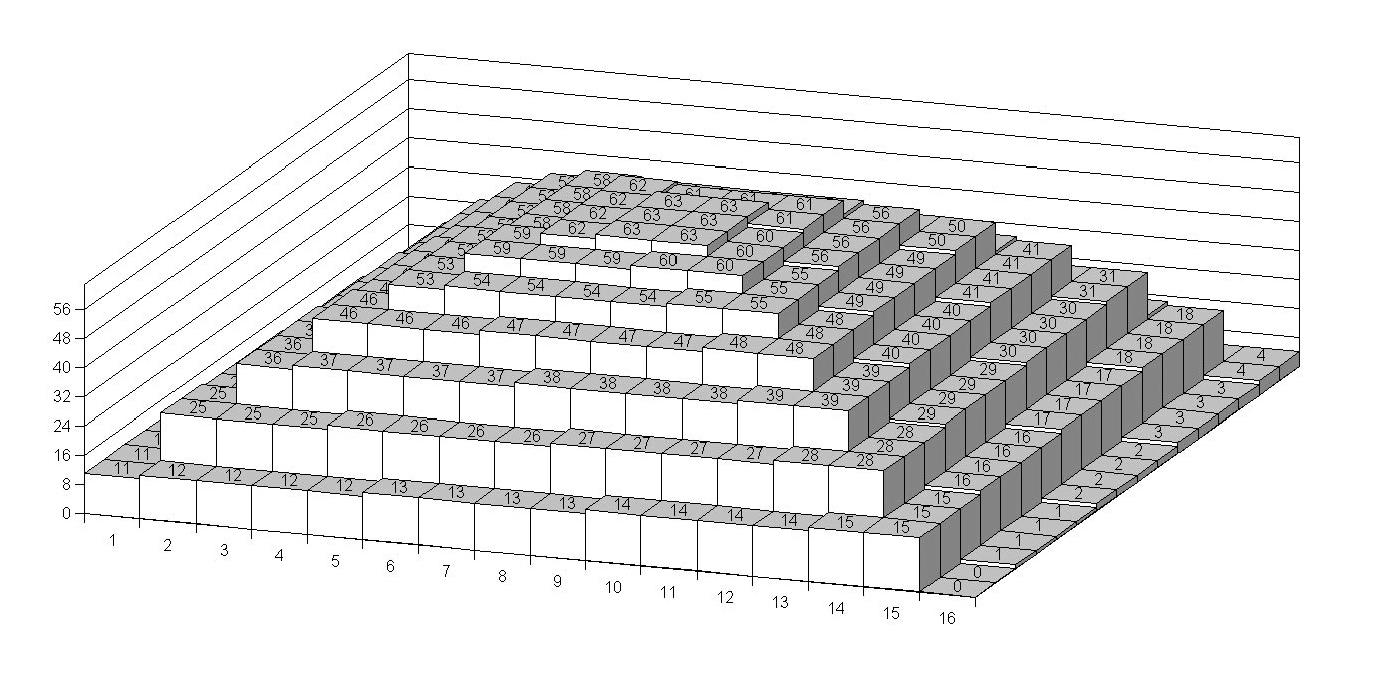
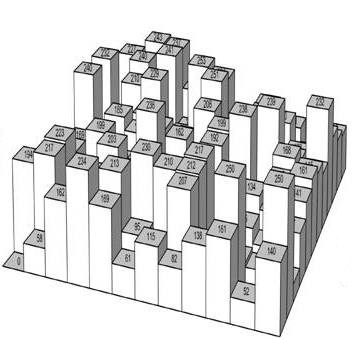
Figure 4.1. Multilevel tone measure assigned to a pixel in image file (a) is subject to monotonous (b) or random, dither (c) dispersion within some unit area of a halftone copy
Such portion can be discerned on the AM halftones produced with use of the functions similar to that presented in figure 4.1 (b). But it isn’t visually acute on the tint of halftone generated by FM (dither) or error diffusion methods. Nevertheless, some spatial period, within which the reproduction system responses to one level of an image signal, does, in one way or another, exist in any kind of screening.
In the most of the lower discussed digital halftoning methods the levels are distributed as microdots weights of specified screen function. Tone measure can be dispersed periodically with various geometry and law of monotonous increase / decrease (Figure 4.1 b) or in random fashion (Figure 4.1 c). The latter can be uniformly probable, providing the spatial frequency spectra of halftone structure related to the ”white noise”. Filtration by the low band “blue” mask to certain extent excludes the microdots clusters and results in more uniform distribution of print elements and blank spaces.
4.2 Optical methods
4.2.1 Halftoning photo effect
During about a century the halftones were produced by exposure the original through special optical devices – projection and contact screens with the use of so called halftoning photo effect. Along with the variety of masking photographic methods, this, now obsolete technique, had, not too long ago, comprised the basic of prepress image processing. So, it wouldn’t be out of place to briefly describe its essence for further revealing the fundamental differences of the electronic and digital methods currently in use.
Contrary to the usual photographic effect resulting in the exposure dependant blackening of a sensitive layer, the halftoning photo effect divides the image on separate elements their size being defined by the amount of incident light. Within a unit image area (screen mesh) the dispersion is provided optically, by the intensity redistribution to a pyramidal or bell shape inside the light beam reflected from the related element of an original. At low luminance (from the dark area of original) the sensitive film layer responses just to the central part of such beam where the intensity is yet sufficient for creating small dots on the halftone negative.
Mechanism for the halftone effect and two conditions of it realization are explained in figure 4.2 with the use of three interrelated characteristics.
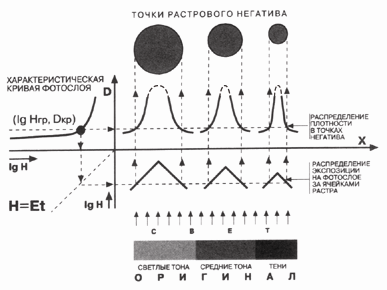
Figure 4.2. Mutual connection the resulting halftone dot size (І), exposure distributions within a screen cells (ІV) and threshold point (Dthr, lgHthr) on film density curve (ІI)
The first of these conditions is in the use of a high contrast, “line work” film with as possible short density range to operate in bi-level, b/w fashion. Its sensitivity curve is presented in the quadrant ІI as the dependence of resulting optical density D and exposure H = Et, where E and t are its luminance and duration.1 For high contrast photographic emulsions this curve has a pronounced kink in the marked threshold point (Dthr, lgHthr) of the transition from the lgH < lgHthr “fog” area to effective exposure range of film blackening. 2
Another condition is the formation of non uniform, excluding П - shape, exposure distributions of bell, pyramidal or any other profile providing the light dispersion for latent image within each screen cell (quadrant ІV).
In quadrant I there are shown the density distributions within the halftone dots on a negative after film processing. Dotted lines with arrows explain the formation of a pair of points for each of these distributions.3 It’s seen that these positions are set by the threshold coordinates Dthr, lgHthr on the film curve II and exposures shape within a screen cell (IV). Such shapes were provided in camera prepress by means of projection and contact screens.