

216 |
V. Balashov et al. / Acta Biomaterialia 68 (2018) 214–222 |
All studies conformed to the Guide for the Care and Use of Laboratory Animals, published by the United States National Institutes of Health (Publication No. 85–23, revised 1996) and approved by the Moscow Institute of Physics and Technology Life Science Center Provisional Animal Care and Research Procedures Committee, Protocol #A2–2012–09–02.
2.3. Scanning electron microscopy of the electrospun PLLA fibers
In preparation for the SEM imaging all nanofiber specimens were covered with 10 nm layer of gold utilizing 150R/ES sputter coater (Quorum Technologies, UK). JEOL JSM 6510LA SEM at an accelerating voltage of 15 kV was used for characterization of the shape and diameter distribution of nanofibers. JEOL software was used to define individual fiber diameter in each micrograph.
2.4. Optical mapping of cardiomyocyte culture
For monitoring of the functional activity the 3 days old cultures of cardiomyocytes on nanofiber substrate were loaded with the Ca2+-sensitive indicator Fluo-4 (Life Technologies, USA, F14201). After staining, the medium was exchanged with Tyrode’s solution (Sigma-Aldrich Co., USA, T2145) and kept at 20 LC during the optical mapping experiments. The cell activity and excitation waves were registered using Olympus DP72 digital camera on Olympus IX71 inverted microscope with 100x magnification.
2.5. Fluorescent staining and confocal imaging
Cardiac cells seeded on electrospun PLA nanofibers with the addition of Rhodamine 6G dye (Sigma-Aldrich Co., USA, 252433) were stained for F-actin, a-actinin and DNA (nuclei). Fixed in 4% paraformaldehyde (Sigma-Aldrich, 158127) samples were stained with Alexa Fluor 488 Phalloidin (Molecular Probes, A12379) for F-actin. After that the samples were counterstained with anti-a- actinin primary antibodies (Sigma-Aldrich, USA, A7811) and Alexa Fluor 594 secondary antibodies (A-11020, Life Technologies) for CM-specific labelling. After the following procedure the samples were mounted on a cover glasses with Vectashield Mounting Medium containing DAPI (Vector Laboratories, Inc., Canada), which stained nuclei.
The images were recorded using a laser scanning confocal microscope (Carl Zeiss LSM 710, Germany) with a Carl Zeiss PlanApochromat 63 objective lens. Z-stacks of fluorescent confocal images of cardiomyocytes and cardiac fibroblasts were acquired with 1024 1024 or 2048 2048 resolution and 0.3–0.8 mm Z- step.
2.6. Fixation and embedding
For TEM and SPNT studies the samples were fixed by 2% glutaraldehyde in PBS, postfixed in 1% osmium tetroxide (Sigma, USA, O5500) in PBS, dehydrated in graded (50%, 70%, 80%, 90%, 96%) ethanols, 1:1 96% ethanol-acetone mixture and, then, in 100% acetone. Epoxy Embedding Medium (Sigma, USA, 45359) was used for embedding of the samples according to the standard protocol. Dehydrated samples of cells on PDMS substrate with nanofibers were transferred to 1:1 epoxy-acetone mixture for 30 min and then clean epoxy embedding media was deposited on the substrate surface. After polymerization for 12 h at 37 LC and for 48 h at 60 LC PDMS substrate was separated and a thin layer of epoxy resin (FEM, Pavlovo, Russia) was deposited on the smooth ‘‘bottom” side, and then further polymerization for 24 h at 60 LC was carried out resulting in epoxy ‘‘sandwich” with the nanofibers and cells located in the middle.
2.7. Transmission electron microscopy
Epoxy embedded samples of the cardiac cells on nanofibers were sectioned in a plane perpendicular to the direction of nanofibers with use of Leica UC6 (Leica Microsystems GmbH, Austria) ultramicrotome and Diatome Ultra sonic 35 diamond knife (Diatome AG, Switzerland) in order to obtain ultrathin (70 nm) sections for TEM study. Obtained sections were deposited on EM copper grids and post-stained by uranyl acetate and lead citrate. Images were acquired on a JEOL JEM 100B transmission electron microscope at 80 kV accelerating voltage. Image detection was performed with 65x90 mm Agfa Camera CE film (Agfa-Gevaert N.V., Belgium). To improve the contrast of the obtained micrographs Bandpass Filter from ImageJ software was used.
2.8. Scanning probe nanotomography
For SPNT study of 3D microand nanostructure of the samples we used NTEGRA-Tomo system (NT-MDT Spectrum Instruments Co., Moscow, Russia), which comprises a scanning probe microscope integrated with Leica EM UC6 ultramicrotome (Leica Microsystems GmbH, Austria) [22] Consequent sections of the cardiac cell sample with 120 nm section thickness were carried out with use of Ultra sonic 35 diamond knife (Diatome AG, Biel, Switzerland) with 3.0 mm blade width. SPM measurements of the sample surface after each section were performed in the semicontact mode at scanning rate of 1.5 Hz with use of silicon cantilever tips ETALON HA_HR (NT-MDT Spectrum Instruments Co., Moscow, Russia) with resonant frequency of 390 kHz and the tip radius smaller than 10 nm.
2.9. SPNT image data analysis
Scanning probe nanotomography study resulted in a stack of 54 consequent 16 16 mm 512 512 pixel SPM images with a section Z-step of 120 nm. Preliminary image processing was performed with Nova ImageAnalysis 1.0.26.1443 software (NT-MDT Spectrum Instruments, Moscow, Russia). Three dimensional structure of the cell on the fibers was reconstructed and visualized with use of Visage Imaging Amira 5.3.2 software package. This software was used for alignment of the images in XY plane, image segmentation, generation and rendering of cell and fibers surfaces. Final 3D reconstruction was built using the voxel size of 1 1 6 considering physical dimensions of Z-step and XY pixels of SPM scans.
2.10. Statistical analysis
All data presented are expressed as mean ± standard deviation. Average values and deviations were calculated by standard formulas. 50 fiber diameter measurements based on SEM data were carried out to determine the average fiber diameter. In order to determine the average width of the gap between cell membrane surfaces we have examined TEM images of 16 membrane folds. An average gap width for each fold was calculated in accordance with 10 gap width measurements carried out evenly along the fold. Then the average value and standard deviation of gap width for all folds were calculated.
3. Results
In the present work, we have studied the cell-fiber interface of neonatal rat cardiac cells seeded and cultured on suspended electrospun polylactide/fibronectin (PLA/FN) nanofibers (prepared as shown on the scheme in Fig. 1(a)) with an average diameter of 6 16 ± 101 nm (according to SEM measurements; see Fig. 1(b)).

V. Balashov et al. / Acta Biomaterialia 68 (2018) 214–222 |
217 |
Three-day old cultures were observed with the aid of phase contrast optical microscopy and optical mapping of the excitation wave and were confirmed to exhibit a usual spontaneous contractile activity. Recorded videos of cardiomyocytes contraction on the suspended nanofibers are shown in Movies S1 and S2 in the Supplementary materials.
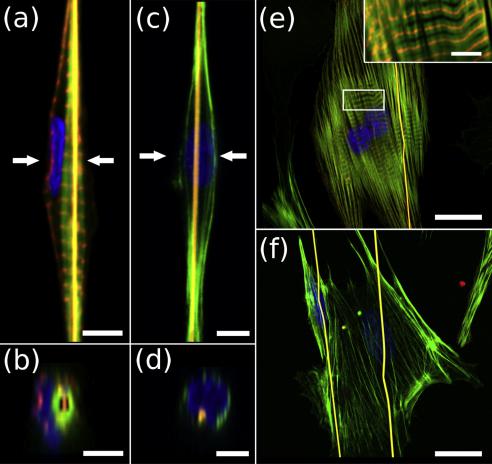
both types of cells on PLA/FN nanofibers on the PDMS substrate exhibit conventional spreading on the flat substrate surface (Fig. 2(e, f)). However, the presented confocal data shows that the fiber lays inside the cardiomyocyte cell and is totally surrounded with the cell cytoplasm (see Fig. 2(a, b)), while for the cardiac fibroblast we do not observe such a nanofiber wrapping
Movie S1. Phase contrast optical image of neonatal rat cardiomyocyte contracting on suspended fiber.
Movie S2. Optical mapping of neonatal rat cardiomyocyte contracting on suspended fiber.
Fig. 2 shows CLSM images of neonatal rat cardiomyocytes and cardiac fibroblasts seeded and grown for 72 h on suspended PLA/ FN nanofibers (Fig. 2(a–d)) and on PLA/FN nanofibers on the PDMS substrate (Fig. 2(e, f)) of the same sample. Nanofibers here are marked with orange, F-actin in the cell cortex and myofibrils are stained with green, a-actinin in sarcomeric Z-discs of cardiomyocytes is stained with red, and nuclei are counterstained with blue. As expected, both types of cells on suspended nanofibers form spindle-like shapes and grow along the fibers (Fig. 2(a, c)), while
(Fig. 2(d)). In case of the cardiomyocyte in Fig. 2(a, b) it is important to note that the enveloped fiber is inside the myofibril. We have built and analyzed CLSM 3D stacks for 51 cardiomyocytes and 57 cardiac fibroblasts and found that 41 of 51 cardiomyocytes under study enveloped nanofibers in this way, while only 6 of the 57 fibroblasts showed a moderately similar pattern.
The CLSM method, however, has a limited resolution and does not show precisely how cells envelope nanofibers, or whether the fibers penetrate the cell or just are pushed deeply into cells
218 |
V. Balashov et al. / Acta Biomaterialia 68 (2018) 214–222 |
Fig. 2. 3D CLSM images of neonatal rat cardiomyocytes and cardiac fibroblasts on suspended nanofibers and on nanofibers on the PDMS substrate. PLA/FN nanofibers are stained with Rhodamine 6G (orange), actin filaments of the cells (in cell cortex and myofibrils) are stained with Alexa 488 Phalloidin Conjugated (green), a-actinin in sarcomeric Z-discs of cardiomyocytes is stained with anti-a-actinin primary antibodies and Alexa Fluor 594 secondary antibodies (red), nuclei are counterstained with DAPI (blue). (a) Optical slice of a cardiomyocyte with an enveloped fiber. (b) Optical cross-section of the cardiomyocyte depicted in (a). Polymer nanofiber (orange) is surrounded by myofibril (green). (c) Optical slice of a cardiac fibroblast on the fiber. (d) Optical cross-section of the fibroblast depicted in (c). (e) Optical slice of cardiomyocytes grown on PLA/FN nanofibers on the PDMS substrate. Inset shows the magnified area of a cardiomyocyte sarcomeric structure, marked with a rectangle. (f) Optical slice of cardiac fibroblasts grown on PLA/FN nanofibers on the PDMS substrate. Arrows on a) and c) show locations of the corresponding optical cross-sections. Scale bars in (a – d) and inset in (e) are 4 mm. Scale bars in (e, f) are 20 mm. (For interpretation of the references to colour in this figure legend, the reader is referred to the web version of this article.)
remaining separated from the intercellular space by the cell membrane. We obtained the answers to these questions with the aid of high-resolution TEM and SPNT studies.
Fig. 3 demonstrates TEM microphotographs of cross sections of cardiomyocytes (Fig. 3(a, b)) and cardiac fibroblasts (Fig. 3(c, d)) grown on suspended PLA/FN nanofibers. It is worth mentioning that all ultramicrotome sections for TEM were performed in a plane perpendicular to the general direction of the fibers (along the groove direction in initial PDMS substrate used for formation of suspended fibers). Given that, according to CLSM data, cardiomyocytes myofibrils are aligned along the fibers, it can be expected that a large number of myofibrillar sarcomeres can be distinguished in the cross section TEM images of cardiomyocyte but in this projection we cannot detect a Z-lines structure which is observed in the CLSM images.
TEM images presented in Fig. 3(a, b) and Fig. S1 in Supplementary materials show the structures characteristic of transverselysectioned myofibril sarcomeres [30]. In the areas marked as ‘‘mf” one can identify thick myosin filaments surrounded by thin actin filaments (A-band) which are located in a very regular, hexagonal pattern. A significant amount of myofibrils observed let us infer that cells shown in these images are cardiomyocytes and not
fibroblasts or myofibroblasts, which, in contrast to cardiomyocytes, are characterized by prominent rough endoplasmic reticulum and only peripheral myofilaments (stress fibers), not myofibrils [31].
Fig. 3(a, b) and Fig. S1 in Supplementary materials show that cardiomyocytes can envelope a single nanofiber or even a bunch of several nanofibers with the effective diameter more than 1 mm simultaneously (Fig. 3(b)), while the presented fibroblasts do not really wrap the fibers, but rather spread out on them (Fig. 3(c, d)). Even though the fiber may go through the middle of the cardiomyocyte, it is still possible to observe a very narrow membrane gap leading from the fiber to the extracellular space (see insets in Fig. 3(a, b)). According to our TEM measurements of 16 membrane folds from 11 cells, the average width of the gap between cell membrane surfaces is 22 ± 6 nm, while the length of the gap may vary from tens of nanometers (partial wrapping) to tens of microns. Thus, we can conclude that topologically a fiber is still outside of the cell; however, the cell creates a sheath for the fiber surrounding it with a cell membrane. Some folds are located above fibres (f1, f2 in Fig. 3(a), f3 in Fig. 3(b)), which indicates the active nature of fibers encompassing. Moreover, it is worth noting that

V. Balashov et al. / Acta Biomaterialia 68 (2018) 214–222 |
219 |
Fig. 3. TEM images of cardiomyocytes and cardiac fibroblasts grown on suspended fibers. (a, b) TEM images of typical cardiomyocytes grown on suspended fibers. Insets present magnified marked areas with fibers and cellular membranes enveloping the fiber. The fibers f1 and f2 in a) and f3 in b) are wrapped, but located above the cells. Most myofibrils (mf) are located near polymer nanofibers. (c) TEM image of spindle fibroblasts grown on suspended fiber. (d) TEM image of polygonal fibroblast grown of several suspended fibers. The cell has minimum interaction area with two fibers, One fiber (double) is partially swallowed. The following designations are used: f — PLA/FN fibers, mt — mitochondria, mf - myofibrils, er — rough endoplasmic reticulum, N - nucleus. Black arrows indicate cell membrane folds. Scale bars 1 mm. Scale bars in insets – 0.5 mm.
myofibrils (mf) in cardiomyocytes (Fig. 3(a, b)) are located mostly near enveloped fibers.
On the cell images shown in Fig. 3(c, d) one can identify an excess of rough endoplasmic reticulum [32], but we do not detect myofibrils or myofilaments in these micrographs. Therefore we can conclude that these cells are fibroblasts.
Fig. 3(c) shows a cross section of the spindle-like fibroblast interacting with a single suspended nanofiber. It can be seen that the nucleus of the cell limits cell elongation along the fiber. This observation is in accordance with the previous studies [33,34] suggesting that a nucleus is much stiffer than other cell’s structures. On suspended substrates a cell is able to stretch the whole cytoplasm except for the nuclear envelope which does not allow its maximum extension.
Fig. 3(d) represents the polygonal [35] fibroblast interacting with some suspended fibers. On this micrograph the cell just spread on 2 suspended fibers having minimum contact area with them, while the most outside nanofiber is partially wrapped by the fibroblast. Previous studies demonstrated that fibroblasts have some focal adhesion clusters where a cell interacts with the nanofibers [35]. Based on the properties of cytoskeleton dynamics it was shown [36] that cells try
to minimize their surface area whereby the fiber enveloping is not energetically beneficial. Considering this fact, we can assume that it is one of the focal adhesion sites where forces capable of overcoming resistance of actin cytoskeleton arise.
Fig. 4 and Movie S3 in the Supplementary materials show a 3D reconstruction of a cardiomyocyte enveloping suspended PLA/FN nanofibers. The reconstruction was carried out using the SPNT method. Here we segmented and integrated 54 SPM images of a block-face surface of the epoxy-embedded sample. Each image was obtained after consecutive 120 nm ultramicrotome sections. Fig. 4(a) presents one of the SPM images used for 3D reconstructions; in the inset on the higher resolution SPM image one can also see a membrane gap leading to the nanofibers. Interestingly, here we can observe a 3D ramification of the cell in three outgrowths guided along nanofibers which go in slightly different directions. Fig. S2 shows another SPM image used for the 3D reconstruction which was obtained before cell ramification. We do not detect any cell borders inside the outer contour of the cell, thus we may conclude that we see only one cell here which has three outgrowths along the nanofibers.