

Биоинженерия / ТИ_кость / ponche2010
.pdfProceedings of the Institution of Mechanical Engineers, Part H: Journal of Engineering in
Medicine
http://pih.sagepub.com/
Relative influence of surface topography and surface chemistry on cell response to bone implant materials. Part 1: Physico-chemical effects
A Ponche, M Bigerelle and K Anselme
Proceedings of the Institution of Mechanical Engineers, Part H: Journal of Engineering in Medicine 2010 224: 1471
DOI: 10.1243/09544119JEIM900
The online version of this article can be found at:
http://pih.sagepub.com/content/224/12/1471
Published by:
http://www.sagepublications.com
On behalf of:
Institution of Mechanical Engineers
Additional services and information for Proceedings of the Institution of Mechanical Engineers, Part H: Journal of Engineering in Medicine can be found at:
Email Alerts: http://pih.sagepub.com/cgi/alerts
Subscriptions: http://pih.sagepub.com/subscriptions
Reprints: http://www.sagepub.com/journalsReprints.nav
Permissions: http://www.sagepub.com/journalsPermissions.nav
Citations: http://pih.sagepub.com/content/224/12/1471.refs.html
>> Version of Record - Dec 1, 2010
What is This?
Downloaded from pih.sagepub.com at Universitats-Landesbibliothek on December 20, 2013

SPECIAL ISSUE PAPER 1471
Relative influence of surface topography and surface chemistry on cell response to bone implant materials. Part 1: Physico-chemical effects
A Ponche1, M Bigerelle2, and K Anselme1*
1Institut de Sciences des Mate´riaux de Mulhouse (IS2M), CNRS LRC7228, Universite´ de Haute-Alsace, Mulhouse, France 2Laboratoire Roberval, CNRS UMR6253, Centre de Recherche de Royallieu, Universite´ de Technologie de Compie`gne, Compie`gne, France
The manuscript was received on 19 July 2010 and was accepted after revision for publication on 12 August 2010.
DOI: 10.1243/09544119JEIM900
Abstract: Knowledge of the complexity of cell–material interactions is essential for the future of biomaterials and tissue engineering, but we are still far from achieving a clear understanding, as illustrated in this review. Many factors of the cellular or the material aspect influence these interactions and must be controlled systematically during experiments. On the material side, it is essential to illustrate surface topography by parameters describing the roughness amplitude as well as the roughness organization, and at the scales pertinent for the cell response, i.e. from the nano-scale to the micro-scale. Authors interested in this field must be careful to develop surfaces or methods systematically, allowing perfect control of the relative influences of surface topography and surface chemistry.
Keywords: surface topography, surface chemistry, roughness measurement, roughness parameters, implant, bone, coatings, surface treatments, XPS
1INTRODUCTION
Metallic hip prostheses and dental implants have been used successfully for several decades in orthopaedics and dental surgery. However, non-integration of the implants in surrounding bone tissue is sometimes observed without any evident cause. The understanding of how cells and tissue interact with the implant surface is then needed, with the aim to optimize implant surface performance. For several years, the current authors and others have tried to describe and understand the mechanisms under the human bone cell response to materials used in orthopaedics and dental surgery for bone filling or bone replacement [1– 5]. This review, divided into two companion papers, is intended to give an overview of the most important mechanisms underlying the cell response to a material’s surface. The physico-chemical aspects will be described in this first part and the biological aspects in
*Corresponding author: UHA, Institut de Science des Materiaux de Mulhouse, 15 rue jean starcky, BP2488, Mulhouse, 68057, France.
email: karine.anselme@uha.fr
the second part. To cover these different aspects, the review was written together with a material scientist, a physico-chemist, and a biologist, all specialists of the interfaces of materials with biological elements.
Surface features like topography and chemistry are known to be influencing factors for cells. However, the distinction between their relative effects is extremely difficult to achieve on implant materials because of the complexity of their composition and the process used for changing their topography or chemistry. Indeed, it is almost impossible to modify surface topography of implant materials without changing surface chemistry at the same time [6]. One possibility to overcome this difficulty is to process model materials, i.e. materials with homogenous composition (not alloyed), and use a process that does not apply energy that is too strong. The approaches based, for example, on nanoand micro-patterning are effectively very useful for understanding the mechanisms of cell response to topography, but they produce surface morphology and surface chemistry very different from what is observed on a real implant surface. Another possibility to discriminate the relative influence of topography and chemis-
JEIM900 |
Proc. IMechE Vol. 224 Part H: J. Engineering in Medicine |
Downloaded from pih.sagepub.com at Universitats-Landesbibliothek on December 20, 2013

1472 |
A Ponche, M Bigerelle, and K Anselme |
|
|
try is to cover the surface with a thin layer of another material in order to control the surface chemistry, but without changing the surface topography (at least at the micrometre scale) [7–10]. To make a replica of the surface in another material is another alternative [11, 12].
An important point in the characterization of surface topography is the definition of the pertinent parameters that can be identified in relation to the cellular response. Very frequently, the parameters used for describing surfaces or cell response are too limited in number and in relevance. Notably, the parameters describing roughness amplitude are generally privileged, although the parameters describing surface morphology and organization have been shown to have a better pertinence to human bone cell adhesion [13]. Additionally, surface and biological parameters are very rarely correlated together. In this first paper, the benefits of using a statistical approach to determine the best pertinent surface parameters for describing the biological response will be illustrated. Other important parameters need to be considered in these studies, such as the scale of analysis. The surface topography must be analysed not only at the cell scale but also at the scale below the cell scale, because, as will be described in this review, the mechanisms underlying cell response to the surface pass through proteins adsorbed on surfaces, cell membrane receptors and cytoskeleton molecules, all of them being at the nanometre scale.
The surface chemistry must also be perfectly controlled and characterized beforehand to study cell behaviour since, as seen previously, the modification of surface topography will modify concomitantly the surface chemistry. Various techniques exist to characterize surface chemistry and these will be described briefly here. The importance of preparation treatments for implants will be highlighted in particular.
The cellular mechanisms involved in cell–surface interactions will be described in the companion paper of this review.
2DEFINITION OF SURFACE TOPOGRAPHY
The objective of this section is to establish basic and essential notions in roughness measurement and analysis to allow the reader to proceed correctly with roughness characterization before correlating these measurements with parameters describing functionality such as the biological functions (cell adhesion, migration, proliferation, etc.). First, the different apparatus that can be used will be described, focusing notably on the respective advantages and disadvan-
tages. Second, the basic notions under roughness measurements will be defined, such as scale and resolution notions. The respective interests and limits of two-dimensional (2D) or three-dimensional (3D) measurements will be discussed. Finally, the notion of multiscale analysis will be introduced before the description of global analysis systems that allow definition of the best pertinent roughness parameter and its relevant scale for describing a specific functionality.
2.1Apparatus
There are principally three types of roughness measurement apparatus: stylus profilometer, atomic force microscopy (AFM), and optical apparatus. In this part, the focus is solely on the advantages and disadvantages of these techniques [14–16].
2.1.1Atomic force microscopy
For topographical investigations, the major limitation of AFM is that the response of the piezo scanner to voltage is not linear [17]. This leads to hysteresis, bow, drift, creep, and cross-coupling in the displacement of the piezo and errors in the displacement measurement, especially for large displacement [18]. The use of displacement sensors and servo loop system is useful to limit this problem, especially when accurate measurements are needed, but tends to add noise on the topographic signal. At the nanometre scale, the resolution of the image is limited by the non-vani- shing size of the probe. Even if atomic resolution could be achieved, in most cases the tip is not sharp enough to describe the surface features correctly. The AFM image is the result of the interaction between the tip and the sample surface. This phenomenon known as dilation tends to smooth the sharp features and fill the holes [19]. Nevertheless, AFM offers an incomparable resolution and is the ideal tool to describe topography at the submicrometre scale.
2.1.2Stylus profilometry
The principal advantages of this technique [20] is that the stylus is in contact with the surface and consequently the contact gives the amplitude level of the roughness with good accuracy and without depending on the optical properties of the surface. Another advantage is that this class of roughness recorder can measure a wide range of roughness amplitudes from 10 nm to over 1 mm. However, this apparatus also possesses several disadvantages. As the method is
Proc. IMechE Vol. 224 Part H: J. Engineering in Medicine |
JEIM900 |
Downloaded from pih.sagepub.com at Universitats-Landesbibliothek on December 20, 2013

Relative influence of surface topography and surface chemistry. Part 1 |
1473 |
|
|
based on contact, a force is applied on the surface by the stylus and this can damage the surface by plastic deformation. Moreover, on substrates with a low rigidity, elastic deformation can disturb the measurement. Another artifact, also encountered with AFM, is that the tip radius of the stylus [50 nm–10 mm] will smooth the surface and does not allow the more deep and narrow valleys to be recorded [21, 22]. Finally, the relatively high speed of the stylus can cause it to jump over peak roughness, which can change the peak curvature [23]. However, all theses artifacts can be easily quantified (scanning electron microscopy (SEM) observation of the surface, tip radius simulation algorithms, etc.). It should be noted that 3D measurement can be made using a tactile profilometer, but this is a very long process since it is basically composed of a succession of 2D measurements with a y displacement given by a motor table that can induce a lower definition in the y direction.
2.1.3Optical profilometry
Several optical techniques have been developed to record surfaces [24]. Rather than describing each technique, their common advantages and disadvantages will be summarized. The major advantage is that there is no contact with the surface, suppressing all risk of defects induced by contact mechanics. Such apparatus gives principally 3D measurements and possesses the same resolution in both directions. The time measurement is much reduced compared with AFM and stylus profilometry. The major disadvantage of this technique is that the measurement is very sensitive to both the optical surface properties and the surface topography. Contrary to contact measurement, the artifacts introduced by this apparatus are very difficult to quantify. For example, if the slope of the roughness is too high, then measurements cannot be processed. If a roughness step exists around the wavelength, an artificial peak can be created (known as the ‘batwings effect’) [16]. A second disadvantage of these techniques is that their resolution is low and limited around 1000 data by direction, and that is a very poor definition. Some stitching techniques (the process of combining multiple elementary topographical maps with overlapping fields of roughness to produce a high-resolution topographical map) exist to increase this resolution, but they drastically increase time of acquisition and introduce a high number of artifacts during surface reconstruction. The last disadvantage is that results depend on both the microscope objectives and the filter used in the signal treatment, which depends greatly on the apparatus itself.
As shown shortly, the choice of apparatus to measure roughness is a very difficult task. Moreover, the comparison of roughness measured with different apparatus such as AFM, optical and tactile profilometer is hardly possible even if the roughness is evaluated at the same scale. Differences in roughness amplitudes between different apparatus can be higher than the differences that characterize the different surfaces.
2.2Particular properties of surface roughness
Before analysing the roughness measurements, the surface has to be recorded. Whatever the roughness measurement, the roughness term means that the surface amplitude defined by z is given by a function of z~f ðxÞ for a profile recording and z~f ðx, yÞ for a surface recording. The first important remark is that it is impossible for any apparatus used for surface topography characterization to record surface when the roughness is composed of caverns, or more precisely when z~f ðx, yÞ is not unique for a fixed ðx, yÞ. Actually, all apparatus give the value of z~Sup½f ðx, yÞ&. In reality, a high number of surfaces used in the biomaterial field do not possess caverns, such as machined surfaces treated by grinding, cutting, sandblasting, etc. However, some can possess this structure, such as porous materials, some sputtered films, and so on (Fig. 1). Yet there is no protocol in the ISO roughness normalization to verify this assumption. At the usual scale of observation met in the literature (mm), no non-destructive techniques exist that can be used to verify that no caverns are present on the surface topography. The only available techniques are destructive and consist of cutting the surface orthogonally by high-precision cutting techniques (laser, water jet, focused ion beam (FIB), etc.) and observing the resulting sections microscopically.
2.3The pretreatment of profiles
After measurement, a recorded profile rðx, yÞ is obtained. The main problem is that in all apparatus measurements, the values of rðx, yÞ are given at an origin that is external to the surface and cannot be determined. The following step consists of finding an origin to the surface. This step is of major interest and is still subject to controversy. Roughly speaking, a smooth function sðx, yÞ is chosen and considered as the zero-level elevation surface. The basic idea is that the mathematical expression of this function is chosen so that roughness is not modified. For example, if
JEIM900 |
Proc. IMechE Vol. 224 Part H: J. Engineering in Medicine |
Downloaded from pih.sagepub.com at Universitats-Landesbibliothek on December 20, 2013

1474 |
A Ponche, M Bigerelle, and K Anselme |
|
|
Fig. 1 Example of limited aggregation structure simulated by a ballistic model presenting porous structure. The upper line (black) represents z~Sup½f ðx, yÞ&, which will be the measured roughness
roughness is measured on the femoral head of a hip prosthesis, then the form represents a circular shape on which roughness is present (scratches, cutting roughness, and so on). At the scale of the prosthesis, a third degree polynomial form can be used to approach sðx, yÞ [25, 26]. Then a final profile z is obtained such as zðx, yÞ 5rðx, yÞ 2sðx, yÞ. How to affirm that sðx, yÞ is the appropriate form? Answering this question is not a simple task. sðx, yÞ is well adapted if and only if
(a)zðx, yÞ becomes stationary, i.e. roughness parameters computed from the surface do not statistically change after a characteristic length that is lower than the evaluation length L (around L/5).
(b)sðx, yÞ does not contain any topographical information of the ideal surface zidealðx, yÞ.
The first condition is easy to verify with classical signal processing operators (such as autocorrelation length). The second one is impossible to verify by an automatic procedure because zidealðx, yÞ is unknown. This point is of major interest in the field of surface roughness characterization and must be specified in published results because, in the current authors’ opinion, roughness measurements cannot be compared in the literature of the biomaterials field without this information.
Suppose that sðx, yÞ contains information that is related to the surface functionality. Then this information is lost and can no longer be related to biological properties. For example, suppose that cell adhesion depends on a wave on the surface and that this wave is included in sðx, yÞ. Then, no correlation can be found between this form and cell adhesion [27]. More drastically, it is possible to filter surface roughness (low pass filter, high pass filter) that in fact leads to a new function s0ðx, yÞ such as zðx, yÞ 5 rðx, yÞ 2sðx, yÞ 2s0ðx, yÞ. Thus, the value of s0 ðx, yÞ can also remove biologically relevant information. This clearly means that the choice of sðx, yÞ and/or s0ðx, yÞ must be considered with respect to function of the biological properties analysed in the biomaterials.
2.4The scale and resolution of measurements
One important aspect in surface measurements is to choose the scale at which measurements must be carried out [28, 29]. Let Zðx, yÞ denote the original surface: the measure of the surface is often a subsurface zðx, yÞ 5Zðx, yÞ that is discretized into a grid zðiDx, jDyÞ for i [ f1, . . . , Nxg and i [ 1, . . . , Ny . This is very important because for a lot of roughness apparatus (confocal microscope, AFM, interferometer) the number of Nx and Ny is fixed (lying between 256 and 2048, and more often around 500). As claimed previously, the roughness must be stationary
at the scale |
ð |
NxDx |
=5 and NyDy 5, meaning that |
|
Þ |
|
the information lying between ½Dx, ðNxDxÞ=5& must lie in about 100 discretized points. This lead to the following important remarks.
1.The choice of Dx (the sampling length), which is imposed by the magnification, governs the observation scale.
2.From the Shannon theorem Dxwd=2, where d is the smallest detail required for analysis, the resolution of 100 points is reduced to 50 points. More
drastically, for fractal surfaces, the Shannon theorem fails and can lead to Dxwd=10.
This means that for each apparatus, the scale on which the phenomenon is governed must be perfectly known. The stitching method is a palliative solution, but this technique introduces several artifacts that will not be discussed in this paper. As a consequence, in all roughness study, the scale on which measurements must be made requires a great deal of attention and governs all conclusions. These points will be discussed in the next section.
2.5Twoor three-dimensional roughness measurements
According to the measurement system, 3D or 2D measurements can be taken, meaning that a profile
Proc. IMechE Vol. 224 Part H: J. Engineering in Medicine |
JEIM900 |
Downloaded from pih.sagepub.com at Universitats-Landesbibliothek on December 20, 2013
Relative influence of surface topography and surface chemistry. Part 1 |
1475 |
|
|
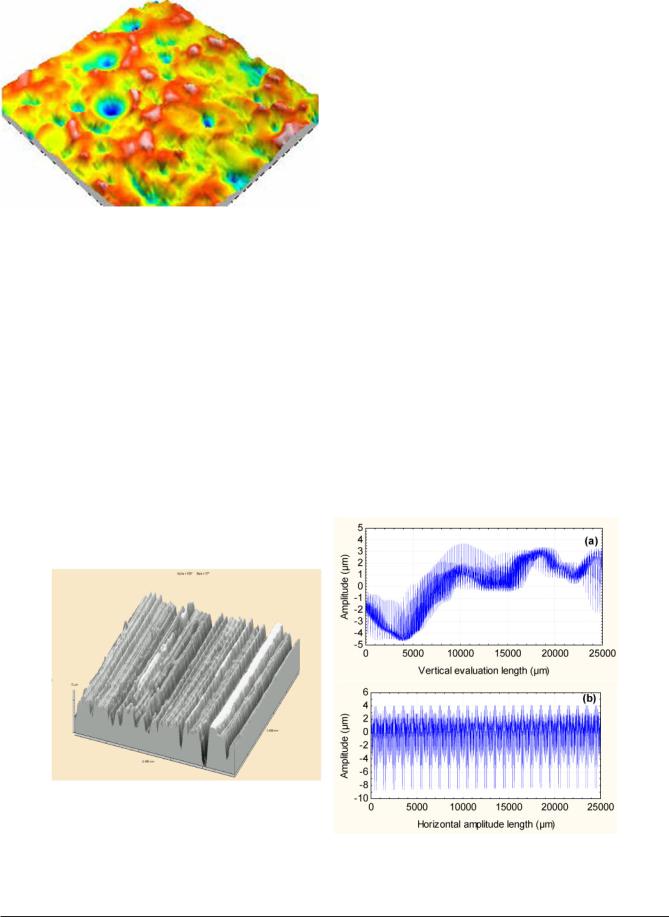
Fig. 2 Examples of an isotropic titanium surface obtained by electro-erosion
or a surface respectively is recorded. In rough terms, a 2D measurement contains a high number of points (often .10 000), whereas in 3D measurement the resolution, as shown previously, is very low (around 256–1024 points in a given axis direction). On the contrary, 3D measurements allow the surface to be seen and in all the directions. A surface can be considered as isotropic if its roughness is similar in all directions and more precisely if all profiles extracted from the surface, whatever the direction, lead statistically to the same profile, i.e. give statistically the same value of roughness parameters (Fig. 2). In this case, it can be
admitted that 3D measurements do not introduce more information than 2D measurements. On the contrary, if a surface is anisotropic, then the roughness depends on the direction, and roughness values must be used in specifying the direction of evaluation. In a high number of topographic surfaces, the directions of anisotropy are orthogonal and can be decomposed into two principal directions. Then their treatment can be carried out only in these two directions (Fig. 3). This point is of major interest since it can be easily understood; taking only one roughness parameter does not allow the anisotropy of the surface to be taken into account. A single parameter will average the two directions. Thus, at this stage, it would be more appropriate to decompose surfaces in profiles in the principal directions and to compute roughness parameters from the profiles. However, in 2D measurements, an artifact can appear that is not clearly mentioned in the literature. For example, in 2D measurements, the norm refers to ‘peaks and valleys’ to describe topography. However, when high peak amplitude is recorded in two dimensions, it is not really the highest altitude of the real peak visible in three dimensions. Indeed, the 2D peak amplitude will be always lower than the real 3D amplitude. It will only be equal if the profile scan passes exactly through the maximum of the 3D peak and that has a very low probability in a statistical sense. Unfortunately, no generic method exists to correct two dimensions.
Fig. 3 Three-dimensional measurement of an explanted knee prosthesis in CrCo after abnormal wear. (a) Two-dimensional profile in the wear direction (vertical, i.e. in the y direction). (b) Two-dimensional profile perpendicular to the wear direction (horizontal, i.e. in the x direction)
JEIM900 |
Proc. IMechE Vol. 224 Part H: J. Engineering in Medicine |
Downloaded from pih.sagepub.com at Universitats-Landesbibliothek on December 20, 2013
1476 |
A Ponche, M Bigerelle, and K Anselme |
|
|
2.6The roughness parameters
Basically, surface roughness 2D parameters are normally categorized into three groups according to their functionality [30]. They are defined as amplitude parameters, spacing parameters, and hybrid parameters. These definitions are the same in three dimensions, but another category appears that is spatial parameters such as, for example the density of summits, the texture direction, or the dominating wavelength [31]. The most used roughness parameter in the biomaterials field is the well-known Ra parameter [32, 33].
|
1 |
N |
|
|
|
|
|
Ra~ |
X |
zi |
j |
1 |
Þ |
||
|
|||||||
|
N i~1 j |
|
ð |
||||
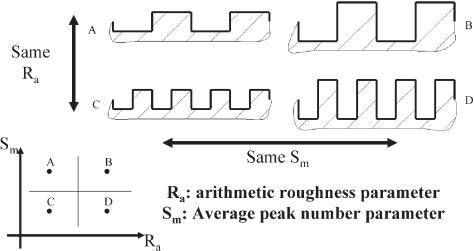
Another interesting parameter is Sm, which represents the average peak number on the profile.
Consider the scheme of four simulated surfaces obtained by the same process with different machining parameters (Fig. 4). Surfaces (A, C) have the same Ra and the same is true for surfaces (B, D). On the contrary, surfaces (C, D) like surfaces (A, B) have the same Sm. This clearly means two things [34]
(a)Ra is unable to characterize lateral roughness;
(b)one parameter is not enough in this case to characterize the surface.
More importantly, the Ra is unable to see the skewness of the profile, i.e. it cannot distinguish peaks and valleys. Then some amplitude parameters such as the skewness (Sk) must be used to see this difference [35].
2.7The multiscale measurements
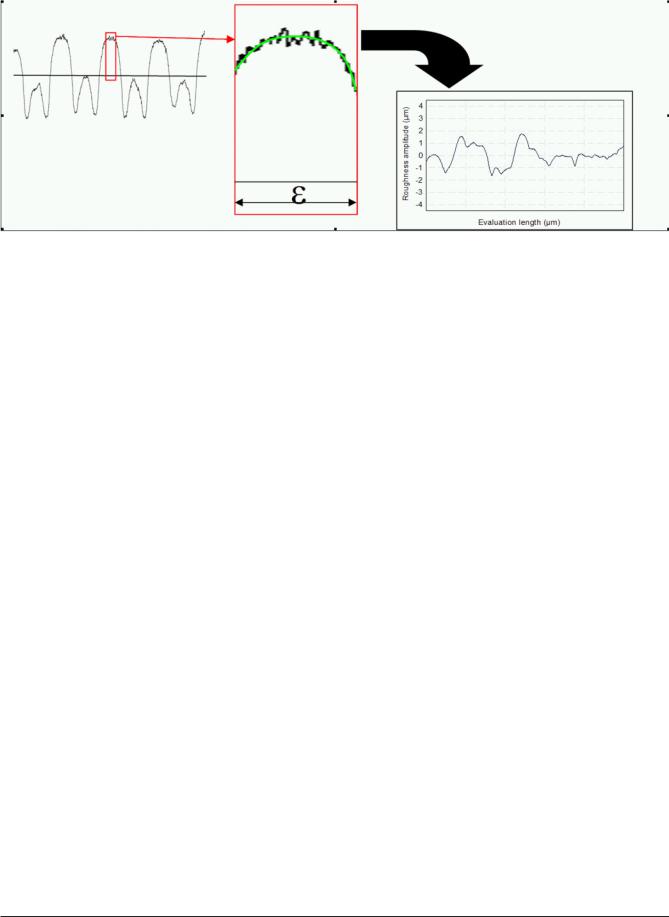
As shown previously, the value of a roughness parameter can depend on the scale of measurement. The concept of multiscale analysis will now be introduced. Consider a macroscopic profile (Fig. 5). Considering a scale e that defines a window, a second rectification can be performed by a polynomial fitting. Then, roughness parameters are calculated on the resulting profile, defining values of these parameters at the scale e. This method is equivalent to the filtering of high wavelengths that allow the micro-roughness to become apparent.
The calculation of roughness parameter values can then be applied on each profile obtained at different evaluation lengths. For example, the Ra(e) is obtained, meaning that the Ra depends on the scale e. In fact, all roughness parameters can then be computed at different scales [36–39]. The major interest of the multiscale analysis is then to find the optimal scale that describes best the surface functionality and this will be the basis of the next section.
2.8The choice of a roughness parameter and its relevant scale
There is increasing interest in developing reliable methodologies suitable for quality control stage processes for the surfaces of products in a manufacturing environment. The various industrial and scientific interests in topography analysis mean that a proliferation of roughness parameters, possibly running into hundreds, has been triggered to describe the different kinds of surface morphology with regard to specific functions, properties or applications. In spite of this
Fig. 4 Example of profiles both giving the same Ra |
(A 5C) ?(B 5D) and Sm parameter |
(A 5B) ?(C 5D) |
|
|
|
Proc. IMechE Vol. 224 Part H: J. Engineering in Medicine |
JEIM900 |
Downloaded from pih.sagepub.com at Universitats-Landesbibliothek on December 20, 2013
Relative influence of surface topography and surface chemistry. Part 1 |
1477 |
|
|
Fig. 5 Principle of a multiscale analysis. An original profile is recorded (left) and a scale function (centre) is defined on a window e from which the original profile is subtracted to obtain a new profile (right)
proliferation, termed by Whitehouse the ‘parameter rash’, there is still no complete understanding of the relevance of these roughness parameters. This probably comes from a lack of global methodology combined with the limits of the software presently on the market whose function is to characterize a surface morphology. In the present authors’ opinion, the main objective of such a global methodology must be to determine quantitatively, and without preconception, the most relevant roughness parameter that can characterize the surface morphology of a manufactured product with regard to a particular function, property or application. Then the question that arises is: ‘which parameter is the most relevant one to characterize the morphology of a machined surface with regard to a specific application, such as cell adhesion for example?’ The main purpose is to answer the previous question without any preconceived opinion on the surface roughness parameters and the scale at which they must be evaluated [40].
With the objective to answer this question, an original surface analysis system called ‘MesRug’ has been designed [41–44]. The interest of this system is to build a robust statistical analysis to create a probabilistic index, independent of the number of parameters that characterize the relevance of each roughness parameter. For this reason, a recent data analysis tool called the ‘bootstrap’ is used. This technique allows the process conditions to be found that give the best correlation with a physical or a biological process [41].
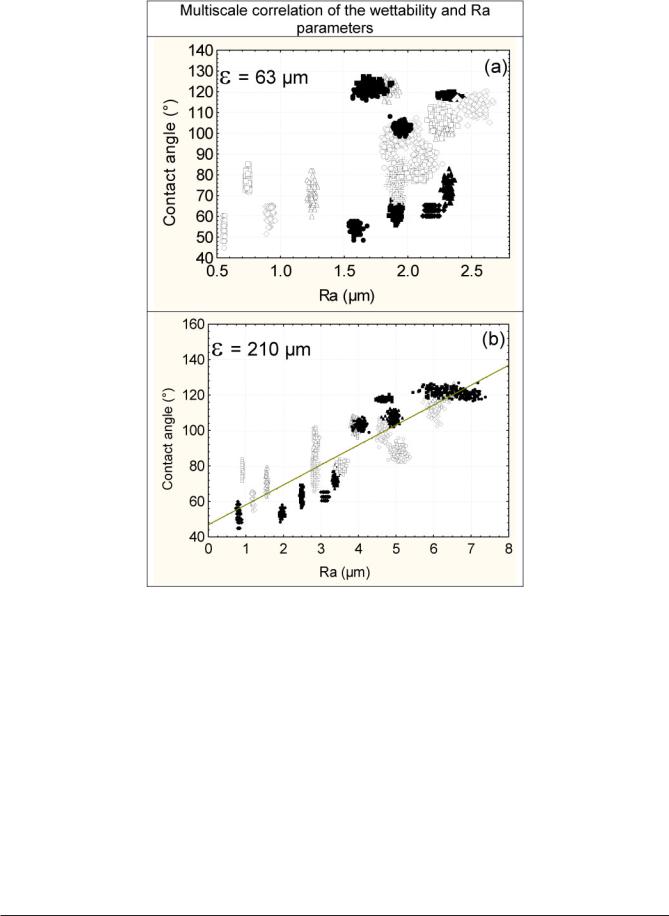
The importance of this approach will be illustrated through the correlation of wettability and surface roughness of titanium surfaces. The basic question is:
‘does the roughness of a surface influence its wettability?’ when the surface chemistry has been described as homogeneous after verification by XPS. Thirty surfaces were tooled by electro-erosion process to obtain a high range of roughness amplitudes. First, it is supposed that if a relation exists between surface roughness and wettability, an analytical form of this relation could be formulated. In a first attempt, a linear relation such as: hðeÞ~aðeÞ|RoughnessðeÞz bðeÞ is retained. When h is the contact angle, e is the scale of relevance, RoughnessðeÞ is a roughness parameter evaluated at the scale e, and ða, bÞ are two parameters obtained by the least-squares method that represent the relation between roughness parameter RoughnessðeÞ and wettability h.
Second, a multiscale treatment of the surface is processed. Figure 6 illustrates the original profile analysed at two different scales of observation: 63 and 210 mm. Then, for all surfaces and at all scales, roughness parameters are computed (more than 100). To illustrate the methodology, only the Ra will be presented. For this purpose 30 profiles are recorded for the 30 surfaces (indiced by k) and ten angle measurements are processed on each surface. Then to quantify the variation in both of these measures (i.e. angle h and roughness parameter RoughnessðeÞ), the bootstrap is used: for each pair k corresponding to the kth (k¡30) of the 30 surfaces, 30 values of Raðe, kÞ are taken randomly for each k surfaces with replacement and ten measures of angle measurements hðkÞ are also taken randomly. Then
ð Þ ð Þ
both means Ra e, k , h k are computed. This is a
1ð Þ 1ð Þ
first bootstrap simulation noted Ra e, k , h k . This step is then reproduced p times to obtain a set of
JEIM900 |
Proc. IMechE Vol. 224 Part H: J. Engineering in Medicine |
Downloaded from pih.sagepub.com at Universitats-Landesbibliothek on December 20, 2013

1478 A Ponche, M Bigerelle, and K Anselme
bootstrap |
sample |
|
Ra1 |
ð |
e, k |
Þ |
, h1 |
ð |
k |
, Ra2 |
ð |
e, k |
Þ |
, h2 |
k |
, |
|
|||||||||||||||
p |
|
|
|
|
|
|
|
|
|
|
|
|
|
Þ |
|
|
|
|
|
|
ð |
Þ |
|
|||||||||
. . . , Ra ðe, kÞ, hpðkÞ &. Figure 7 represents 100 boot- |
|
|||||||||||||||||||||||||||||||
strap samples for the 30 surfaces. For each i |
|
|||||||||||||||||||||||||||||||
bootstrap |
samples |
Rai |
ð |
e, 1 , hi |
ð |
1 |
, Rai |
ð |
e, 2 |
Þ |
, hi |
2 |
, |
|
||||||||||||||||||
. . . , Rai e, 30 |
|
, hi |
|
30 |
|
|
|
|
|
|
Þ |
|
|
Þ |
of |
|
|
|
|
|
ð |
Þ |
|
|||||||||
Þ |
ð |
Þ |
, the |
values |
|
ð |
a, b |
Þ |
noted |
|
||||||||||||||||||||||
ð |
|
|
|
g |
|
|
|
|
|
|
|
|
|
|
|
|
|
|
|
|
|
|
|
|||||||||
ai, bi can be computed, thanks to the least-squares |
|
|||||||||||||||||||||||||||||||
method. The classical critical value pcðRaðeÞÞ noted |
|
|||||||||||||||||||||||||||||||
pci ððRaðeÞÞÞ that represents, under the Gauss Markov |
|
|||||||||||||||||||||||||||||||
hypothesis, the probability to reject wrongly the fact |
|
|||||||||||||||||||||||||||||||
that aðRaðeÞÞ~0, is computed. The lower is pcðRaðeÞÞ, |
|
|||||||||||||||||||||||||||||||
the higher is the correlation between RaðeÞ and |
|
|||||||||||||||||||||||||||||||
contact angle h. It is then possible to plot all different |
|
|||||||||||||||||||||||||||||||
pcðRaðeÞÞ values of bootstrap samples versus evalua- |
|
|||||||||||||||||||||||||||||||
tion length as shown on Fig. 8. By analysing all the |
|
|||||||||||||||||||||||||||||||
scales, it is shown that the best relation is obtained if |
|
|||||||||||||||||||||||||||||||
this RaðeÞ |
is computed at the scale of 210 mm, i.e. |
|
||||||||||||||||||||||||||||||
Rað210 mmÞ. As it can be effectively observed on |
|
|||||||||||||||||||||||||||||||
Fig. 7(b), a very nice linear relation is found between |
|
|||||||||||||||||||||||||||||||
Ra and contact angle at this scale. Otherwise, when |
|
|||||||||||||||||||||||||||||||
the topography RaðeÞ is evaluated at the scale of |
|
|||||||||||||||||||||||||||||||
63 mm, i.e. Rað63 mmÞ |
(a classical evaluation length |
|
||||||||||||||||||||||||||||||
for AFM), the linear relation will not be any more |
|
|||||||||||||||||||||||||||||||
clearly shown (Fig. 7(a)). Then, the |
methodology |
|
||||||||||||||||||||||||||||||
proposed here (and developed in the present authors’ |
|
|||||||||||||||||||||||||||||||
software Mesrug) makes it possible to demonstrate |
|
|||||||||||||||||||||||||||||||
that the Ra is the best parameter, i.e. no other |
|
|||||||||||||||||||||||||||||||
parameter exhibits a better correlation (result not |
|
|||||||||||||||||||||||||||||||
shown) to characterize the wettability, but only if this |
|
|||||||||||||||||||||||||||||||
one is evaluated at the scale of 210 mm. |
|
|
|
|
|
|
|
|
|
|
|
|
||||||||||||||||||||
Finally, this illustrates that roughness characteriza- |
|
|||||||||||||||||||||||||||||||
tion must always be carried out at the best relevant |
|
|||||||||||||||||||||||||||||||
scale according to the functionality analysed. |
|
|
|
|
|
|||||||||||||||||||||||||||
To conclude this section, different notions must |
|
|||||||||||||||||||||||||||||||
be kept in mind before measuring and treating sur- |
|
|||||||||||||||||||||||||||||||
face topography. First, the reader must be conscious |
|
|||||||||||||||||||||||||||||||
that the choice of the apparatus for measuring rou- |
|
|||||||||||||||||||||||||||||||
ghness will have a strong influence on the outcome |
|
|||||||||||||||||||||||||||||||
and should be adapted to the surface measured or to |
|
|||||||||||||||||||||||||||||||
the objectives addressed. Second, the pretreatment |
|
|||||||||||||||||||||||||||||||
applied on measured profiles must be adapted to the |
|
|||||||||||||||||||||||||||||||
required functionality of the surface, since these pre- |
|
|||||||||||||||||||||||||||||||
treatments could remove relevant information from |
|
|||||||||||||||||||||||||||||||
the profiles. Third, the reader is informed that surfaces |
|
|||||||||||||||||||||||||||||||
cannot generally be characterized by only one rough- |
|
|||||||||||||||||||||||||||||||
ness parameter and that the association of amplitude, |
|
|||||||||||||||||||||||||||||||
spacing, and hybrid parameters must be preferred. |
|
|||||||||||||||||||||||||||||||
Finally, it has been shown that a multiscale analysis |
|
|||||||||||||||||||||||||||||||
and the use of expert systems are preferable to |
|
|||||||||||||||||||||||||||||||
determine the best discriminate scale of analysis and |
Fig. 6 Multiscale analysis of a titanium electro-eroded |
|||||||||||||||||||||||||||||||
the best roughness parameter for analysing a specific |
||||||||||||||||||||||||||||||||
surface: two multiscale profiles evaluated at the |
||||||||||||||||||||||||||||||||
functionality. |
|
|
|
|
|
|
|
|
|
|
|
|
|
|
|
|
|
|
|
|
|
|
|
|
|
|
|
scale e 563 mm and e 5210 mm |
||||
Proc. IMechE Vol. 224 Part H: J. Engineering in Medicine |
JEIM900 |
Downloaded from pih.sagepub.com at Universitats-Landesbibliothek on December 20, 2013
Relative influence of surface topography and surface chemistry. Part 1 |
1479 |
|
|
Fig. 7 Relationship between the contact angle and the Ra evaluated at the scale e 563 mm and e 5210 mm (computed from the profile shown in Fig. 6)
3DEFINITION OF SURFACE CHEMISTRY
Performances of implanted materials are intrinsically linked to interactions between biological fluid and surface of the implants. This interaction is often mediated by proteins adsorbed from the biological fluid. Characteristics of the surface in term of roughness, topography, and surface chemistry are then transcribed by the protein layer in information that is comprehensible for the cells [1].
3.1Process
The increase of performance of implants upon cell adhesion or osseointegration can then be tailored by
morphological parameters or surface chemistry. As a consequence, existing treatments of metallic implants can be divided into morphological treatments or surface chemistry modification treatments, the latter being classically subdivided into mineral or organic modification [45]. It is worth noting that a commercial solution often uses a combination of the two to maximize cellular response. Of course, impacting morphology of a metallic surface by physical methods leads in the mean time to huge modification of the chemistry of surfaces. Researchers willing to decorrelate the mechanical parameters from the chemical ones have recourse to replicas [11, 12] or nanometer-sized coatings of noble metals (gold, palladium) to control morphology with a unique chemistry [8]. Processes
JEIM900 |
Proc. IMechE Vol. 224 Part H: J. Engineering in Medicine |
Downloaded from pih.sagepub.com at Universitats-Landesbibliothek on December 20, 2013