

Cardiology / English / Материалы по ЭКГ начало
.pdfElectrocardiography examination:
Algorithm of interpreting ECG. ECG signs of hypertrophy of heart chambers.
Electrophysiological bases of ECG (electrocardiography)
Electrocardiography is a method of graphic recording of electric currents generated in the working heart. Contractions of the heart are preceded by its excitation during which physicochemical properties of cell membranes change along with changes in the ionic composition of the intercellular and intracellular fluid, which is accompanied by generation of electric current.
Electrophysiological functions of heart:
-Automaticity – function of pacemaker cells to produce spontaneously the action potential (transient depolarization);
-Conduction - capability to impulse propagation through cardiac tissues; -Excitability – capability to become excited under the influence of impulses; -Refractoriness is a property of cardiac cells that defines the period of recovery that cells require before they can be reexcited by a stimulus;
-Contractility – capability of myocardium to contract in response to excitement.
Cardiac conduction system
The depolarization stimulus for the normal heartbeat originates in the sinoatrial (SA) node or sinus node, a collection of pacemaker cells. These cells fire spontaneously; that is, they exhibit automaticity. Pacemaker cells exhibit automaticity in all departments of conduction system: I- sinus node (SA), II - AV junction (and atrial fibres) and AV node and His-bundle), III- His-bundle branches, Purkinje fibers.
The first phase of cardiac electrical activation is the spread of the depolarization wave through the right and left atria, followed by atrial contraction. Next, the impulse stimulates pacemaker and specialized conduction tissues in the atrioventricular (AV) nodal and His-bundle areas; together, these two regions constitute the AV junction. The bundle of His bifurcates into two main branches, the right and left bundles, which rapidly transmit depolarization wavefronts to the right and left ventricular myocardium by way of Purkinje fibers. The main left bundle bifurcates into two primary subdivisions, a left anterior fascicle and a left posterior fascicle. The depolarization wave fronts then spread through the ventricular wall, from endocardium to epicardium, triggering ventricular contraction. Ventricular depolarization can be divided into two major phases, each represented by a vector. The first phase denotes depolarization of the ventricular septum, beginning on the left side and spreading to the right. Simultaneous depolarization of the left and right ventricles (LV and RV) constitutes the second phase.
Recording ECG
Twelve-lead ECG recording has gained wide use: three standard leads (classical), six chest, and three augmented unipolar limb leads (Table 7). Special leads are also used in some cases.
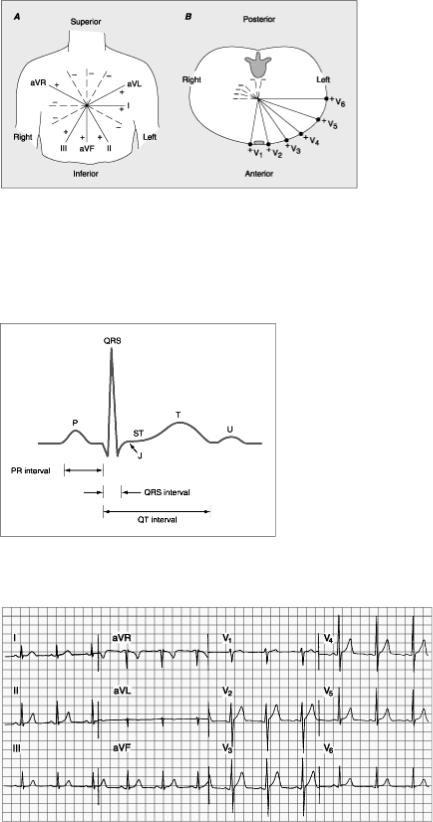
The six frontal plane and six horizontal plane leads provide a three-dimensional representation of cardiac electrical activity. The frontal plane leads - standard and augmented leads. The horizontal plane leads – chest leads.
Table 7 |
|
|
Basic leads of ECG |
Position of an electrode |
Projection of heart |
Leads |
|
chambers |
Standard leads I |
Right arm - left arm |
Anterior wall of left |
|
|
ventricle |
II |
Right arm - left foot |
- |
III |
Left foot - left arm |
Posterior wall of left |
|
|
ventricle and right |
|
|
ventricle |
Augmented |
Left arm |
Anterior wall of left |
leads |
|
ventricle |
aVL |
|
|
aVR |
Right arm |
- |
aVF |
Left foot |
Posterior wall of left |
|
|
ventricle and right |
|
|
ventricle |
Chest leads |
right sternal borderthe |
Anterior wall of right |
V1 |
4th intercostal space |
and left ventricle |
V2 |
left sternal borderthe |
Anterior part of |
|
4th interspace |
interventricular septum |
V3 |
between V2 and V4 |
Anterior wall of left |
|
|
ventricle to apex |
V4 |
left midclavicular line – |
Apex of left ventricle |
|
the 5th interspace |
|
V5 |
left anterior axillary |
Side wall of left |
|
line – the 5th interspace |
ventricle |
V6 |
left midaxillary line – |
Side wall of left |
|
the 5th interspace |
ventricle |
In normal conditions, the cardiac cycle begins with excitation of the atria (P wave on an ECG). The ascending portion of the P wave is mainly due to excitation of the right atrium, while the descending one of the left atrium. The wave is small, and its normal amplitude does not exceed 1-2 mm; the length is 0.08-0.1 s. The P wave is followed by a straight line lasting to Q wave; if this wave is small, the line extends to the R wave. This is the P-Q interval. It extends from the beginning of the P wave to the beginning of the Q (or R) wave and corresponds to the time from the beginning of atrial excitation to the beginning of ventricular excitation, i.e. includes the time of
pulse propagation in the atria and its physiological delay in the atrioventricular node. The normal length of the P-Q interval is 0.12-0.18 s (to 0.20 s).
Excitation of the ventricles corresponds to the QRS complex. Its waves vary in size and are different in various leads. The length of the QRS complex (measured from the beginning of the Q wave to the end of the 5 wave) is 0.06—0.1 s. This is the time of intraventricular conduction. The first wave of this complex is the negative Q wave. It corresponds to excitation of the interventricular septum. Its amplitude is small and does not normally exceed 1A amplitude of the R wave; the length of the Q wave does not exceed 0.03 s. The Q wave may be absent on an ECG. The R wave corresponds to almost complete excitation of both ventricles. It is the highest wave of the ventricular complex; its amplitude varies from 5 to 15 mm. The negative 5 wave is recorded in full excitation of the ventricles; usually it is not high, actually not exceeding 6 mm (2.5 mm on the average). Sometimes the 5 wave is very small. At the moment of complete depolarization of the myocardium, the potential difference is absent and the ECG is therefore a straight line (the S-T interval.) The length of this interval varies greatly depending on the cardiac rhythm; the S-T interval may be displaced from the isoelectric line to not more than 1 mm.
The T wave corresponds to the repolarization of the ventricular myocardium. The T wave is normally asymmetrical: the gradual ascent converts into a rounded summit, which is followed by an abrupt descent. Its amplitude varies from 2.5 to 6 mm, the length from 0.12 to 0.16 s. A small positive U wave sometimes follows the T wave in 0.02—0.04 s. Its amplitude exceeds 1 mm in rare cases: the length is 0.09—0.16 s. The origin of the U wave is disputed.
The Q-T interval (QRST complex) shows the time of excitation and recovery of the ventricular myocardium i.e. it corresponds to their electrical system. It extends from the beginning of the Q wave (or the R wave, if the Q wave is absent) to the end of the T wave. Its length depends on the rate of cardiac contractions: in accelerated heart rhythm the Q-T interval shortens. The Q-T interval in women is longer than in men (at the same heart rate). For example, at the rate of 60-80 beats per minute, the length of the Q-T interval in men is 0.32-0.37 s and in women— 0.35-0.40 s.
The T-P interval (from the end of the T to the beginning of the P wave) corresponds to the electrical diastole of the heart. It is located on the isoelectric line because all action currents are absent at this moment. Its length depends on the cardiac rhythm: the faster the heart rate the shorter the T-P interval.
The R-R interval is a distance between the summits of two neighbouring R waves. It corresponds to the time of one cardiac cycle, whose length depends on the cardiac rhythm as well.
Interpretation of ECG
In the beginning of interpretation of ECG technical conditions of tape recording must be defined (voltage of the ECG and speed of a tape). The ECG graph paper records the time (interval) between cardiac electrical events along the horizontal axis and their amplitude (voltage) along the vertical axis (Fig. Suppl. 4). . It is
important for correct estimation of heart rate, amplitude and duration of ECG waves and intervals (Fig. Suppl. 4).
The sequence of ECG analysis:
1.Voltage of the ECG is estimated in compliance with standard size of 1 mv =10 mm. To that end, the amplitude of R waves is measured in standard leads. Normal amplitude is 5- 15 mm. If the amplitude of the highest R wave does not exceed 5 mm in standard leads, or the sum of amplitudes of these waves in all three leads is less than 15 mm, the ECG voltage is considered decreased.
2.Speed of tape. If speed of tape is 50 mm/min – 0.02 s in 1 mm of tape (width of QRS=3-4 mm). If speed of tape 25 mm/min – 0.04 s in 1 mm of tape (width of QRS=1-2 mm).
3.Regularity and pacemaker of the cardiac rhythm.
Since the sinoatrial node is the pacemaker of a normal heart, and the excitation of the ventricles is preceded by excitation of the atria, the P wave should come before the ventricular complex. The R-R intervals should be equal. Its fluctuations normally do not exceed 0.1 s. Greater variations in the length of the R-R intervals indicate disordered cardiac rhythm.
Sinus rhythm signs - Р-wave positive in II standard lead and corresponds (previous) to complexes QRS.
4. Heart rate (HR)
60 (seconds in 1 minutes) _____________
[R-R] (in seconds, i.e. to - in divisions х 0.02)
To that end, duration of one cardiac cycle (the R-R interval) and the number of such cycles in one minute length should be determined. For example, if one cycle lasts 0.8 s, there will be 75 such cycles in a minute (60 : 0.8 = 75). If the cardiac rhythm is irregular, the length of five or ten R-R intervals is determined, the mean R-R interval found, and the cardiac rate is finally determined as for regular cardiac rhythm. Lengths of the maximum and minimum R-R intervals are given in parentheses. Other variant of HR determination - multiply in 20 times (×20) the number of R-R intervals during 3 seconds (Fig. Suppl. 5).
5.Analysis of myocardial conduction depending duration of:
- P wave (≤0.10-0.12 s)– intraatrial conduction;
- PQ interval (0.12-0.20 s) – conduction in atrioventricular node; - QRS complex (0.06-0.10 s) - intraventricular conduction.
6.The position of the electrical axis of heart changes with changes of the position of the heart in the chest. The relation between the electrical axis and the magnitude of the QRS complexes in standard leads is described by the so-called Einthoven triangle. The electrical axis of the heart is determined by the shape of ventricular complexes in standard leads:
- normal electrical axis - RII> RI> RIII;
- horisontal electrical axis (levogram)- RI> RII> RIII; - vertical electrical axis (dextrogram) - RIII> RII> RI.
7.Analysis of waves and intervals. The length and size of ECG elements (P wave, R-Q interval and QRST complexes) are then determined in those leads where the waves are the largest (usually in lead II). Moreover, the direction of the P and T
waves is determined (they can be positive and negative). Smaller and split waves can be present as well. Additional waves can appear. The shape of the ventricular complex in all leads is thoroughly examined, character of the S-T interval is noted (see Table 9-2). The length of the QRST complex (Q-T interval) depends on rate: the higher the rate, the shorter the interval.
The ECG of healthy persons depend on their age and constitution, on the posture at the moment of taking an ECG (sitting, lying), on the preceding exercise, etc. ECG may change during deep breathing (the position of the heart in the chest is changed during deep inspiration and expiration), in increased tone of the sympathetic and parasympathetic nervous systems and in some other conditions.
It is difficult to overestimate the clinical importance of electrocar-diography. It is used to reveal disorders of heart activity, enlargement of heart chambers and to diagnose coronary circulatory disorders.
ECG in hypertrophy of atriums
Hypertrophy of auricles is determined by changes of P-wave.
Left atrium hypertrophy is detected by “P mitrale”: wide (>0.1 s), splitted Р-wave in I, II, AVL, left chest leads (V5-6); flat or negative Р in III, biphasic or negative (>1 mm) Р V1 (Fig. Suppl. 6). Left atrium hypertrophy is typical in mitral valves diseases (mitral stenosis and mitral incompetence).
Right atrium hypertrophy is detected by “P pulmonale”: high (>2.5 mm) acute Р in II, III, AVF and right chest leads (V1-2). Right atrium hypertrophy is typical in chronic pulmonary diseases (pulmonary heart) and tricuspid valves incompetence.
ECG in hypertrophy of ventricles
Hypertrophy of ventricles is determined mainly by changes of ventricular complex QRS (Fig. Suppl. 7). Ventricular hypertrophy causes the following changes in ECG:
(I) the position of the electrical axis is changed: in left-ventricular hypertrophy - levogram,
in right-ventricular hypertrophy dextogram;
(2)the amplitude of the ventricular complex and its length increase,
(3)changed terminal part of the ventricular complex of the ECG because of repolarization abnormalities:
ST-segment depression and T-wave inversion in leads with a prominent R wave;
(4)in left-ventricular hypertrophy -
amplitude of the S wave increases in V1-2;
amplitude of the R wave increases >20-25 mm in V4-6 sum of amplitude SV1 + RV5 (or RV6)≥35 mm;
(5) In right-ventricular hypertrophy the changes in the S and R waves are the reverse:
high R wave ≥ 7 mm appears in V1-2, deep S wave in V4-6 .
Electrocardiography examination
1.The six frontal plane and six horizontal plane leads provide a three-dimensional represent electrical activity. The frontal plane leads – standard (I, II, III) and augmented leads (aVR, horizontal plane leads – chest leads (V1-6).
Fig. Suppl.
Basic waves and intervals of normal ECG.
3. Normal ECG of the healthy subject. Sinus rhythm is present with a heart rate of 75 per minute. PR interval is 0.16 s; QRS interval (duration) is 0.08 s; QT interval is 0.36 s; the mean QRS axis is about +70°, transition zone V3.
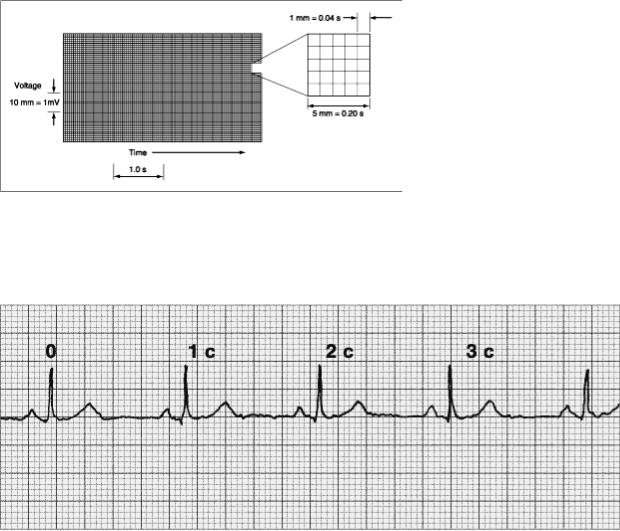
4. The ECG graph paper records the time (interval) between cardiac electrical events along the horizontal axis and their amplitude (voltage) along the vertical axis.
5. HR determination - multiply in 20 times (×20) the number of R-R intervals during 3 seconds.
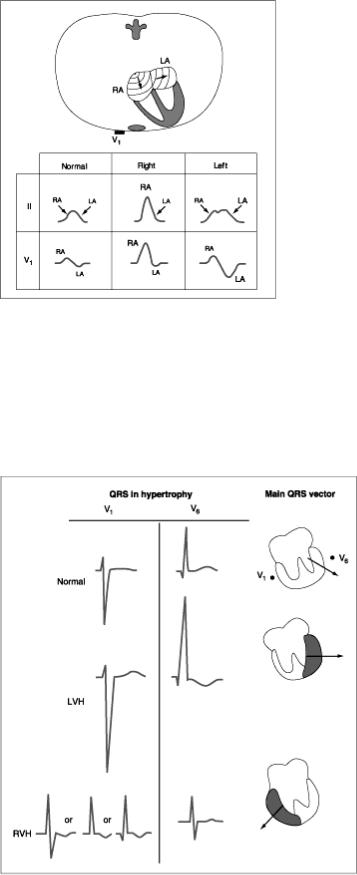
6. ECG in hypertrophy of atriums.
Right atrium hypertrophy is detected by “P pulmonale”: high (>2.5 mm) acute
Р in II, III, AVF and right chest leads (V1-2).
Left atrium hypertrophy is detected by “P mitrale”: wide (>0.1 s), splitted Р- wave in I, II, AVL, V5-6; flat or negative Р in III, biphasic or negative Р (>1 mm) V1.
7. ECG in hypertrophy of ventricles.
Left-ventricular hypertrophy (LVH) - amplitude of the S increases in V1-2; amplitude of the R increases >2025 mm in V4-6.
Right-ventricular hypertrophy (RVH) the changes in the S and R waves are the reverse - high R wave ≥ 7 mm in V1-2, deep S wave in V4-6 .
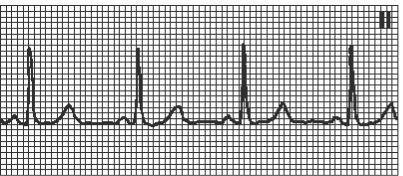
Normal sinus rhythm.
HR=60-80 in min, P(+) I, II, aVF, (-) aVR, PQ
≥0,12s