


256 |
C.I. Smith et al. |
pore size distribution and specific surface area can be calculated by knowing the volume of nitrogen adsorbed and its relative pressure. Using this technique we were able to measure the BET Surface Area m2/g and the pore volume (cm3/g) contained in pores of 0.001–0.1 μm diameters. Further descriptions of the technique and its application to bone porosity measurements can be found in Robinson et al. (2003) and Smith et al. (2008).
Following the non-destructive nitrogen adsorption isotherm analysis, mercury intrusion porosity analysis was carried out. No additional pre-treatment was required other than maintaining dry storage of the samples. A Micromeritics 9320 Poresizer was used for mercury intrusion porosimetry analysis, the volume of mercury intruded was measured following a customized pressure table from 0 to 30 000 Psi (0–2000 MPa). Mercury intrusion porosimetry has been used extensively to investigate bone diagenetic changes and details of the method can be found in Nielsen-Marsh and
Hedges (1999), Smith et al. (2002, 2008), among others. Calculations were made using a mercury-apatite contact angle of 163.1º after Joscheck et al. (2000), and a mercury surface tension of 485 dyn/cm. The analysis produces bulk density values (density including pore space) and apparent (skeletal) density (density of the structure excluding pore space). The pore size distribution can be calculated indicating the volume of pore space within certain pore diameters. Table 11.1 gives the values for certain pore diameter ranges relevant to bone diagenesis after Smith et al. (2007).
Results and Discussion
The diagenetic parameter results can be seen in Tables 11.1 and 11.2. Diagenetic changes to bone can be compared with the typical values of modern bone in the tables.
Table 11.1 Surface modifications, collagen and mineral diagenetic parameter values of fossil bones from Azokh Cave
Sample code |
Site |
Skeletal element |
% |
% |
C:N ratio |
Crystallinity |
Carbonate: |
|
|
|
Collagen |
Collagen |
of |
index (IRSF) |
phosphate |
|
|
|
(mean) |
(s.d.) |
‘collagen’ |
|
ratio (by |
|
|
|
|
|
|
|
IRSF) |
Typical modern values |
|
|
|
|
|
|
|
Typical modern |
N/A |
N/A |
20–25% |
2.0 |
3.2 |
2.8 |
0.40 |
bone |
|
|
|
|
|
|
|
Azokh 1 Units AZUM D46 181 |
Azokh 1 Units II–III |
Calcaneous Ursus |
0.0 |
N/A |
|
3.4 |
0.30 |
II–III |
|
spelaeus (no apparent |
|
|
|
|
|
|
|
damage on surface) |
|
|
|
|
|
AZUM D46 2 |
Azokh 1 Units II–III |
Long bone fragment |
31.8 |
10.8 |
6.3 |
3.4 |
0.19 |
AZUM D46 3 |
Azokh 1 Units II–III |
Long bone fragment |
0.1 |
0.4 |
|
4.3 |
0.03 |
AZUM D45 25 |
Azokh 1 Units II–III |
Radius Ursus |
0.8 |
0.3 |
|
3.6 |
0.25 |
|
|
spelaeus |
|
|
|
|
|
AZUM D45 4 |
Azokh 1 Units II–III |
Long bone fragment |
0.4 |
0.1 |
|
3.9 |
0.20 |
AZUM D45 42 |
Azokh 1 Units II–III |
Radius Ursus |
0.2 |
0.0 |
|
2.9 |
0.47 |
|
|
spelaeus (Mn deposit |
|
|
|
|
|
|
|
on fractures and |
|
|
|
|
|
|
|
bone/sediment |
|
|
|
|
|
|
|
surface) |
|
|
|
|
|
AZUM D45 9 |
Azokh 1 Units II–III |
Calcaneous Ursus |
2.1 |
0.4 |
7.0 |
3.3 |
0.51 |
|
|
spelaeus |
|
|
|
|
|
AZUM-D46G |
Azokh 1 Units II–III |
Several fragments of |
0.6 |
0.4 |
|
3.0 |
0.38 |
|
|
various bones [Mn |
|
|
|
|
|
|
|
staining/carbonatic |
|
|
|
|
|
|
|
crust] |
|
|
|
|
|
AZUM-D46G 27 A |
Azokh 1 Units II–III |
Several fragments of |
2.4 |
0.1 |
6.3 |
3.0 |
0.33 |
|
|
various bones [Mn |
|
|
|
|
|
|
|
staining/carbonatic |
|
|
|
|
|
|
|
crust] |
|
|
|
|
|
AZUM-D46G 27 B |
Azokh 1 Units II–III |
Fragments |
1.4 |
0.0 |
5.9 |
3.5 |
0.25 |
AZUM-D46G 19-A |
Azokh 1 Units II–III |
Several fragments of |
1.4 |
0.9 |
8.7 |
3.0 |
0.33 |
|
|
various bones many |
|
|
|
|
|
|
|
3–5 cm long [Mn |
|
|
|
|
|
|
|
staining and |
|
|
|
|
|
|
|
trampling] |
|
|
|
|
|
AZUM-D46G 19-B |
Azokh 1 Units II–III |
Fragments [trampling |
0.1 |
0.1 |
|
3.4 |
0.28 |
|
|
marks] |
|
|
|
|
|
AZUM-D46G 19-C |
Azokh 1 Units II–III |
Fragments |
0.0 |
0.0 |
|
3.3 |
0.24 |
AZUM-D46G 19-D |
Azokh 1 Units II–III |
Fragments |
2.6 |
1.4 |
7.0 |
3.5 |
0.24 |
|
|
[trampling, rounding, |
|
|
|
|
|
|
|
Mn staining] |
|
|
|
|
|
(continued)
11 Bone Diagenesis at Azokh Caves |
|
|
|
|
|
257 |
||
Table 11.1 (continued) |
|
|
|
|
|
|
|
|
|
|
|
|
|
|
|
|
|
|
Sample code |
Site |
Skeletal element |
% |
% |
C:N ratio |
Crystallinity |
Carbonate: |
|
|
|
|
Collagen |
Collagen |
of |
index (IRSF) |
phosphate |
|
|
|
|
(mean) |
(s.d.) |
‘collagen’ |
|
ratio (by |
|
|
|
|
|
|
|
|
IRSF) |
Azokh 1 Unit |
AZU-Section |
Azokh 1 Unit Vu |
Long bone fragment |
0.0 |
0.3 |
|
3.5 |
0.26 |
Vu |
|
|
[black staining, |
|
|
|
|
|
|
|
|
mainly trabecular |
|
|
|
|
|
|
|
|
bone] |
|
|
|
|
|
Azokh 1 Unit |
AZM E39 1 |
Azokh 1 Unit Vm |
Long bone fragment |
0.9 |
0.5 |
6.1 |
3.4 |
0.20 |
Vm |
AZM E41 4 |
Azokh 1 Unit Vm |
Long bone fragment |
0.5 |
0.1 |
|
3.6 |
0.20 |
|
AZM-E40G |
Azokh 1 Unit Vm |
Fragments [fibrous |
0.7 |
0.2 |
6.1 |
3.3 |
0.23 |
|
|
|
texture] |
|
|
|
|
|
|
AZM-E41G |
Azokh 1 Unit Vm |
Fragment of |
|
|
|
|
|
|
|
|
Mandible(?) [splitting |
|
|
|
|
|
|
|
|
and exfoliation on |
|
|
|
|
|
|
|
|
surface] |
|
|
|
|
|
|
AZM-F42 9 |
Azokh 1 Unit Vm |
Long bone (fragment) |
0.6 |
0.3 |
|
3.9 |
0.17 |
|
|
|
[heavily mineralized, |
|
|
|
|
|
|
|
|
fibrous surface] |
|
|
|
|
|
|
AZM-G41 5 |
Azokh 1 Unit Vm |
Fragments |
0.5 |
0.2 |
|
3.9 |
0.18 |
Azokh 2 |
AZN P11 |
Azokh 2 |
|
16.9 |
1.3 |
3.3 |
3.8 |
0.25 |
|
AZN-Q10 |
Azokh 2 |
Long bone [modern |
7.5 |
0.8 |
3.3 |
2.9 |
0.43 |
|
|
|
root marking, shallow |
|
|
|
|
|
|
|
|
trampling marks] |
|
|
|
|
|
|
AZN-SL-HDU |
Azokh 2 |
Metapodial [some |
23.1 |
0.2 |
3.2 |
3.7 |
0.36 |
|
|
|
skin still present, cut |
|
|
|
|
|
|
|
|
marks, one side |
|
|
|
|
|
|
|
|
weathered, the |
|
|
|
|
|
|
|
|
other not] |
|
|
|
|
|
|
AZN-SL-HWU |
Azokh 2 |
Metapodial [surface |
18.7 |
0.0 |
3.2 |
3.3 |
0.32 |
|
|
|
corroded] |
|
|
|
|
|
|
AZN-SL-HDW |
Azokh 2 |
Metapodial |
21.7 |
0.1 |
3.2 |
3.4 |
0.31 |
|
|
|
[moderately |
|
|
|
|
|
|
|
|
weathered, cracked |
|
|
|
|
|
|
|
|
surface] |
|
|
|
|
|
|
AZN-SL-HWW |
Azokh 2 |
Metapodial |
21.4 |
0.4 |
3.2 |
3.4 |
0.28 |
|
AZN-SL-A |
Azokh 2 |
Fragments [root |
0.9 |
0.1 |
|
3.4 |
0.34 |
|
|
|
marks] |
|
|
|
|
|
|
AZN-SL-B |
Azokh 2 |
Epifysis [spots of |
2.6 |
0.1 |
7.1 |
3.5 |
0.32 |
|
|
|
gypsum and Mn |
|
|
|
|
|
|
|
|
stains] |
|
|
|
|
|
|
AZN-SL-C |
Azokh 2 |
|
0.3 |
0.1 |
|
3.7 |
0.27 |
|
AZN-SL-D |
Azokh 2 |
Tibia/Fibia proximal |
0.1 |
0.1 |
|
3.4 |
0.30 |
|
|
|
end (?) epifysis |
|
|
|
|
|
|
|
|
[heavily mineralized |
|
|
|
|
|
|
|
|
corroded surface] |
|
|
|
|
|
|
AZN-SL-F |
Azokh 2 |
Fragments of long |
0.8 |
0.1 |
|
3.4 |
0.31 |
|
|
|
bone [heavily |
|
|
|
|
|
|
|
|
mineralized, root |
|
|
|
|
|
|
|
|
marks] |
|
|
|
|
|
|
AZN-SL-G |
Azokh 2 |
Fragments of long |
0.3 |
0.1 |
|
3.4 |
0.28 |
|
|
|
bone |
|
|
|
|
|
Azokh 1 Units II–III
Units II–III at Azokh 1 are represented by heavily degraded bone, with low levels of organic preservation (none of which displays a collagen like C:N ratio (see DeNiro 1985)) and with the exception of a few samples can be characterized as having highly altered mineral (IRSF values are typically 3.4
or above and C:P values typically less than 0.3). It should be noted that a critical error appears to have occurred in the collagen extraction from sample AZUM-D46-2 that had two disparate values from the duplicate analysis, so this value should be ignored, as it is unreliable. The histological preservation varies in these deposits with some bones showing signs of extensive microbial attack (Histological

Table 11.2 Histological and Porosity values of fossil bones from Azokh Caves
Sample code |
Site |
Oxford Histological Index and |
BET Surface |
Volume |
Volume |
Volume (ml/ml) in |
Volume |
Total |
Bulk |
Skeletal |
|
|
Histology notes |
Area m2/g |
(cm3/g) |
(ml/ml) in |
pores <10 >0.1 μm |
(ml/ml) in |
Porosity |
Density |
Density |
|
|
|
(by N2 |
between |
pores <0.1 μm |
(Hg porosity) |
pores >10 μm |
(ml/ml) |
g/ml |
g/ml |
|
|
|
Porosimetry) |
0.001 and |
(Hg porosity) |
|
(Hg porosity) |
(Hg |
(Hg |
(Hg |
|
|
|
|
0.1 μm |
|
|
|
porosity) |
porosity) |
porosity) |
|
|
|
|
(N2 |
|
|
|
|
|
|
|
|
|
|
porosity) |
|
|
|
|
|
|
Typical modern values |
|
|
|
|
|
|
|
|
|
|
Typical Modern |
N/A |
OHI 5 |
0.2–1.4 |
0.002– |
0.05 |
0.02 |
0.0200 |
0.0900 |
1.90 |
2.10 |
Bone |
|
|
|
0.008 |
|
|
|
|
|
|
Azokh 1 Units II–III |
|
|
|
|
|
|
|
|
|
|
AZUM D46 |
Azokh 1 |
OHI 5 |
101.4 |
0.2123 |
0.1791 |
0.0052 |
0.1472 |
0.3314 |
1.61 |
2.41 |
181 |
Units II–III Microfissures, most infilled by Mn. |
|
|
|
|
|
|
|
|
|
|
|
Sediment illite |
|
|
|
|
|
|
|
|
AZUM D46 2 |
Azokh 1 |
|
23.0 |
0.0993 |
0.1185 |
0.2710 |
0.0652 |
0.4547 |
1.01 |
1.85 |
|
Units II–III |
|
|
|
|
|
|
|
|
|
AZUM D46 3 |
Azokh 1 |
OHI 5 |
89.3 |
0.2880 |
0.3633 |
0.0417 |
0.0382 |
0.4432 |
1.28 |
2.29 |
|
Units II–III Intense cracking. Abundant |
|
|
|
|
|
|
|
|
|
|
|
secondary osteons (pathology?) |
|
|
|
|
|
|
|
|
|
|
Canals filled by sediment |
|
|
|
|
|
|
|
|
AZUM D45 25 |
Azokh 1 |
OHI 5 |
77.5 |
0.1964 |
0.2251 |
0.0225 |
0.0481 |
0.2957 |
1.63 |
2.31 |
|
Units II–III Enlarged canaliculi, possibly |
|
|
|
|
|
|
|
|
|
|
|
mineralised by Mn |
|
|
|
|
|
|
|
|
AZUM D45 4 |
Azokh 1 |
OHI 0 |
35.6 |
0.1133 |
0.1445 |
0.2518 |
0.0601 |
0.4564 |
1.39 |
2.56 |
|
Units II–III Areas of organised and areas of |
|
|
|
|
|
|
|
|
|
|
|
chaotic bacterial attack all over. |
|
|
|
|
|
|
|
|
|
|
Radial and peripheral tubes on |
|
|
|
|
|
|
|
|
|
|
bacterial corroded areas (fungi?) |
|
|
|
|
|
|
|
|
AZUM D45 42 |
Azokh 1 |
OHI 4 |
87.5 |
0.1958 |
0.2222 |
0.0072 |
0.0225 |
0.2519 |
1.74 |
2.33 |
|
Units II–III Initial bacterial attack. Canals |
|
|
|
|
|
|
|
|
|
|
|
infilled by illite rich in carbonates, |
|
|
|
|
|
|
|
|
|
|
and also sulphur detected? gypsum? |
|
|
|
|
|
|
|
|
|
|
Ca(SO4) · 2(H2O) |
|
|
|
|
|
|
|
|
AZUM D45 9 |
Azokh 1 |
OHI 5 |
65.4 |
0.1290 |
0.1153 |
0.0524 |
0.1025 |
0.2702 |
1.73 |
2.37 |
|
Units II–III Some osteones are infilled |
|
|
|
|
|
|
|
|
|
|
|
carbonatic minerals (calcite) and |
|
|
|
|
|
|
|
|
|
|
minerals enriched in phosphorous |
|
|
|
|
|
|
|
|
|
|
and sulphur related to bat guano |
|
|
|
|
|
|
|
|
|
|
breakdown. Corrosion of the cortical |
|
|
|
|
|
|
|
|
|
|
area |
|
|
|
|
|
|
|
|
AZUM-D46G |
Azokh 1 |
OHI 5 |
84.7 |
0.1715 |
0.1945 |
0.0075 |
0.0274 |
0.2294 |
1.92 |
2.49 |
|
Units II–III Canals partially infilled clayish |
|
|
|
|
|
|
|
|
|
|
|
sediment rich in phosphorous |
|
|
|
|
|
|
|
|
(continued)
258
.al et Smith .I.C
Table 11.2 (continued)
Sample code |
Site |
Oxford Histological Index and |
BET Surface |
Volume |
Volume |
Volume (ml/ml) in |
Volume |
Total |
Bulk |
Skeletal |
|
|
Histology notes |
Area m2/g |
(cm3/g) |
(ml/ml) in |
pores <10 >0.1 μm |
(ml/ml) in |
Porosity |
Density |
Density |
|
|
|
(by N2 |
between |
pores <0.1 μm |
(Hg porosity) |
pores >10 μm |
(ml/ml) |
g/ml |
g/ml |
|
|
|
Porosimetry) |
0.001 and |
(Hg porosity) |
|
(Hg porosity) |
(Hg |
(Hg |
(Hg |
|
|
|
|
0.1 μm |
|
|
|
porosity) |
porosity) |
porosity) |
|
|
|
|
(N2 |
|
|
|
|
|
|
|
|
|
|
porosity) |
|
|
|
|
|
|
AZUM-D46G |
Azokh 1 |
OHI 5 |
80.6 |
0.1752 |
|
|
|
|
|
|
27 A |
Units II–III |
Porous bone with good histology. |
|
|
|
|
|
|
|
|
|
|
Mn infilling osteocites, also Ni has |
|
|
|
|
|
|
|
|
|
|
been detected with Mn(EDS) |
|
|
|
|
|
|
|
|
AZUM-D46G |
Azokh 1 |
OHI 5 |
76.9 |
0.1529 |
|
|
|
|
|
|
27 B |
Units II–III |
Porous bone, osteocytes and small |
|
|
|
|
|
|
|
|
|
|
cracks infilled with Mn (EDS) |
|
|
|
|
|
|
|
|
AZUM-D46G |
Azokh 1 |
OHI 5 |
54.8 |
0.0705 |
0.0324 |
0.0042 |
0.0475 |
0.0841 |
2.22 |
2.42 |
19-A |
Units II–III |
Porous bone though good histology. |
|
|
|
|
|
|
|
|
|
|
EDS sediment Illite |
|
|
|
|
|
|
|
|
AZUM-D46G |
Azokh 1 |
OHI 0 |
33.7 |
0.0897 |
0.1235 |
0.0125 |
0.0288 |
0.1648 |
2.01 |
2.41 |
19-B |
Units II–III |
Bacterial MFD surround Haversian |
|
|
|
|
|
|
|
|
|
|
canals at the outer cortical layer |
|
|
|
|
|
|
|
|
|
|
chaotic distribution. Radial and |
|
|
|
|
|
|
|
|
|
|
peripheral microtunnelling |
|
|
|
|
|
|
|
|
AZUM-D46G |
Azokh 1 |
OHI 0 |
36.6 |
0.0933 |
0.0883 |
0.0034 |
0.0171 |
0.1088 |
2.14 |
2.40 |
19-C |
Units II–III |
Similar to B, microtunnelling |
|
|
|
|
|
|
|
|
|
|
damaging bacterial attack (fungi?), |
|
|
|
|
|
|
|
|
|
|
peripherally dispersed |
|
|
|
|
|
|
|
|
AZUM-D46G |
Azokh 1 |
OHI 2 |
48.6 |
0.0647 |
0.0416 |
0.0127 |
0.0552 |
0.1096 |
2.31 |
2.60 |
19-D |
Units II–III |
Histological traits partially |
|
|
|
|
|
|
|
|
|
|
disappear, radial distribution of |
|
|
|
|
|
|
|
|
|
|
small tubes, fungi? from Haversian |
|
|
|
|
|
|
|
|
|
|
canals. EDS Barium sulfate (Barite), |
|
|
|
|
|
|
|
|
|
|
and illite (sediment). Enlarged |
|
|
|
|
|
|
|
|
|
|
canaliculi, mineralised |
|
|
|
|
|
|
|
|
Azokh 1 Unit Vu |
|
|
|
|
|
|
|
|
|
|
AZU-Section |
Azokh 1 |
OHI 5 |
80.7 |
0.2268 |
0.2674 |
0.0124 |
0.0435 |
0.3233 |
1.44 |
2.13 |
|
Unit Vu |
Some canals infilled with clayish |
|
|
|
|
|
|
|
|
|
|
sediment rich in phosphorous |
|
|
|
|
|
|
|
|
AZM E 39 1 |
Azokh 1 |
OHI 5 |
31.6 |
0.0378 |
|
|
|
|
|
|
|
Unit Vm |
Mineralized osteons. Sediment |
|
|
|
|
|
|
|
|
|
|
(illite), manganese, Sn and Ti are |
|
|
|
|
|
|
|
|
|
|
also present. Mineral “acicular” |
|
|
|
|
|
|
|
|
|
|
shape with illites, Mn and unknown |
|
|
|
|
|
|
|
|
|
|
minerals with Zn, Ni. (EDS) |
|
|
|
|
|
|
|
|
(continued)
Caves Azokh at Diagenesis Bone 11
259

Table 11.2 (continued)
Sample code |
Site |
Oxford Histological Index and |
BET Surface |
Volume |
Volume |
Volume (ml/ml) in |
Volume |
Total |
Bulk |
Skeletal |
|
|
Histology notes |
Area m2/g |
(cm3/g) |
(ml/ml) in |
pores <10 >0.1 μm |
(ml/ml) in |
Porosity |
Density |
Density |
|
|
|
(by N2 |
between |
pores <0.1 μm |
(Hg porosity) |
pores >10 μm |
(ml/ml) |
g/ml |
g/ml |
|
|
|
Porosimetry) |
0.001 and |
(Hg porosity) |
|
(Hg porosity) |
(Hg |
(Hg |
(Hg |
|
|
|
|
0.1 μm |
|
|
|
porosity) |
porosity) |
porosity) |
|
|
|
|
(N2 |
|
|
|
|
|
|
|
|
|
|
porosity) |
|
|
|
|
|
|
AZM E41 4 |
Azokh 1 |
OHI 5 |
33.3 |
0.0437 |
0.0104 |
0.0005 |
0.0153 |
0.0262 |
2.47 |
2.53 |
|
Unit Vm |
Strong cracking on the outer and |
|
|
|
|
|
|
|
|
|
|
inner cortical area. Enlarged |
|
|
|
|
|
|
|
|
|
|
canaliculi |
|
|
|
|
|
|
|
|
AZM-E40G |
Azokh 1 |
OHI 4–5 |
55.8 |
0.0687 |
0.0254 |
0.0089 |
0.0186 |
0.0529 |
2.33 |
2.46 |
|
Unit Vm |
Good histology except in a lateral |
|
|
|
|
|
|
|
|
|
|
side that has localized corrosion and |
|
|
|
|
|
|
|
|
|
|
enlarged canaliculi |
|
|
|
|
|
|
|
|
AZM-E41G |
Azokh 1 |
OHI 5 |
30.7 |
0.0376 |
0.0000 |
0.0000 |
0.0694 |
0.0694 |
2.11 |
2.27 |
|
Unit Vm |
ESEM surface of rounded holes, of |
|
|
|
|
|
|
|
|
|
|
unknown cause. Nodules of Si |
|
|
|
|
|
|
|
|
|
|
(EDS). Heavily cracked |
|
|
|
|
|
|
|
|
AZM-F42 9 |
Azokh 1 |
OHI 5 |
4.2 |
0.0074 |
0.0000 |
0.0000 |
0.0515 |
0.0515 |
3.08 |
3.25 |
|
Unit Vm |
Haversian canals are infilled with |
|
|
|
|
|
|
|
|
|
|
secondary minerals of apatite. |
|
|
|
|
|
|
|
|
|
|
Enlarged canaliculi |
|
|
|
|
|
|
|
|
AZM-G41 5 |
Azokh 1 |
OHI 4–5 |
36.7 |
0.0461 |
0.0244 |
0.0378 |
0.0683 |
0.1305 |
2.44 |
2.80 |
|
Unit Vm |
Some strong and localized cracking, |
|
|
|
|
|
|
|
|
|
|
mainly at the outer cortical area, |
|
|
|
|
|
|
|
|
|
|
unknown origin, maybe mineral |
|
|
|
|
|
|
|
|
|
|
loss, Sediment illites and Mn |
|
|
|
|
|
|
|
|
|
|
Enlarged canaliculi on cortical |
|
|
|
|
|
|
|
|
Azokh 2 |
|
|
|
|
|
|
|
|
|
|
AZN P11 |
Azokh 2 |
OHI 0 |
22.1 |
0.0678 |
0.0927 |
0.1515 |
0.1159 |
0.3602 |
1.30 |
2.05 |
|
|
Chaotic distribution of bacterail |
|
|
|
|
|
|
|
|
|
|
attack. Slightly enlarged canaliculi |
|
|
|
|
|
|
|
|
AZN-Q10 |
Azokh 2 |
|
18.6 |
0.0486 |
0.0714 |
0.0108 |
0.0173 |
0.0994 |
1.76 |
1.96 |
AZN-SL-HDU |
Azokh 2 |
Surface analysis, bacterial attack |
0.6 |
0.0026 |
0.0155 |
0.0239 |
0.0000 |
0.0393 |
1.91 |
1.99 |
|
|
apparent |
|
|
|
|
|
|
|
|
AZN-SL-HWU |
Azokh 2 |
OHI 4 |
0.1 |
0.0012 |
0.0000 |
0.0000 |
0.0503 |
0.0503 |
2.13 |
2.24 |
|
|
Bacterial attack on the outer cortical, |
|
|
|
|
|
|
|
|
very incipient. Deep cracks < 2 mm deep. Enlarged canaliculi
(continued)
260
.al et Smith .I.C

Table 11.2 (continued)
Sample code |
Site |
Oxford Histological Index and |
BET Surface |
Volume |
Volume |
Volume (ml/ml) in |
Volume |
Total |
Bulk |
Skeletal |
|
|
Histology notes |
Area m2/g |
(cm3/g) |
(ml/ml) in |
pores <10 >0.1 μm |
(ml/ml) in |
Porosity |
Density |
Density |
|
|
|
(by N2 |
between |
pores <0.1 μm |
(Hg porosity) |
pores >10 μm |
(ml/ml) |
g/ml |
g/ml |
|
|
|
Porosimetry) |
0.001 and |
(Hg porosity) |
|
(Hg porosity) |
(Hg |
(Hg |
(Hg |
|
|
|
|
0.1 μm |
|
|
|
porosity) |
porosity) |
porosity) |
|
|
|
|
(N2 |
|
|
|
|
|
|
|
|
|
|
porosity) |
|
|
|
|
|
|
AZN-SL-HDW |
Azokh 2 |
OHI 5 |
1.9 |
0.0097 |
0.0303 |
0.0230 |
0.0746 |
0.1279 |
1.95 |
2.24 |
|
|
Deep cracking >2 mm deep of |
|
|
|
|
|
|
|
|
|
|
weathering. Wedl tunneling |
|
|
|
|
|
|
|
|
|
|
dispersed. Most lacunae infilled |
|
|
|
|
|
|
|
|
AZN-SL-HWW |
Azokh 2 |
|
4.6 |
0.0134 |
0.0396 |
0.0341 |
0.0000 |
0.0737 |
1.95 |
2.10 |
AZN-SL-A |
Azokh 2 |
OHI 5 |
109.4 |
0.2324 |
0.2659 |
0.0226 |
0.0228 |
0.3113 |
1.52 |
2.21 |
|
|
Surface affected by root marks, |
|
|
|
|
|
|
|
|
|
|
histology is not etched. EDS |
|
|
|
|
|
|
|
|
|
|
sediment rich in Fe and Mn |
|
|
|
|
|
|
|
|
AZN-SL-B |
Azokh 2 |
The white dots contain gypsum |
87.9 |
0.2038 |
0.2313 |
0.0442 |
0.1175 |
0.3930 |
1.37 |
2.26 |
|
|
(EDS) |
|
|
|
|
|
|
|
|
AZN-SL-C |
Azokh 2 |
OHI 0 |
48.3 |
0.1153 |
0.1035 |
0.2624 |
0.0109 |
0.3768 |
1.47 |
2.37 |
|
|
Completely invaded by bacteriae. |
|
|
|
|
|
|
|
|
|
|
EDS Barium sulfate (Barite) crystals |
|
|
|
|
|
|
|
|
AZN-SL-D |
Azokh 2 |
OHI 4 |
|
|
|
|
|
|
|
|
|
|
Pitted periosteal cortical layer, |
|
|
|
|
|
|
|
|
|
|
possibly fungi |
|
|
|
|
|
|
|
|
AZN-SL-F |
Azokh 2 |
OHI 5 |
102.0 |
0.1961 |
0.1603 |
0.0231 |
0.0123 |
0.1957 |
1.34 |
1.66 |
|
|
ESEM surface analysis, root marks. |
|
|
|
|
|
|
|
|
|
|
Good histology, no evidence of root |
|
|
|
|
|
|
|
|
|
|
etching in section |
|
|
|
|
|
|
|
|
AZN-SL-G |
Azokh 2 |
OHI 5 |
105.5 |
0.2238 |
0.2581 |
0.0303 |
0.0521 |
0.3404 |
1.48 |
2.25 |
|
|
Root marks on surface. Section: |
|
|
|
|
|
|
|
|
Good histology, no evidence of root etching. Barite deposits
Caves Azokh at Diagenesis Bone 11
261
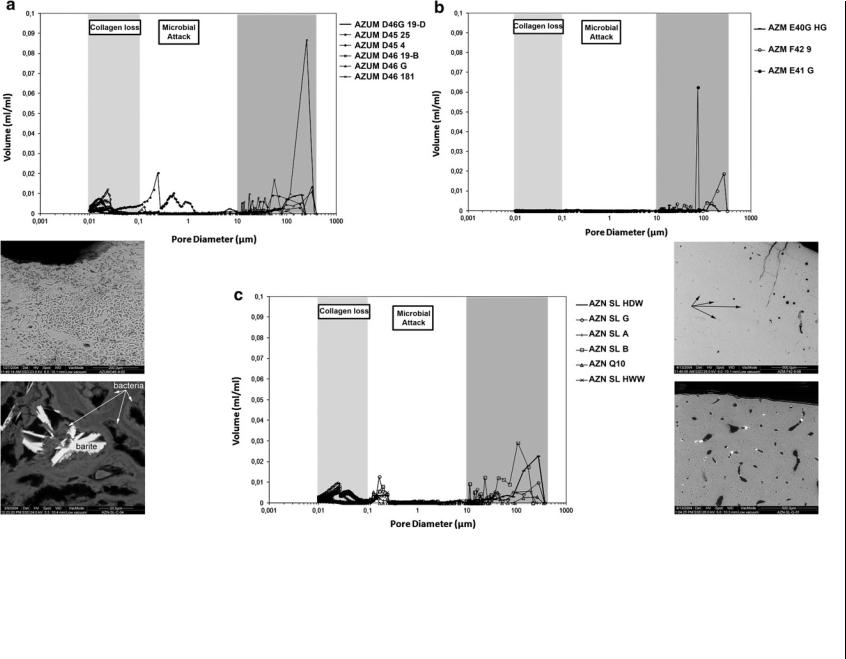
Fig. 11.2 Pore size distributions of Azokh fossil bone samples measured by mercury intrusion porosimetry. a Units II–III (inset middle left, AZUM D45 4 SEM microphotograph showing intense bacterial attack), b Unit Vm (inset middle right: AZM F42 9 SEM microphotograph showing Canals of Havers filled by calcareous secondary minerals, black arrows), c Azokh 2 (inset bottom left: AZN SL C SEM microphotograph showing bacterial attack and barite (BaSO4 identified by EDS) damaging bacteria colonies [microscopic focal destruction, MFD], so bacteria predated secondary growth of minerals; inset bottom right: SEM microphotograph of AZN SL G with histological cavities filled by secondary minerals, see Marin-Monfort et al. 2016)
262
.al et Smith .I.C