

Roth et al. Breast Cancer Research 2010, 12:R90 |
Page 4 of 8 |
http://breast-cancer-research.com/content/12/6/R90 |
|
(Eppendorf). Melting curve analyses were performed to verify the specificity and identity of PCR products.
The obtained data of the miR expression levels were calculated and evaluated by the Ct method as follows:
Ct = mean value Ct (reference miR16) - mean value Ct (miR of interest). The relative expression of miR of interest corresponded to the 2^( Ct) value.
As recommended by the manufacturer (Applied Biosystems), miR16 has been chosen as reference for normalization of the expression levels of our miR panel. To effectively normalize the expression data of miR10b, miR34a, miR141 and miR155, we analyzed the miR16 expression levels and found that the levels remained relatively constant across the serum samples. We calculated a mean value of 21.12, 22.23, and 21.17 with a standard deviation of 2.10, 2.12 and 0.98 for the subgroups of M0 patients, M1 patients and healthy women, respectively.
Statistical analysis
The statistical analyses were performed using the SPSS software package, version 18.0 (SPSS Inc. Chicago, IL, USA). The chi square or two-tailed Fischer´s exact test was used to identify potential associations of miR concentrations in blood serum with the clinical and histopathological risk factors of the breast cancer patients. For nonparametric comparisons, univariate analyses of the Mann Whitney-U test of two independent variables
and bivariate analyses of the Spearman-Rho test were used. Kaplan-Meier plots were drawn on to estimate overall survival and recurrence, and the Log rank test was applied for statistical analyses. Missing data were handled by pairwise deletion. A P-value ≤0.05 was considered as statistically significant. All P-values are twosided.
Results
Expression pattern of miR10b, miR34a, miR141 and miR155 in breast cancer cell lines
Before examining the signature of the four miRs (miR10b, miR34a, miR141 and miR155) in human blood, we analyzed their expression patterns in the widely used breast cancer cell lines MDA-MB-231 and GI-101 as well as in the micrometastatic cell lines BCM1 and BC-S1 which were established from disseminated tumor cells present in the bone marrow of breast cancer patients without overt distant metastases [22]. Interestingly, BC-M1 and BC-S1 cells co-express cytokeratin and vimentin consistent with an EMT-like invasive phenotype as well as other cancer stem cell characteristics [23,24].
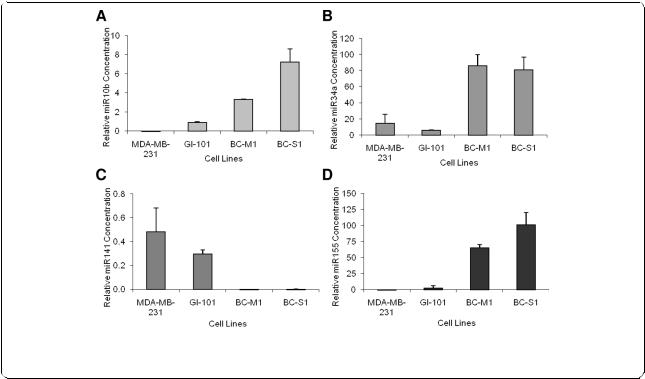
We quantified the relative expression of these miRs by determining the low cycle threshold (Ct) values. As shown in Figure 1A-D, the relative values of the miRs in MDA-MB-231 and GI-101 differed from those in the micrometastatic cell lines. Compared with the low
Figure 1 MiR expression in breast cancer cell lines as determined by quantitative real-time PCR. Basal expression levels of miR10b (A), miR34a (B), miR141 (C) and miR155 (D) in breast cancer cell lines MDA-MB-231 and GI-101, and micrometastatic breast cancer cell lines BC-M1 and BC-S1. The relative transcript levels of the miRs were determined by the low cycle threshold (Ct) values.
Roth et al. Breast Cancer Research 2010, 12:R90 |
Page 5 of 8 |
http://breast-cancer-research.com/content/12/6/R90 |
|
values in MDA-MB-231 and GI-101 cells, the transcript levels of miR10b (Figure 1A), miR34a (Figure 1B) and miR155 (Figure 1D) were significantly upregulated in the micrometastatic breast cancer cells BC-M1 and BC-S1. MiR141 expression was clearly upregulated in MBD-MB-231, and GI-101 cells, whereas it was nearly abolished in the micrometastatic cells (Figure 1C).
Profiling of total RNA
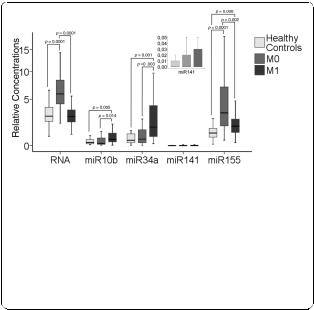
In the box plot of Figure 2, the relative quantification of circulating total RNA, miR10b, miR34a, miR141 and miR155 in blood serum of 29 healthy individuals and 89 patients with breast cancer (M0, n = 59 and M1, n = 30) are depicted. To determine the differences in the relative expression profiles, we performed univariate analyses of the Mann Whitney-U test.
As shown in Figure 2, M0 patients had significantly higher levels of circulating total RNA in their blood (normalized Ct values), which was taken approximately four weeks after surgery, than healthy individuals (P = 0.0001). Counter to expectation, M1 breast cancer patients had similar RNA concentrations to healthy individuals. M0 patients had on average 2.0-fold higher median values of RNA than M1 patients and healthy controls (P = 0.0001). In addition, we also analyzed paired serum samples taken preand post-operatively from 10 breast cancer patients. Our data showed similar RNA levels before and four weeks after surgery (P = 0.375, data not shown).
In respect to the miRs, the median values of miR155 of both subgroups M0 and M1 were 2.7-fold (P = 0.0001) and 1.6-fold (P = 0.008) increased in comparison to healthy women. In contrast, the values of miR10b (4-
Figure 2 Levels of total RNA and miRs in blood of breast cancer patients and healthy controls. The box plot and the additionally integrated box plot of miR141 show the different, relative amounts of total RNA, miR10b, miR34a, miR141 and miR155 which circulate in blood of healthy individuals (n = 29), M0 patients (n = 59) and M1 patients (n = 30). The relative transcript levels of miRs were determined by the low cycle threshold (Ct) values. As determined by Mann and Whitney-U test, the significant P-values of the statistical evaluations of serum RNA and miR levels are indicated above the blots.
fold, P = 0.005) and miR34a (4.5-fold, P = 0.001) could only discriminate M1 patients, but not M0 patients, from healthy individuals. In M0 and M1 patients, their relative yields of miR141 did not differ significantly between healthy women and women with breast cancer (Figure 2).
Correlation of circulating total RNA and miRs in serum of breast cancer patients with clinical and histopathological factors
We compared the relative concentrations of circulating total RNA, miR10b, miR34a, miR141 and miR155 in blood serum of the 89 breast cancer patients with their clinical and histopathological data. For these statistical evaluations, the Mann and Whitney-U test of the nonparametric comparison of two independent variables and Log rank test were used (Table 1). As shown in Table 1 and Figure 2, the transcript levels of miR10b (P = 0.014) and miR34a (P = 0.003) were significantly higher in serum of M1 patients than M0 patients, whereas the levels of miR155 (P = 0.002) and total RNA (0.0001) in M1 patients were lower than in M0 patients. Moreover, high values of total serum RNA (P = 0.0001) and miR34a (P = 0.01) correlated with advanced tumor stages within the subgroup of 59 M0 patients (Table 1).
In addition, we correlated the values of total RNA and miRs with the number of mononuclear blood cells of M0 patients, because leukocytes could also be a source for the release of these RNAs. Unfortunately, no data on the number of leukocytes were available for M1 patients. Surprisingly, M0 patients at early tumor stages had significantly more leukocytes in their blood than patients at advanced tumors (P = 0.016). No significant relationship of the number of leukocytes to the RNA and miR values could be detected.
The statistical assessments between the concentrations of miRs and the other clinical and histopathological data as well as the number of circulating tumor cells (CTC) did not reach any statistical significance (Table 1). The number of CTC was only determined in blood of M0 patients. Within this subgroup, 57 of 59 patients were analyzable for CTC but only 10 (18%) patients had CTC in their blood. This low number of CTC-positive patients impeded an accurate statistical analysis.
Kaplan-Meier and Log-rank models were used to assess the prognostic potential of miR levels in serum of breast cancer patients. The median follow-up time was three years (range 1.6 to 4.2 years). Median expression levels were used for grouping the serum samples according to low and high expression. The serum levels of miR141 could not discriminate breast cancer patients from healthy women but the association with the clinical outcome reached borderline significance (P = 0.1 for progression-free survival in M1 patients and P = 0.06