

Ielts Graph #1
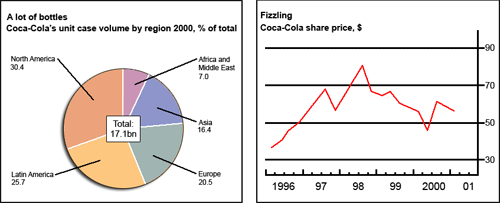
The chart and graph below give information about sales and share prices for Coca-Cola. Write a report for a university lecturer describing the information shown below.
You should write at least 150 words.
You should spend about 20 minutes on this task.
model answer:
The pie chart shows the worldwide distribution of sales of Coca-Cola in the year 2000 and the graph shows the change in share prices between 1996 and 2001. In the year 2000, Coca-Cola sold a total of 17.1 billion cases of their fizzy drink product worldwide. The largest consumer was North America, where 30.4 per cent of the total volume was purchased. The second largest consumer was Latin America. Europe and Asia purchased 20.5 and 16.4 per cent of the total volume respectively, while Africa and the Middle East remained fairly small consumers at 7 per cent of the total volume of sales. Since 1996, share prices for Coca-Cola have fluctuated. In that year, shares were valued at approximately $35. Between 1996 and 1997, however, prices rose significantly to $70 per share. They dipped a little in mid-1997 and then peaked at $80 per share in mid-98. From then until 2000 their value fell consistently but there was a slight rise in mid-2000.
Ielts Graph #2
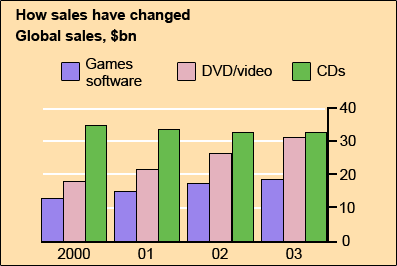
The chart below gives information about global sales of games software, CDs and DVD or video. Write a report for a university lecturer describing the information.
You should write at least 150 words.
You should spend about 20 minutes on this task.
model answer:
The chart shows the changes in the sales of video material / DVDs, games software and CDs around the world in billions of dollars over a three-year period. It can be seen that the sales of videos / DVDs and games software have increased, while the sales of CDs have gone down slightly. Between 2000 and 2003, the sale of videos and DVDs rose by approximately 13 billion dollars. In 2000, just under 20 billion dollars worth of these items were sold, but in 2003, this figure had risen to a little over 30 billion dollars. The sales of games software also rose during this period, but less sharply. Sales increased from about 13 billion dollars in 2000 to just under 20 billion dollars three years later. By contrast, during the same time period, the sale of CDs fell from 35 billion dollars in 2000 to about 32.5 billion dollars in 2003.
Ielts Graph #3
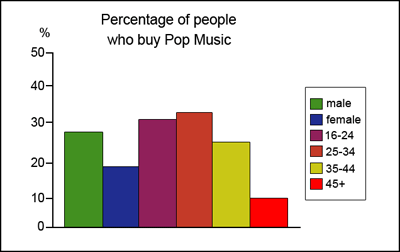
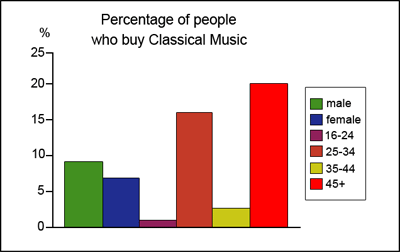
The graphs below show the types of music albums purchased by people in Britain according to s3x and age. Write a report for a university lecturer describing the information shown below.
You should write at least 150 words.
You should spend about 20 minutes on this task.

model answer:
The three graphs provide an overview of the types of music people purchase in the UK. At first glance we see that classical music is far less popular than pop or rock music. While slightly more women than men buy pop music, the rock market is dominated by men with 30% buying rock, compared to 17% of women. From the first graph we see that interest in pop music is steady from age 16 to 44 with 20% of the population continuing to buy pop CDs after the age of 45. The interest in rock music reaches its peak among the 25 to 34 year olds, though it never sells as well as pop. Interest also drops off after the age of 35 with an even sharper fall from age 45 onwards, a pattern which is the opposite to the classical music graph.