Glossary
An important component of strong communication is the consistent use of terms and phrases. It is easy to forget how dependent human beings are on language. Every conversation involves a common understanding of terms. When someone uses a term that you have never heard before, or uses a known term in a different way, the message is incomplete. Your brain may even get distracted thinking about the unknown term and miss the rest of the communication. Understanding the importance of terms is critical to successful analysis. Analysts must be precise when discussing and presenting requirements. The accurate use of terms, especially terms that are unique to a business domain, will ensure successful communication of requirements.
This points out another important lesson for the business analysis professional. You must be able to use the terms from the business even when they are foreign or unfamiliar to you. This is where a glossary can help. The analyst should begin jotting down important terms from the very first meetings with stakeholders. Terms that seem common and well known should be confirmed. Each term should be defined and the definition should be agreed upon by all project stakeholders. Undefined terms create ambiguous requirements.
An SME may describe a process as:
A customer purchases products by logging into the Web site and placing items in the shopping cart. When the buyer is ready to check out, the screen should display the total shipping charges and the total order amount.
Is the customer the same person as the buyer? Is an item always a product? What is the difference between the shopping cart and the order? Using inconsistent terminology in requirements often leads to mistakes in solution development.
Analysts must listen very carefully to the use of terms by stakeholders. As inconsistencies are found, they must be exposed. Be aware, though, that simply exposing an inconsistency will not correct it. If one department has been using the term customer and another department has been using the term client, you will not be able to quickly change either of their habits. You must first determine if they are using the terms in exactly the same way. If not, there may be two different words that are important and relevant here. Your job, as the analyst, is to point out the inconsistency, get agreement on the term definitions, and work to bring the group to consensus on shared language to be used in procedures and systems.
Workflow Diagrams
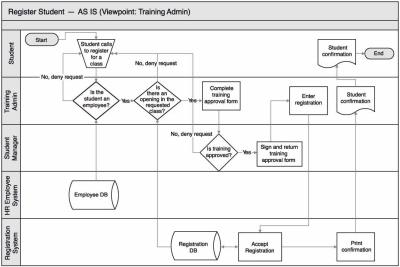
A workflow diagram visually details one or more business processes to clarify understanding or to make process improvement recommendations. Workflow diagrams (also known as flowcharting, UML activity diagrams, and process maps) are one of the oldest and most well-established analysis techniques. See Figure 6.2 for an example of a workflow diagram.
Workflow diagrams show how work is accomplished, including the sequence in which things are done. They can also show information flows through the processes and how business people and other external agents are involved with the process. They may be used to visually represent a current process (as is) or to represent a recommended future process (to be).
There are many variations of workflow diagrams. Almost every software development approach recommends their use for requirements. The American National Standards Institute (ANSI) (www.ansi.org) standardized symbols and shapes for use in these diagrams in the 1970s. A small subset of the standard is commonly used, and a few shapes (like the diamond for a decision) have become almost universally understood. A workflow diagram can be divided into sections to show departments or divisions within an organization. These sections are referred to as swim lanes. The UML shapes vary a bit from ANSI for use in the UML activity diagram.
The workflow diagram is one of the first techniques that a new analyst should learn. It is the most flexible technique, with few rules for its creation. The flexibility of the technique allows its use on many different types of projects. Its flexibility also makes it challenging for analysts. One of the decisions that an analyst will make when using this technique is whether or not a final diagram will be used as a formal deliverable. Although this decision is made for every technique, workflow diagrams are unique because they may be created at various levels of detail, for current or future systems, and for various audiences. When a workflow diagram is used as a formal deliverable, care must be taken to clearly communicate its purpose and its viewpoint.
 Figure
6.2: Sample
Workflow Diagram
Figure
6.2: Sample
Workflow Diagram
Workflow diagrams are a great tool for analysts to use for note taking during requirements elicitation. Business stakeholders frequently describe their work as a series of tasks, interjecting notes about worker involvement and current software support. The analyst draws a picture of the business process to help understand it and confirm that understanding with the SMEs. Using a workflow diagram as a conversation tool does not imply that it must become a formal deliverable.
A relatively new approach to creating workflow diagrams is called Business Process Modeling Notation© (www.bpmn.org). This notation was defined by the Business Process Management Initiative, a non-profit professional organization striving to standardize business process modeling techniques. This organization merged with the Object Management Group (www.omg.org), which maintains the UML standards. Together the groups hope to produce a seamless transition from business modeling to software design.
Another type of workflow diagram is found in the Six Sigma approach to process improvement. The Six Sigma workflow diagram is called the SIPOC diagram (Supplier, Inputs, Process, Outputs, and Customer) and is used to show a high-level view of an entire business transaction. A process on a SIPOC diagram may be decomposed into a more detailed SIPOC diagram. This Six Sigma technique is used to identify and measure current business activities (as is) and perform root cause analysis to find process inefficiencies (Pande et al., 2000).
Lean approaches use a technique called value stream mapping to analyze the flow of materials and information to bring a product or service to the customer. It includes standard symbols for supply chain entities. The focus is on improving processes and reducing waste (www.lean.org).
Workflow diagrams are also used for implementation or transition requirements.
Employee procedure manuals, standard operating procedures, and rollout plans are all better communicated by including visual instructions rather than just text.