Enable the Queue-Length Signal
The FIFO Queue block can report the queue length, that is, the number of entities it stores at a given time during the simulation. To configure the FIFO Queue block to report its queue length, do the following:
Double-click the FIFO Queue block to open its dialog box. Click the Statistics tab to view parameters related to the statistical reporting of the block:
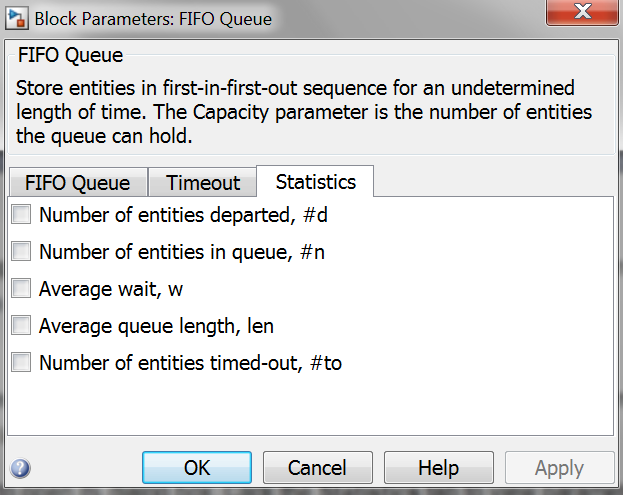
Set the Number of entities in queue parameter to On (внести метку в поле
 )
and
click OK.
This causes the block to have a signal output port for the
queue-length signal. The
port label is #n.
)
and
click OK.
This causes the block to have a signal output port for the
queue-length signal. The
port label is #n.
Plot the Queue-Length Signal
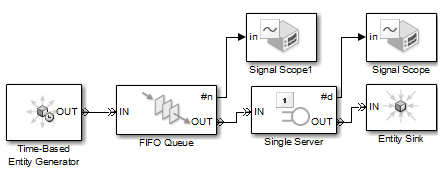
The model already contains a Signal Scope block for plotting the entity count signal. To add another Signal Scope block for plotting the queue-length signal (enabled above), follow these steps:
In the main SimEvents library window, double-click the SimEvents Sinks icon to open the SimEvents Sinks library.
Drag the Signal Scope block from the library into the model window. The block automatically assumes a unique block name, Signal Scope1, to avoid a conflict with the existing Signal Scope block in the model. (Название графика и оси координат для Signal Scope1 ввести как показано ниже.)
Connect the #n signal output port of the FIFO Queue block to the in signal input port of the Signal Scope1 block by dragging the mouse pointer from one port to the other. The model now looks like the following figure.
Simulate with Different Intergeneration Times
By changing the intergeneration time (that is, the reciprocal of the entity arrival rate) in the Time-Based Entity Generator block, you can see when entities accumulate in the queue. Try this procedure:
Note: If you skipped the earlier model-building steps, you can open a completed version of the model for this section by entering simeventsdocex('doc_dd1_blockage')simeventsdocex('doc_dd1_blockage') in the MATLAB Command Window. |
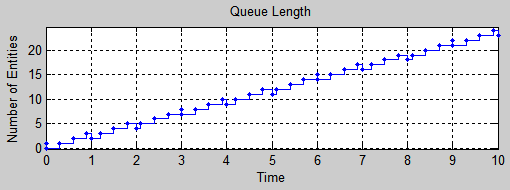
Double-click the Time-Based Entity Generator block to open its dialog box, set the Period parameter to 0.85, and click OK. This causes entities to arrive somewhat faster than the Single Server block can process them. As a result, the queue is not always empty.
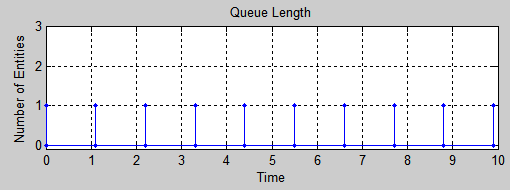
Save and run the simulation. The plot whose title bar is labeled Signal Scope1 represents the queue length. The figure below explains some of the points on the plot. The vertical range on the plot has been modified to fit the data better.

Reopen the Time-Based Entity Generator block's dialog box and set Period to 0.3.
Run the simulation again. Now the entities arrive much faster than the server can process them. You can make these observations from the plot:
Every 0.3 s, the queue length increases because a new entity arrives.
Every 1 s, the queue length decreases because the server becomes empty and accepts an entity from the queue.
Every 3 s, the queue length increases and then decreases in the same time instant. The plot shows two markers at T = 0, 3, 6, and 9:
Reopen the Time-Based Entity Generator block's dialog box and set Period to 1.1.
Run the simulation again. Now the entities arrive more slowly than the server's service rate, so every entity that arrives at the queue is able to depart in the same time instant. The queue length is never greater than zero for a positive amount of time.