

Connect Blocks
Now that the model window for dd1 contains blocks that represent the key processes, connect the blocks as shown in the following graphic.
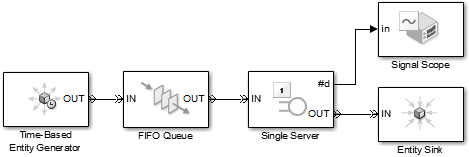
To connect blocks, do one of the following:
With the mouse, drag from the output port of the source block to the input port of the destination block.
Select the source block. Ctrl+click the destination block.
In both cases, SimEvents connects the source block to the destination block. If necessary, the software also routes the connecting line around intervening blocks or lines.
Note: The following section about inserting blocks is general information that does not apply to the dd1 model. When you have connected the blocks as shown in the preceding graphic, the dd1 model is ready for simulation as described in Run the Simulation. |
Run the Simulation
Save the dd1 model you have created. Then start the simulation by choosing Simulation > Run from the model window's menu.
Resolve Solver Warnings
When you first simulate the model in this example, you will see warning messages in the MATLAB Command Window about continuous states and the maximum step size. These messages appear because certain default parameters for a Simulink model are inappropriate for this particular example model, which is completely event-based and contains no blocks with continuous states. The application overrides the inappropriate parameters and alerts you to that fact.
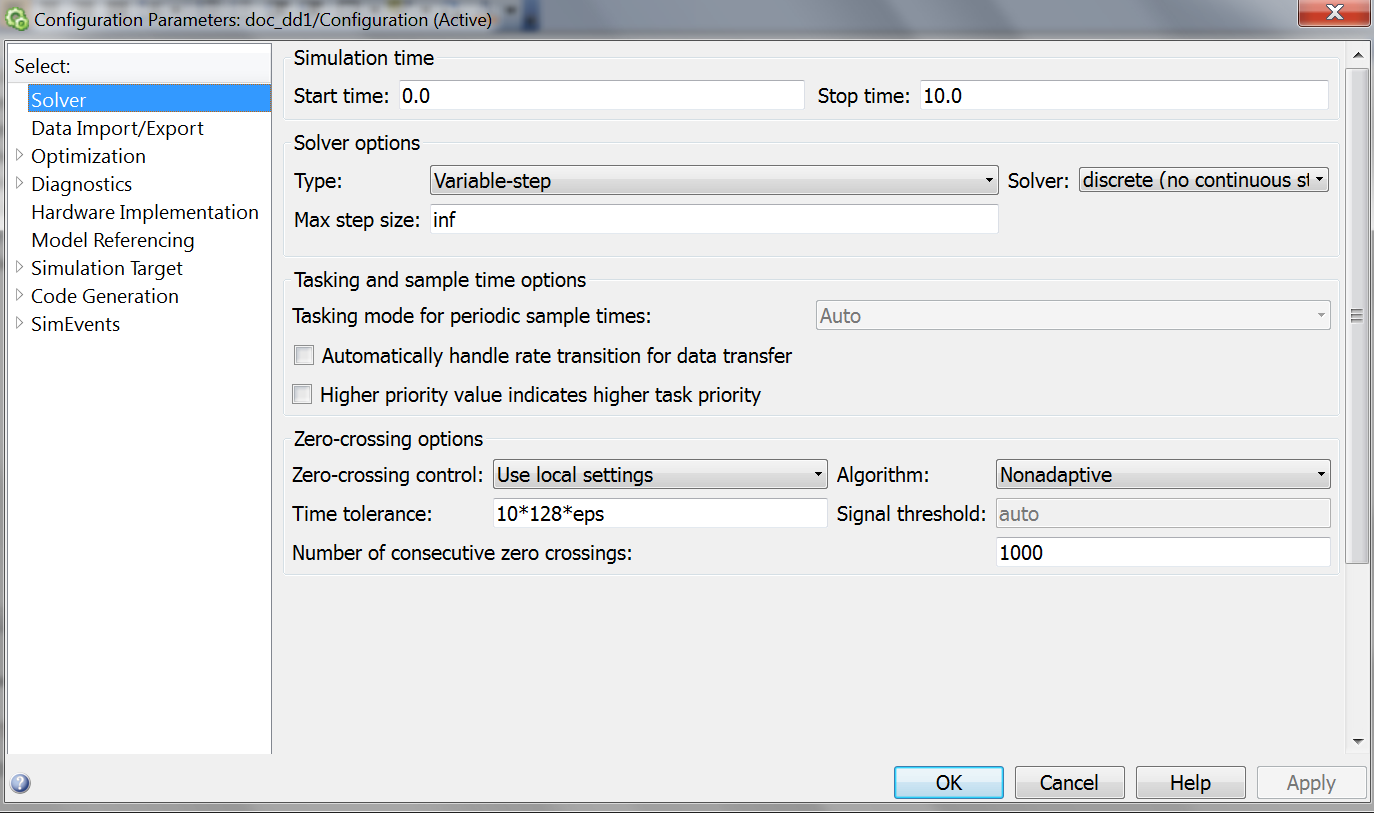
If you want to prevent these warnings when you simulate event-based models in the future, you need to set the solver type and step size parameters to appropriate values. To do this, with your model open in the model editor, open Simulation > Configuration Parameters (или Model Configuration Parameters) > Solver:
Under
the Solver
options
section, for the Type:
parameter select the Variable-step
option in the drop-down list. For the Solver:
parameter, select Discrete
in the drop-down list and in the field for the Max
step size:
parameter, type inf.
Click OK and save your model (кликнуть
иконку
![]() в
инструментальной
строке
окна
SimEvents-модели
dd1).
в
инструментальной
строке
окна
SimEvents-модели
dd1).
Results of the Simulation
When the simulation runs, the Signal Scope block opens a window containing a plot. The horizontal axis represents the times at which entities depart from the server, while the vertical axis represents the total number of entities that have departed from the server.
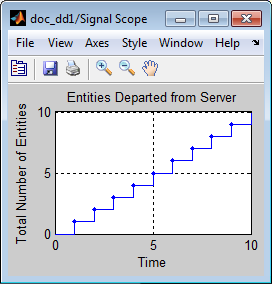
After an entity departs from the Single Server block, the block updates its output signal at the #d port. The updated values are reflected in the plot and highlighted with plotting markers. From the plot, you can make these observations:
Until T=1, no entities depart from the server. This is because it takes one second for the server to process the first entity.
Starting at T=1, the plot is a stairstep plot. The stairs have height 1 because the server processes one entity at a time, so entities depart one at a time. The stairs have width equal to the constant service time, which is one second.
Insert Blocks
You can insert a block in an existing line, if the block that you want to insert:
Has only one input and one output port.
Has connection port types (i.e. entity ports or signal ports) that correspond with the data on the existing line. For example, in an existing entity line, you can insert only a block that accepts and outputs entities. You cannot insert a block that accepts and outputs event-based signals.
To insert a block in a line:
Drag the block over the line.
Release the mouse button. SimEvents inserts the block in the line.