

Examples
Build a Discrete-Event Model (директория R2013a>SimEvents>Getting Started with SimEvents)
Select the First Available Server (директория R2013a>SimEvents>Modeling>Routing Select Departure Path Using Output Switch)
Constructs Involving Queues and Servers (директория R2013a>SimEvents>Getting Started with SimEvents>Model Basic Queueing Systems)
Use a Signal or an Attribute (директория R2013a>SimEvents>Troubleshooting in SimEvents>Common Problems in SimEvents Models)
Preemption by High-Priority Entities (директория R2013a>SimEvents>Modeling>Queuing>Preempt an Entity in a Server)
Control Joint Availability of Two Servers (директория R2013a>SimEvents>Modeling>Entity Management>Entity Blocking Control Enable a Gate for a Time Interval)
Synchronize Service Start Times with the Clock (директория R2013a>SimEvents>Modeling>Entity Management>Entity Blocking Control>Open a Gate Instantaneously)
The following example (для этого команду open model скопировать в Command Window) illustrates the timing of updates of the util signal, as described in Signal Output Ports (директория R2013a>SimEvents>Modeling>Queuing>Single Server).
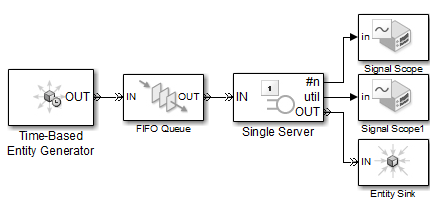
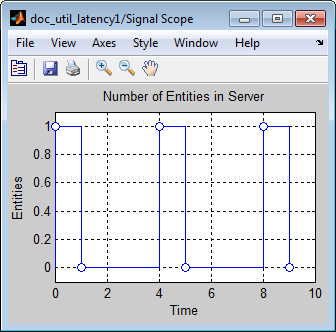
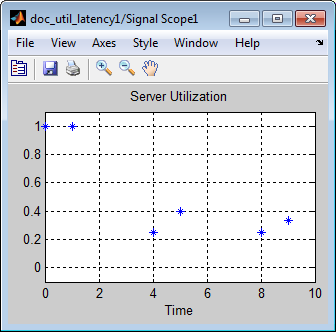
The server has idle periods that reduce its utilization. However, the server block recomputes the util signal only when the number of entities in the server changes. While the definition of utilization says that the utilization is less than 1 at time 3, the util signal remains at its previous value of 1 until the next entity arrives at time 4.
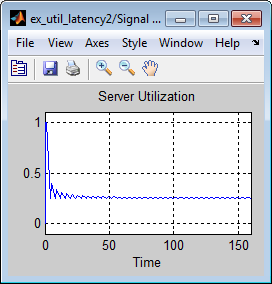
In a longer simulation, the differences in the value of util compared to its theoretical definition become less pronounced.
See Also
N-Server (директория R2013a>SimEvents>Modeling>Queuing), Infinite Server (директория R2013a>SimEvents>Modeling>Queuing)
Servers in SimEvents Models (директория R2013a>SimEvents>Getting Started with SimEvents)
Таким образом, в блоке Single Server модели dd1 производится обслуживание сущностей (имитируется выполнение работ). Время обслуживания (объем работы) каждой сущности задается по его входу t.
Конец описания блока Single Server модели sedemo_DVS_model .
R2013a SimEvents Simulation Visualize Results
Signal Scope
Plot data from signal
Library
SimEvents Sinks
Description

This block creates a plot using data from an event-based signal. The data for the vertical axis comes from the signal connected to the block's signal input port labeled in.
The Plot type (см. ниже Plotting tab) parameter on the Plotting tab determines whether and how the block connects the points that it plots. For details, see Connections Among Points in Plots (директория R2013a>SimEvents>Simulation>Visualize Results>Choose and Configure Plotting Blocks).
Selecting Data for the Horizontal Axis
Use the X value from (см. ниже Plotting tab) parameter to select the type of data for the horizontal axis. The table below describes the choices.
Source of X Data |
Description of Plot |
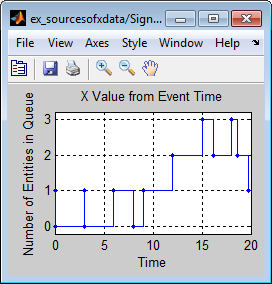
Event time |
Plot of the in signal versus simulation time. For example, you might use this option to see how the length of a queue changes over time. |
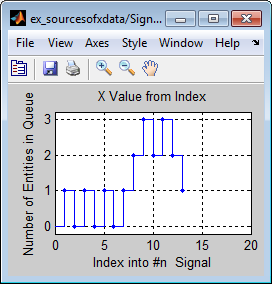
Index |
Plot of the in signal's successive values against a horizontal axis that represents the index of the values. The signal's first value during the simulation has an index of 1, the signal's second value has an index of 2, and so on. For example, you might use this option for a signal that has zero-duration values, to help determine the exact sequence among values that the signal assumes simultaneously. |
The figures below illustrate the different sources of data for the horizontal axis. The plots look similar, except that the second plot has uniform horizontal spacing rather than time-based spacing between successive points.
Ports
Signal Input Ports
Label |
Description |
in |
Signal containing data for the Y axis. This signal must be an event-based signal. |
Signal Output Ports
Label |
Description |
#c |
Number of points the block has plotted. |
The initial output value is 0. This value is in effect from the start of the simulation until the first update by the block.