

The Financial Development report 2012
.pdf1.1: The Financial Development Index 2012
Figure 2: Main Index, pillar and subpillar variation analysis results
|
Main Index Level |
|
Pillar Level |
|
|
SubPillar Level |
|
|||||||
|
|
|
|
|
|
|
|
|
|
|
|
|
|
|
|
|
|
|
|
|
|
|
|
|
|
|
|
|
|
|
|
Main |
|
1st pillar: |
|
|
Financial sector liberalization |
|
|
|||||
|
|
Index |
|
Institutional |
|
|
|
|
||||||
|
|
|
Corporate governance |
|
|
|||||||||
|
|
|
|
|
|
environment |
|
|
|
|
|
|
||
|
|
|
|
|
|
|
|
Legal and regulatory issues |
|
|
|
|||
|
|
|
|
|
|
|
|
|
|
|
|
|
||
|
|
|
|
|
|
|
|
|
|
|
|
|
||
|
|
|
|
|
|
|
|
|
|
|
Contract enforcement |
|
|
|
|
|
|
|
|
|
|
|
|
|
|
|
|
|
|
|
|
|
|
|
|
|
|
|
|
|
|
|
|
|
|
|
|
|
|
|
2nd pillar: |
|
|
Human capital |
|
|
|||
|
|
|
|
|
|
Business |
|
|
|
|
||||
|
|
|
|
|
|
|
|
Taxes |
|
|
||||
|
|
|
|
|
|
environment |
|
|
|
|
|
|
||
|
|
|
|
|
|
|
|
Infrastructure |
|
|
|
|||
|
|
|
|
|
|
|
|
|
|
|
|
|
||
|
|
|
|
|
|
|
|
|
|
|
|
|
||
|
|
|
|
|
|
|
|
|
|
|
Cost of doing business |
|
|
|
|
|
|
|
|
|
|
|
|
|
|
|
|
|
|
|
|
|
|
|
|
|
|
|
|
|
|
|
|
|
|
|
|
|
|
|
3rd pillar: |
|
|
Currency stability |
|
|
|||
|
|
|
|
|
|
Financial |
|
|
|
|
||||
|
|
|
|
|
|
|
|
Banking system stability |
|
|
||||
|
|
|
|
|
|
stability |
|
|
|
|
|
|
||
|
|
|
|
|
|
|
|
Risk of sovereign debt crisis |
|
|
|
|||
|
|
|
|
|
|
|
|
|
|
|
|
|
||
|
|
|
|
|
|
|
|
|
|
|
|
|
|
|
|
|
|
|
|
|
|
|
|
|
|
|
|
|
|
|
|
|
|
|
|
|
|
|
|
|
|
|
|
|
|
|
|
|
|
|
4th pillar: |
|
|
Size index |
|
|
|||
|
|
|
|
|
|
Banking |
|
|
|
|
||||
|
|
|
|
|
|
|
|
Efficiency index |
|
|
||||
|
|
|
|
|
|
financial |
|
|
|
|
|
|
||
|
|
|
|
|
|
|
|
Financial information disclosure |
|
|
|
|||
|
|
|
|
|
|
services |
|
|
|
|
||||
|
|
|
|
|
|
|
|
|
|
|
|
|||
|
|
|
|
|
|
|
|
|
|
|
|
|
|
|
|
|
|
|
|
|
|
|
|
|
|
|
|
|
|
|
|
|
|
|
|
|
|
|
|
|
|
|
|
|
|
|
|
|
|
|
5th pillar: |
|
|
IPO activity |
|
|
|||
|
|
|
|
|
|
Non-banking |
|
|
|
|
|
|||
|
|
|
|
|
|
|
|
M&A activity |
|
|
||||
|
|
|
|
|
|
financial |
|
|
|
|
|
|
||
|
|
|
|
|
|
|
|
Insurance |
|
|
||||
|
|
|
|
|
|
services |
|
|
|
|
||||
|
|
|
|
|
|
|
|
|
|
|
|
|||
|
|
|
|
|
|
|
|
|
|
|
Securitization |
|
|
|
|
|
|
|
|
|
|
|
|
|
|
|
|
|
|
|
|
|
|
|
|
|
|
|
|
|
|
|
|
|
|
|
|
|
|
|
6th pillar: |
|
|
Foreign exchange markets |
|
|
|||
|
|
|
|
|
|
Financial |
|
|
|
|
||||
|
|
|
|
|
|
|
|
Derivatives markets |
|
|
||||
|
|
|
|
|
|
markets |
|
|
|
|
|
|
||
|
|
|
|
|
|
|
|
Equity market development |
|
|
||||
|
|
|
|
|
|
|
|
|
|
|
|
|
||
|
|
|
|
|
|
|
|
|
|
|
|
|
||
|
|
|
|
|
|
|
|
|
|
|
Bond market development |
|
|
|
|
|
|
|
|
|
|
|
|
|
|
|
|
|
|
|
|
|
|
|
|
|
|
|
|
|
|
|
|
|
|
|
|
|
|
|
7th pillar: |
|
|
Commercial access |
|
|
|||
|
|
|
|
|
|
Financial |
|
|
|
|
||||
|
|
|
|
|
|
|
|
Retail access |
|
|
||||
|
|
|
|
|
|
access |
|
|
|
|
|
|
||
|
|
|
|
|
|
|
|
|
|
|
|
|
|
|
|
|
|
|
|
|
|
|
|
|
|
|
|
|
|
|
|
|
|
|
|
|
|
|
|
|
|
|
|
|
|
|
|
|
Little movement |
|
|
High movement |
|
||||||
|
|
|
|
|
|
|||||||||
|
|
|
|
|
|
|
|
|
|
|
|
|
|
|
Within the financial stability pillar, changes in rank can be observed across all of the subpillars. However, by far the most significant year-on-year movement in rank occurs in the banking system stability subpillar. Looking more closely at banking system stability, one can see year-on-year changes in two out of the five underlying indicators. First, Tier 1 capital ratios have improved; from 2011 to 2012, median
Tier 1 capital ratios have risen 8.3 percent. This suggests that financial institutions are preparing for regulatory reform and strengthening their balance sheets. Second, the aggregate measure of real estate bubbles indicator experienced increases. As is the case with the Tier 1 capital ratio, over half the countries in the sample have seen an increase, albeit only a marginal one, with the median year-on-year change being 1.5 percent. Finally, removal of the Financial Stress Index,
as discussed in more detail in the adjustments section, also contributes to some of the rank changes that can be found in this subpillar. For a more detailed look at the financial
stability pillar results, as well as a discussion of the underlying dynamics of the linear ranking, please see Box 3.
The banking financial services pillar similarly portrays higher relative rank movement. The largest movements occur in the efficiency index, while financial information disclosure sees the least change. Within the efficiency index subpillar, the largest improvement is in the non-performing bank loans to total loans indicator, with a median year-over-year increase
of 8 percent, and with an increase in more than 60 percent of countries covered in the sample. In light of efforts to recover from the recent crisis, this improvement may be a step forward, as “bad” loans are being churned off balance sheets. In contrast, other indicators in the subpillar have experienced only marginal changes. For instance, the public ownership of banks indicator has seen a decline of 1.7 percent, suggesting that there has been an increase in public bank ownership. The indicator is evenly split between countries that have improved, declined, and experienced no change. One can also observe a slight increase (year-on-year median change of approximately 1 percent) in both bank overhead costs
and bank operating costs to assets, possibly hinting
at an improvement in the efficiency of banks, albeit still at a very low level.
The largest movement in rank across the four subpillars constituting the financial markets pillar appears in the equity market development subpillar. Although the other subpillars also show changes in rank, they are marginal in comparison. Three of the four indicators within the equity market development subpillar either increase or decrease by a median of nearly 20 percent year-over-year. Whereas the stock market turnover ratio and stock market value traded to GDP indicators both see approximately 70 percent of countries in our sample decline, the stock market capitalization to GDP indicator sees just over 70 percent of countries in the sample increase. The fourth indicator, number of listed companies per 10,000 people, also shows nearly 70 percent of countries decreasing, although on a smaller scale
(a median year-on-year decline of 1.8 percent).
Within the financial access pillar, the largest changes in rank can be seen in the retail access subpillar. This is not surprising, given that this year’s Index includes a number of new indicators (please see the adjustments section earlier in the chapter
for more detail). Therefore, the high degree of movement across ranks is driven more by methodological changes than changes in the underlying data.
Pillar five, non-banking financial services, proves to be an exception among the seven pillars. Although this pillar shows lower rank movement relative to previous years, one of its
The Financial Development Report 2012 | 15

1.1: The Financial Development Index 2012
Box 3: A closer look at financial stability
By Michael Drexler
Financial stability has featured prominently in the debate about financial development for quite some time, and this has certainly been reinforced by the recent crisis and subsequent events. It is therefore only appropriate to discuss some of the aspects of the financial stability pillar in more detail.
Some good news
Regulators around the world have focused sharply on improving banks’ strength, and it shows. Only in two countries out of the sample did Tier 1 capital ratios for major banks decline in a meaningful way (i.e., more than 10 percent), and none of those declines led to a ratio below 10 percent. For comparison, before the crisis this ratio was around 6 percent for many developed markets. This is illustrated graphically in Figure 1, with some countries highlighted that either are outliers in the absolute ratio or have shown particularly large changes.
Figure 1: Tier 1 capital ratios for top 10 banks
|
25 |
|
|
|
|
|
|
|
|
|
|
|
|
|
|
|
|
IMPROVED |
|
|
|
|
|
|
|
|
|
|
|
|
|
|
|
|
|
|
|
|
|
|
|
|
|
|
|
Japan |
|
|
20 |
|
|
|
|
|
|
|
|
|
|
%2012,FDR |
|
|
|
|
Ireland |
|
|
|
DETERIORATED |
|
|
15 |
|
|
|
|
Austria |
|
|
|
|||
|
|
|
|
|
|
|
|
|
|
|
|
|
|
|
|
|
Peru |
|
|
|
|
|
|
|
10 |
|
|
|
|
|
|
|
|
|
|
|
|
|
|
Israel |
|
|
|
|
|
||
|
|
|
|
|
|
|
|
|
|
|
|
|
5 |
|
|
|
|
|
|
|
|
|
|
|
|
|
|
|
|
|
|
|
|
||
|
0 |
|
|
|
|
|
|
|
|
|
|
|
|
|
|
|
|
|
|
||||
|
|
|
|
|
|
|
|
|
|
|
|
|
0 |
5 |
10 |
15 |
20 |
25 |
|||||
|
|
|
|
|
|
FDR 2011, % |
|
|
|
|
|
Some of the outliers warrant a closer look. Japan’s position is driven by an idiosyncrasy in its banking system— a large bank that primarily takes deposits and offers very little credit, therefore showing an exceptionally high capital buffer; the other major banks have Tier 1 ratios in line with the upper range of global averages.
While Ireland has made great strides in putting its banking system on sound footing, continued entanglement between sovereign debt and the European banking system means that even a Tier 1 capital buffer above 15 percent may not be sufficient against all future shocks. In that vein, the Austrian position reflects the other side of the coin—exposure to books that have failed to recover post-crisis, in this case particularly in Eastern Europe. Close observation is certainly appropriate in that case.
Israel is the only country that has capital ratios notably under 10 percent. Although it has seen an increase over the past year, policymakers should ensure that improvements continue so that no wrong signals are created in what is still a very volatile world.
Beyond banks and capital
When looking at the top-ranked countries in the financial stability pillar (see Figure 2), it is clear that a linear ranking does not do the underlying dynamics justice. Why would Saudi Arabia score higher than Switzerland? Or Chile rank above Canada? Surely there is more going on than the ranking scale gives away. The remainder of this section outlines some of the nuances that underpin those scores and alludes to some of the considerations that might help players in those markets and policymakers who want to improve stability in their country.
Figure 2: Top 10 financial stability scores
Country/economy |
score |
Saudi Arabia |
6.32 |
|
|
Switzerland |
6.06 |
|
|
United Arab Emirates |
5.86 |
|
|
Singapore |
5.69 |
|
|
Norway |
5.69 |
|
|
Chile |
5.53 |
|
|
Hong Kong SAR |
5.51 |
|
|
Australia |
5.42 |
|
|
Malaysia |
5.40 |
|
|
Canada |
5.26 |
|
|
The financial stability score is a blended average of three subpillars: currency stability, banking system stability, and risk of sovereign debt crisis. This multivariate approach gives a better view of the dynamics underlying stability
in a complex real world than those that focus on a single variable, however carefully constructed. It is clear that the current economic cycle offers a stability premium to resource-rich nations, with both currency stability and
a strong fiscal position, which goes some way towards explaining the strong scores for Saudi Arabia, the United Arab Emirates, Norway, Australia, and, to some degree, Malaysia. It should be noted that currency movements in and by themselves do not correlate with financial stability in a linear fashion, as many smaller economies that have experienced episodic capital flows can attest.
However, other factors that are more under the control of policymakers also come into play. To highlight these factors, we segmented all countries covered by the Financial Development Report along a combination of the financial
16 | The Financial Development Report 2012

1.1: The Financial Development Index 2012
Box 3: A closer look at financial stability (continued)
Figure 3: Classification of countries by degree of financial sector liberalization with financial stability score
|
Conservative |
|
|
Transition |
|
|
|
liberal |
|
|
||||||
|
Early-stage |
|
|
Advancing |
|
|
|
|
|
|
|
|
|
|
|
|
|
Financial |
|
|
Financial |
|
|
|
|
|
European |
|
|
|
Non-European |
|
|
|
Markets |
|
|
Markets |
|
|
|
|
|
|
|
|
|
|
|
|
|
|
|
|
|
|
|
|
|
|
|
|
|
|
|
|
|
|
Tanzania |
5.17 |
|
Saudi Arabia |
6.32 |
|
United Arab Emirates |
5.86 |
|
Switzerland |
6.06 |
|
|
Singapore |
5.69 |
|
|
|
|
|
|
|
|
|
|
|
|
|
|
|
|
|
|
|
Peru |
4.96 |
|
Mexico |
5.19 |
|
Chile |
5.53 |
|
Norway |
5.69 |
|
|
Hong Kong SAR |
5.51 |
|
|
|
|
|
|
|
|
|
|
|
|
|
|
|
|
|
|
|
Czech Republic |
4.89 |
|
Brazil |
4.98 |
|
Malaysia |
5.40 |
|
Germany |
5.13 |
|
|
Australia |
5.42 |
|
|
|
|
|
|
|
|
|
|
|
|
|
|
|
|
|
|
|
Slovak Republic |
4.89 |
|
Kazakhstan |
4.51 |
|
Kuwait |
5.25 |
|
Denmark |
5.02 |
|
|
Canada |
5.26 |
|
|
|
|
|
|
|
|
|
|
|
|
|
|
|
|
|
|
|
Indonesia |
4.52 |
|
Poland |
4.42 |
|
South Africa |
5.12 |
|
Sweden |
4.97 |
|
|
Japan |
4.93 |
|
|
|
|
|
|
|
|
|
|
|
|
|
|
|
|
|
|
|
Colombia |
4.47 |
|
Russian Federation |
4.38 |
|
China |
5.06 |
|
Netherlands |
4.94 |
|
|
Israel |
4.83 |
|
|
|
|
|
|
|
|
|
|
|
|
|
|
|
|
|
|
|
Nigeria |
4.03 |
|
Bangladesh |
4.37 |
|
Finland |
4.99 |
|
Belgium |
4.73 |
|
|
United States |
4.41 |
|
|
|
|
|
|
|
|
|
|
|
|
|
|
|
|
|
|
|
Romania |
4.00 |
|
Morocco |
4.33 |
|
Panama |
4.58 |
|
Austria |
4.62 |
|
|
Jordan |
4.04 |
|
|
|
|
|
|
|
|
|
|
|
|
|
|
|
|
|
|
|
Venezuela |
3.58 |
|
India |
4.12 |
|
Thailand |
4.56 |
|
France |
4.35 |
|
|
|
|
|
|
|
|
|
|
|
|
|
|
|
|
|
|
|
|
|
|
|
Ghana |
3.31 |
|
Pakistan |
4.03 |
|
Bahrain |
4.23 |
|
United Kingdom |
4.31 |
|
|
|
|
|
|
|
|
|
|
|
|
|
|
|
|
|
|
|
|
|
|
|
Argentina |
3.18 |
|
Egypt |
3.92 |
|
Korea, Rep. |
4.20 |
|
Italy |
3.73 |
|
|
|
|
|
|
|
|
|
|
|
|
|
|
|
|
|
|
|
|
|
|
|
Ukraine |
3.16 |
|
Vietnam |
3.26 |
|
Philippines |
4.06 |
|
Ireland |
3.66 |
|
|
|
|
|
|
|
|
|
|
|
|
|
|
|
|
|
|
|
|
|
|
|
Kenya |
3.05 |
|
|
|
|
Hungary |
3.37 |
|
Spain |
3.57 |
|
|
|
|
|
|
|
|
|
|
|
|
|
|
|
|
|
|
|
|
|
|
|
|
|
|
|
|
|
Turkey |
3.29 |
|
Portugal |
2.85 |
|
|
|
|
|
|
|
|
|
|
|
|
|
|
|
|
|
|
|
|
|
|
|
|
|
|
|
|
|
|
|
|
Greece |
2.14 |
|
|
|
|
|
|
|
|
|
|
|
|
|
|
|
|
|
|
|
|
|
|
|
|
|
|
|
|
|
|
|
|
|
|
|
|
|
|
|
sector liberalization subpillar and the financial markets pillar. This combination measures both the freedom of the financial sector to innovate and the potential of that innovation to scale via developed markets. To the far left of the framework in Figure 3 are countries that have relatively early-stage financial markets (i.e., a 6th pillar score in the bottom quartile) and a conservative approach to the financial sector, with comparatively low liberalization scores. Such countries can still be comparatively stable, as in the case of Tanzania and Peru. At this stage of development, there are important trade-offs to be made in relation to external capital flows.1
Further along are countries that still have a conservative approach to the financial sector, but whose markets are more developed (i.e., a higher 6th pillar score). In many of those markets, the government plays a strong role, and they can be very stable, as evidenced by Saudi Arabia. Some of these countries have experienced significant crises in the past decades but have improved their financial systems since. As markets in this category often have sufficient scale to cope with external capital flows, policymakers need to consider at what stage they can further liberalize markets and grow the scaling potential of the local economy. Brazil is an interesting recent
case in which the government initially liberalized but had to apply the brakes repeatedly through capital controls and market interventions.
The middle category sees markets that are considerably on their way to liberalization of the financial sector. These make up a more diverse group. The United Arab Emirates shows how a resource-backed economy combined with a strong central regulator can create a high stability score, despite recent upheaval in one of its emirates. Chile’s evolution is frequently discussed in the literature. China’s approach is different, with a high emphasis on central planning, but its sheer size and growth potential add to its stability outlook.
Among the countries with the highest degree of liberalization, we have separated out the European instances to emphasize the impact of the recent euro zone crisis.
At the bottom of the stability list are the well-known peripheral economies, whose fate depends to some degree on a combination of their own structural reforms and German support. As evidenced by this group, once such a high degree of liberalization has been reached, fiscal sustainability becomes one of the key drivers of financial stability. But even in this category, capital flows cannot be overlooked, as the case of the Swiss currency over the recent year demonstrates.
Among non-European markets with the highest degree of liberalization, fiscal sustainability is again the key metric. The US position is largely explained by this fact, although it must be noted that the quantitative variables employed
The Financial Development Report 2012 | 17

1.1: The Financial Development Index 2012
Box 3: A closer look at financial stability (continued)
do not recognize the special position of the US dollar as |
Whereas capital flows in their various guises and |
|
the world’s reserve currency and the associated benefits |
compositions are among the key metrics to watch in |
|
this brings with regards to debt issuance and currency |
countries with less liberalized and scaled-up markets, |
|
stability. Thus, the stability ranking is likely lower than |
fiscal sustainability and debt become ever more important |
|
it would be if those factors were taken into account. |
for those countries with more liberal markets. Debt growth |
|
|
in significant excess of GDP has been identified as one |
|
While this is a more nuanced view than a linear ranking, |
of the key predictors for financial crises,3 and derived |
|
it still groups countries into relatively broad and simplistic |
stabilizers such as loan-to-value restrictions can be |
|
categories. We should therefore be careful not to infer too |
employed to great effect by policymakers. We will endeavor |
|
much from a detailed comparison of liberalization that is |
to include a related metric in future editions of the |
|
based on de jure indicators which might not be borne |
Financial Development Report. |
|
out de facto in the same way in different countries. |
|
|
This is particularly true for countries in the advancing and |
|
|
transition categories, where the simple framework |
Notes |
|
cannot adequately capture the complexity of real-world |
1 For further discussion, see Davies and Drexler 2010 |
|
development paths in economies of dramatically varying |
||
and De la Torre and Schmukler 2007. |
||
sizes, models, and geographies. |
||
|
||
|
2 Ranciere et al. 2008 find countries with occasional |
|
No easy answers |
financial crises growing faster on average than those |
|
with completely stable conditions. |
||
The analysis shows that, at all levels of market liberalization, |
||
|
||
high stability scores can be achieved—but they come |
3 For an overview of the related literature, |
|
with trade-offs. A liberal market operates in a dynamic |
see Cihak et al. 2012. |
|
equilibrium that can be threatened by shocks, bubbles, |
|
|
and external speculative flows. A more conservatively run |
|
|
market suffers less from those perils (though it is not |
Sources |
|
completely immune), but can hold back the access of the |
Cihak, M., A. Demirgüç-Kunt, E.H.B. Feyen, and R. Levine. |
|
local economy to much-needed expansion capital.2 |
||
2012. “Benchmarking Financial Systems Around the |
||
Figure 4 illustrates clearly that there are no easy answers |
||
World.” World Bank Policy Research Working Paper |
||
to such trade-offs. While more developed foreign |
||
No. 6175. Washington DC: World Bank. |
||
exchange markets do coincide somewhat with higher |
||
Davies, H. and M. Drexler. 2010. “Financial Development, |
||
currency stability, the overall correlation between these |
||
two variables is negligible. Markets can play a role in |
Capital Flows, and Capital Controls.” Financial |
|
stabilizing a currency (or a financial system), but other |
Development Report 2010. 31-46. |
|
factors are of at least equal importance. |
De la Torre, A. and S. Schmukler. 2007. Emerging Capital |
|
|
Markets and Globalization: The Latin American |
|
Figure 4: Correlation between currency stability |
Experience. Washington DC: World Bank. |
and foreign exchange market development |
Ranciere, R., A. Tornell, and F. Westermann. 2008. |
||||||
|
|
7 |
|
|
|
|
“Systemic Crises and Growth.” The Quarterly Journal |
|
EXCHANGEFOREIGNMARKETS |
6 |
|
|
|
|
of Economics 123 (1): 359-406. |
|
|
|
|
|
|
||
SUBPILLAR6A: |
5 |
|
|
|
|
|
|
4 |
|
|
|
|
|
||
|
|
3 |
|
|
|
R 2=0.0091 |
|
|
|
|
|
|
|
|
|
|
|
2 |
|
|
|
|
|
|
|
1 |
|
|
|
|
|
|
|
2 |
3 |
4 |
5 |
6 |
7 |
|
|
|
SUBPILLAR 3A: CURRENCY STABILITY |
|
|||
18 | The Financial Development Report 2012
1.1: The Financial Development Index 2012
four subpillars, IPO activity, experiences substantial change. When taking a closer look at the underlying variables, one can observe median year-over-year declines of 11 and 14 percent in the IPO market share and share of world IPOs indicators, respectively. Moreover, nearly 60 percent of countries in the sample declined across both of these indicators over the past year. These decreases are not particularly surprising, since one would expect it to be quite difficult for companies to list in the lingering post-crisis environment. The third variable in the subpillar, IPO proceeds amount, differs from the other two IPO indicators in that median IPO proceeds increased slightly at 1.6 percent.
Pockets of improvement emerge across the Index, especially in the banking system, for example, in the Tier 1 capital ratio and non-performing loans to total loans indicators in the banking system stability and banking efficiency index subpillars, respectively. Nevertheless, as indicators across IPO activity and equity market development show, equity markets remain stressed. This is a matter of potential concern, given the current environment and the need for sustainable growth. Empirical evidence suggests that stock market liquidity
is positively and significantly correlated with current and future rates of economic growth, capital accumulation, and productivity growth.52
Impact of the recent crisis on equity markets
The substantial movement across the majority of indicators underlying the IPO activity and equity market development subpillars warrants a closer examination of the variables over a multi-year period. Given the effects that IPO activity has on the overall equity market development indicators, we assess the IPO activity indicators in the context of changes to equity markets, rather than as isolated variables. Due to cross-country data availability, a small subset of our variables report numbers at a historic base year. This is the case for
our equity market development indicators, which are reported with 2010 as the base year. However, given the dynamism of stock markets, we supplement our analysis with more current data from the World Federation of Exchanges.53
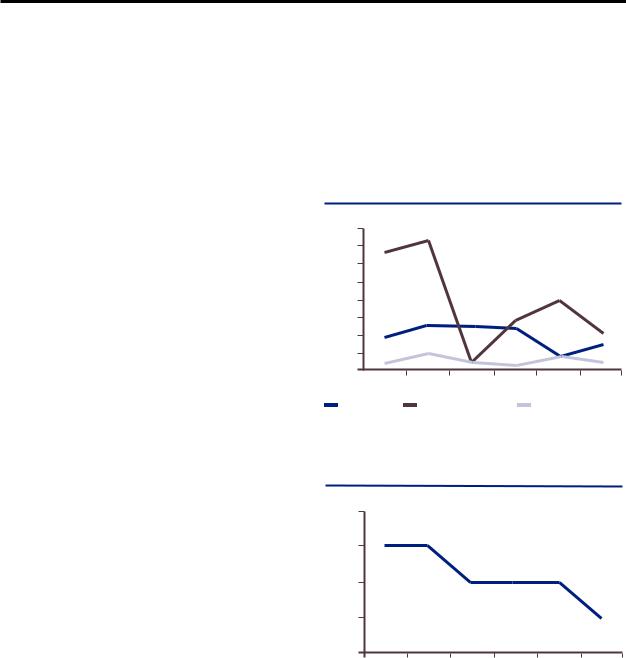
An overall analysis of the global equity market development and IPO activity indicators from 2006 to 2011 provides a general overview of how economies fared throughout the crisis. Figure 3 shows the results of three of the equity market development indicators: turnover velocity, domestic market capitalization to GDP, and value of shares trading to GDP. The most significant change occurred within the domestic market capitalization to GDP indicator, and the variable’s largest year-on-year decline took place from 2007 to 2008. This drop, occasioned by the crisis, was driven by two factors, among others: (1) during the crisis, it was more difficult for private companies to list on the stock exchanges, as can be
seen in the decline of number of companies listed (see Figure 4); and (2) valuations of shares declined (see value of shares trading to GDP in Figure 3), because many companies found themselves under strain. In line with expectations, domestic market capitalization recovered and increased from 2008
to 2009 and 2009 to 2010, before declining again from 2010 to 2011.
Figure 3: Equity market development indicators, median across country sample
Median Value
120 |
|
|
|
|
|
110 |
|
|
|
|
|
100 |
|
|
|
|
|
90 |
|
|
|
|
|
80 |
|
|
|
|
|
70 |
|
|
|
|
|
60 |
|
|
|
|
|
50 |
|
|
|
|
|
40 |
|
|
|
|
|
2006 |
2007 |
2008 |
2009 |
2010 |
2011 |
Turnover velocity |
Domestic market cap to GDP |
|
Value of shares trading to GDP |
||
Figure 4: Number of listed companies per 10,000 people, median across country sample
Median Value
0.15
0.14
0.13
0.12
2006 |
2007 |
2008 |
2009 |
2010 |
2011 |
Related to the number of companies listed and the value of shares trading are the IPO activity indicators, which are reported as a three-year average. The median for all three IPO indicators declined substantially from 2007-2009 to 2008-2010: 18 percent, 41 percent, and 49 percent for
IPO market share, IPO proceeds amount, and share of world IPOs, respectively. Thus, not only the number of IPOs, but also the amount at which they are listed, declined.
Interestingly, the turnover velocity indicator remained steady until its decline in 2010 (see Figure 3). This suggests that liquidity was available throughout the crisis, reflecting the effect of some government support systems. Although the indicator drops in 2010, it rebounds in 2011 and moves closer to 2006 levels, possibly indicating that liquidity is stabilizing.
The Financial Development Report 2012 | 19

1.1: The Financial Development Index 2012
A regional dissection of equity market development and IPO activity indicators may prove valuable, given that reactions to the crisis differed across regions, affecting how they emerged. Figure 5 shows that domestic market capitalization to GDP has decreased across most regions, with the exception of Asia/Pacific, where it has seen a minor increase since 2006. A similar picture can be seen in the number of companies listed per 10,000 people, although the declines are smaller. Asia/Pacific is the only region that increased in this indicator over the past five years. While the value of shares trading to GDP has seen a drop in Europe, the Middle East and North Africa, and North America, the Asia/Pacific and Latin America regions have increased their value of shares trading. The Asia/Pacific region, in particular, has experienced a considerable increase of 25 percent. In terms of turnover velocity, Figure 5 shows a decline for Europe and Latin America, indicating that there may be lingering liquidity issues. In contrast, Asia/Pacific, the Middle East and North Africa, and North America have seen only a minor increase, which suggests that liquidity levels in 2006 and 2011 are at similar levels.
Figure 5: Equity market indicators across regions, median percent change, 2006-2011
40%
20% |
0% |
-20%
-40%
-60%
-80% |
|
|
|
|
Latin |
|
Middle East |
|
North |
|
South |
|
|
|
|
|
|
|
|
||||||
|
Asia/Paci‚c |
Europe |
|
|
|
|
|
|||||
|
|
|
|
and |
|
|
||||||
|
America |
|
|
America |
|
Africa |
||||||
|
|
|
|
|
North Africa |
|
|
|||||
|
|
|
|
|
|
|
|
|
|
|
|
|
|
Turnover velocity |
|
|
|
|
Domestic market cap to GDP |
|
|
||||
|
Value of shares trading to GDP |
|
|
Number of listed shares to population |
|
|
||||||
Figure 6 shows the IPO activity indicators at a regional level over the period from 2006-2008 to 2009-2011. It is apparent that some of the changes in the equity market development subpillar were influenced by the decline in IPO activity across Europe, Latin America, and the Middle East and North Africa. For Asia/Pacific, results are more mixed, as there is an increase in IPO market share but a decrease in IPO proceeds amount. This suggests that Asia/Pacific’s decline in proceeds is less than the decline in many other regions, allowing the region to gain market share. North America also presents an interesting picture, as the positive values are driven by a spike in IPOs in Canada, which in 2010 had 25 offerings worth a combined value of US$5.2 billion.
Several regions have large stock exchanges—the United States, Japan, the United Kingdom, China, and Hong Kong
Figure 6: IPO activity indicators across regions, median change 2006-2008 to 2009-2011
150% |
100% |
50% |
0% |
-50% |
-100% |
|
|
|
|
|
Middle East |
|
|
|||
|
|
|
|
|
|
|
|||||
|
Asia/Paci‚c |
|
Europe |
Latin |
North |
South |
|||||
|
|
and |
|||||||||
|
|
America |
America |
Africa |
|||||||
|
|
|
|
|
North Africa |
||||||
|
|
|
|
|
|
|
|
|
|||
|
IPO market share |
|
|
IPO proceeds amount |
|
|
|
Share of world IPOs |
|||
account for over 50 percent of the world’s market capitalization (see Table 3). As the data suggest, a majority of the equity market development indicators are still declining in many
of these regions, warranting a closer examination of the countries that host the largest exchanges.
Table 3: Top stock exchanges by domestic market capitalization, 2011
|
|
|
|
Domestic market |
Share of |
Rank |
Stock exchange |
capitalization (US$ billions) |
the world |
||
|
|
|
|
|
|
1 |
NYSE |
|
11,795.6 |
25% |
|
|
|
|
|
|
|
2 |
NASDAQ |
|
3,845.1 |
8% |
|
3 |
Tokyo Stock Exchange |
|
3,325.4 |
7% |
|
|
|
|
|
||
4 |
London Stock Exchange |
3,266.4 |
7% |
||
5 |
Shanghai Stock Exchange |
2,357.4 |
5% |
||
|
|
|
|
||
6 |
Hong Kong Stock Exchange |
2,258.0 |
5% |
||
7 |
Toronto Stock Exchange |
|
1,912.1 |
4% |
|
|
|
|
|
|
|
8 |
BM&F Bovespa |
|
1,228.9 |
3% |
|
9 |
Australian Securities Exchange |
1,198.2 |
3% |
||
|
|
|
|
|
|
10 |
Deutsche Borse |
|
1,184.5 |
2% |
|
|
|
|
|
|
|
|
|
Rest of world |
|
15,075.6 |
32% |
|
|
Total |
|
47,447.2 |
100% |
|
|
|
|
|
|
Figure 7 shows that turnover velocity slightly increased from 2006 levels for all countries, except in the United Kingdom, where it is still 45 percent lower than in 2006. This is not particularly surprising, given the ongoing troubles in the euro zone and the lack of an obvious solution. From 2010 to 2011, turnover velocity decreased in China and the United Kingdom by
2 percent and 1 percent, respectively. The remaining three markets all experienced an increase over the past year.
Since 2006, domestic market capitalization to GDP has increased for both China and Hong Kong. In contrast, Japan, the United Kingdom, and the United States all experienced declines over the past five years. Interestingly, from 2010 to 2011, domestic market capitalization to GDP has fallen for all five economies, with China experiencing the largest decline, at 31 percent.
20 | The Financial Development Report 2012

1.1: The Financial Development Index 2012
Figure 7: Equity market indicators across top 5 stock exchanges
Figure 8: IPO activity indicators across top 5 stock exchanges
Turnover velocity |
IPO market share, percent of world IPO proceeds |
700 |
|
|
|
|
|
|
40 |
|
|
|
|
600 |
|
|
|
|
|
|
35 |
|
|
|
|
|
|
|
|
|
|
|
|
|
|
|
|
500 |
|
|
|
|
|
|
30 |
|
|
|
|
|
|
|
|
|
|
|
|
|
|
|
|
|
|
|
|
|
|
|
25 |
|
|
|
|
400 |
|
|
|
|
|
|
|
|
|
|
|
|
|
|
|
|
|
|
20 |
|
|
|
|
300 |
|
|
|
|
|
|
15 |
|
|
|
|
|
|
|
|
|
|
|
|
|
|
|
|
200 |
|
|
|
|
|
|
10 |
|
|
|
|
|
|
|
|
|
|
|
|
|
|
|
|
100 |
|
|
|
|
|
|
5 |
|
|
|
|
|
|
|
|
|
|
|
|
|
|
|
|
0 |
|
|
|
|
|
|
0 |
|
|
|
|
|
China |
Hong Kong |
Japan |
|
United |
United |
China |
Hong Kong |
Japan |
United |
United |
|
|
SAR |
|
|
Kingdom |
States |
|
SAR |
|
Kingdom |
States |
2006 |
2007 |
2008 |
2009 |
2010 |
2011 |
|
2006-2008 |
2007-2009 |
2008-2010 |
2009-2011 |
|
Domestic market capitization to GDP |
IPO proceeds amount, percent of GDP |
1300 |
|
|
|
|
|
|
6 |
|
|
|
|
1100 |
|
|
|
|
|
|
5 |
|
|
|
|
|
|
|
|
|
|
|
|
|
|
|
|
900 |
|
|
|
|
|
|
4 |
|
|
|
|
|
|
|
|
|
|
|
|
|
|
|
|
700 |
|
|
|
|
|
|
|
|
|
|
|
|
|
|
|
|
|
|
3 |
|
|
|
|
500 |
|
|
|
|
|
|
|
|
|
|
|
300 |
|
|
|
|
|
|
2 |
|
|
|
|
|
|
|
|
|
|
|
|
|
|
|
|
100 |
|
|
|
|
|
|
1 |
|
|
|
|
-100 |
China |
Hong Kong |
|
Japan |
United |
United |
0 |
|
|
|
|
|
|
China |
Hong Kong |
Japan |
United |
United |
|||||
|
|
SAR |
|
|
Kingdom |
States |
|
SAR |
|
Kingdom |
States |
2006 |
2007 |
2008 |
2009 |
2010 |
2011 |
|
2006-2008 |
2007-2009 |
2008-2010 |
2009-2011 |
|
Value of shares trading to GDP
1000 |
|
|
|
|
|
|
900 |
|
|
|
|
|
|
800 |
|
|
|
|
|
|
700 |
|
|
|
|
|
|
600 |
|
|
|
|
|
|
500 |
|
|
|
|
|
|
400 |
|
|
|
|
|
|
300 |
|
|
|
|
|
|
200 |
|
|
|
|
|
|
100 |
|
|
|
|
|
|
0 |
|
|
|
|
|
|
|
China |
Hong Kong |
Japan |
|
United |
United |
|
|
SAR |
|
|
Kingdom |
States |
2006 |
2007 |
2008 |
2009 |
2010 |
2011 |
|
Share of worlds IPOs, percent of total global number of issues
35 |
|
|
|
|
30 |
|
|
|
|
25 |
|
|
|
|
20 |
|
|
|
|
15 |
|
|
|
|
10 |
|
|
|
|
5 |
|
|
|
|
0 |
|
|
|
|
China |
Hong Kong |
Japan |
United |
United |
|
SAR |
|
Kingdom |
States |
2006-2008 |
2007-2009 |
2008-2010 |
2009-2011 |
|
Number of listed companies per 10,000 people
2.5
2.0 |
|
|
|
|
|
|
1.5 |
|
|
|
|
|
|
1.0 |
|
|
|
|
|
|
0.5 |
|
|
|
|
|
|
0.0 |
|
|
|
|
|
|
|
China |
Hong Kong |
Japan |
|
United |
United |
|
|
SAR |
|
|
Kingdom |
States |
2006 |
2007 |
2008 |
2009 |
2010 |
2011 |
|
The Financial Development Report 2012 | 21

1.1: The Financial Development Index 2012
Whereas the value of shares trading to GDP has increased substantially in China and Hong Kong since 2006 (109 percent and 49 percent, respectively), the United Kingdom has seen only a modest increase of 2 percent (see Figure 7). Over the same period, Japan and the United States declined 47 and 16 percent, respectively. Looking only at the year- over-year change from 2010 to 2011, it is clear that all five economies have experienced a decrease in the value trading relative to GDP. China and Hong Kong experienced the largest declines, at 34 percent and 11 percent, respectively.
A similar picture presents itself for the number of listed companies per 10,000 people. China and Hong Kong have both increased since 2006 (61 percent and 24 percent, respectively), while the other three economies have declined, with the United Kingdom experiencing the largest decrease, of 14 percent. Year-on-year changes see a continuation of China and Hong Kong increasing, and Japan, the United Kingdom, and the United States declining.
Many of these changes are in line with the movement seen across the IPO activity indicators. Figure 8 shows a decline in all three indicators for Japan, the United Kingdom, and the United States from 2006-2008 to 2009-2011. While both China and Hong Kong increased in IPO market share, China experienced a slight decline of 4 percent for IPO proceeds amount, while Hong Kong saw an increase of 81 percent. This picture reverses itself in the share of world IPO indicator; China more than doubled, while Hong Kong decreased by 32 percent.
The results discussed above indicate that liquidity is stabilizing across the countries that host the world’s major stock markets, with the exception of the United Kingdom. Nevertheless, domestic market capitalization to GDP is still declining in three of the five countries examined. Among the factors that influence this drop are declines in value of shares trading to GDP, the number of listed companies per 10,000 people, and the IPO activity indicators. Policymakers should be mindful
of these weaknesses and take concerted action if conditions continue to deteriorate.
Regional analysis
While some high-level trends were highlighted earlier, it is at the country level that some of the potentially most useful findings of the Report can be seen. The Country Profiles
contained in Part 2 provide detailed information with which to undertake this analysis. A summary of highlights, by region, are presented below.
ASIA AND THE PACIFIC
Hong Kong SAR maintains the top spot in the 2012 Financial Development Index. In terms of factors, policies, and institutions,
Hong Kong scores quite high in the business environment (2nd) pillar. Areas of particular strength include the taxes (3rd) and infrastructure (1st) subpillars. In the financial stability pillar (8th), Hong Kong has fallen four spots. This can be partially attributed to a drop in rank and score in the risk of sovereign debt crisis (10th) subpillar. More specifically, Hong Kong showed weakness in the aggregate macroeconomic indicator (44th), as well as in manageability of public debt (22nd). With regards to financial intermediation, Hong Kong benefits from both a large (2nd) and efficient (1st) banking system. Despite these areas of considerable strength, Hong Kong does show relative weakness in non-banking financial services (10th), particularly the securitization (25th) subpillar. Hong Kong fell three spots in the financial access (4th) pillar. While commercial access to capital (1st) remains very strong, retail access (18th) is a clear area for improvement.
Although Singapore (4th) maintained its position in this year’s Index, the country did experience an increase in overall score. Singapore showed improvement in the financial stability
pillar (3rd), moving up five spots. Singapore’s stable currency system (2nd) is driven by strong results in the current account balance to GDP (2nd), net international investment position to GDP (2nd), and dollarization vulnerability indicator variables (1st). Although Singapore has exhibited strong results in banking financial services (10th), the country does show weakness in the financial information disclosure (32nd) subpillar. In terms of financial intermediation, Singapore scores best in the financial markets (3rd) pillar. The country has highly developed foreign exchange (4th), derivatives (5th), and equity markets (2nd). Despite these areas of strength, Singapore lacks a well-developed bond market (25th). Financial access (14th) scores are mixed, with Singapore scoring high in terms of commercial access to capital (2nd) but quite low with regards to retail access (31st).
Australia has, for the third year in a row, finished behind Singapore, at 5th place. Although Australia did not experience considerable changes at the Index level, the country did exhibit some positive developments in the pillars and subpillars. For instance, Australia has improved in terms of financial stability (9th), moving up four spots. The change is due in part to increased banking system stability (9th). Financial intermediation continues to be area of strength, with Australia scoring high across the non-banking financial services (5th), banking financial services (7th), and financial markets (8th) pillars. Although improvements in the M&A activity (3rd), insurance (12th), and securitization (8th) subpillars provided
a boon to Australia’s non-banking financial services results, the country experienced a slight decrease in score in the IPO activity (11th) subpillar. Australia’s decline of four spots in the financial access (6th) pillar is driven primarily by weakness
22 | The Financial Development Report 2012

1.1: The Financial Development Index 2012
in retail access (5th), specifically the comparatively low number of commercial bank branches (13th) and debit card penetration (11th).
Japan’s 7th place rank, up one spot from last year, is bolstered by strong scores in the banking financial services (3rd), non-banking financial services (6th), and financial markets (5th) pillars. While Japan’s banking system is both large (3rd) and efficient (5th), the country lags in terms of financial information disclosure (17th). The country’s business environment (19th) is also relatively weak by developed country standards. Comparatively speaking, Japan suffers from a weak human capital (19th) pool, a less-than-optimal tax regime (24th), and a high cost of doing business (20th). Despite these areas of relative weakness, Japan benefits from having highly developed foreign exchange (3rd) and derivatives markets (6th). Financial access continues to be a development disadvantage for Japan. The country’s commercial access (36th) scores fell sharply because of declines in the ease of access to credit (20th), financing
through local equity market (14th), and foreign direct investment to GDP (60th) indicators.
After rising six spots in 2011, the Republic of Korea (15th) continues to show improvement, moving up three spots in this year’s Index. Korea benefitted from positive developments in the financial access (22nd) pillar. Although Korea ranks quite low in commercial access (58th), the country does have a development advantage in retail access (13th). Korea exhibits particular strength in the total number of ATMs (1st) and loan from financial institution (13th) indicators. In terms of factors, policies, and institutions, Korea shows signs of weakness in the institutional environment (34th) and financial stability (44th) pillars. Specifically, Korea has declined four spots in the financial sector liberalization (43rd) subpillar,
and three spots in the currency stability (42nd) subpillar. Nevertheless, Korea offsets these weak results with
a strong performance across financial intermediation, particularly the non-banking financial services (2nd) and financial markets (14th) pillars.
Malaysia fell two spots, to 18th, in part because of a decline in the financial stability (10th) pillar. Driving this change was increasing currency (3rd) and banking system instability (29th). Malaysia also experienced a nine-spot decline in financial access (28th), which can be attributed to weakness in retail access (35th) scores. Specifically, Malaysia scores relatively low in the number of commercial bank branches (37th) and debit card penetration (42nd). Despite these limitations, Malaysia benefits from a high degree of financial information disclosure (2nd), robust IPO activity (5th), and a well-developed bond market (12th).
China fell four spots in the 2012 Financial Development Index, placing 23rd overall. The decline can be attributed to a decrease in scores in the banking financial services (17th) and financial access (41st) pillars. These changes are due, in part, to greater banking system instability (55th) and by weak results in both the commercial (37th) and retail access (38th) subpillars. China also experienced declines of 11, five, and seven spots in the insurance (15th), bond market development (24th), and financial sector liberalization (44th) subpillars, respectively. Despite these areas of weakness, China retains development advantages across a number
of pillars and subpillars. China scores particularly high in non-banking financial services (4th), with IPO (1st) and M&A activity (5th) being especially robust. Still, there is considerable room to improve China’s business environment (47th), which remains the country’s worst-performing pillar.
Thailand moves up one spot to place 34th this year. Thailand’s financial markets (33rd) and financial access (25th) pillars experienced the greatest change, rising seven and
13 spots, respectively. The changes were due to strong results in the equity market development (23rd) and retail access (25th) subpillars. Like a number of other Asian economies, Thailand performs quite well across the financial intermediation pillars. Thailand’s banking system increased in both size (24th) and efficiency (17th) this year. In addition, strong M&A activity (38th) provided a boon to the country’s non-banking financial services (42nd) pillar score. Although these improvements suggest that Thailand is making strides in financial development, there are still several areas of concern, namely, a decrease in financial stability (34th) driven by an increase in the risk of sovereign debt crisis (35th) and banking system instability (56th).
India ranks 40th in the 2012 Index, a four-spot decline from last year. Weak results in the institutional (56th) and business environment (55th) pillars continue to be driven by an inability to enforce contracts (60th), a low degree of financial sector liberalization (58th), inadequate infrastructure (58th), and a high cost of doing business (56th). Although its factors, policies, and institutions are quite weak, India did experience a slight improvement in the financial stability pillar (46th). The change was due to score improvements across the currency stability (16th) and risk of sovereign debt crisis (47th) subpillars. India’s financial intermediation results are mixed. While India ranks quite high in non-banking financial services (9th), banking financial services (45th) are an area for improvement. Financial access (45th) results are also inconsistent, with India having a development advantage in the commercial access (25th) subpillar but a development disadvantage in the retail access (51st) subpillar. India’s neighbor to the north, Pakistan (58th), shows weakness across the majority of the pillars in the Index. As is the case with India, the country’s institutional (58th) and
The Financial Development Report 2012 | 23

1.1: The Financial Development Index 2012
business environments (58th) are highly underdeveloped. In addition, Pakistan has experienced relatively steep declines in both the commercial (51st) and retail access (59th) subpillars. Still, this year’s Index results indicate some signs of improvement. Pakistan’s jump in the financial stability pillar (50th) was primarily due to increased banking system stability (22nd).
Kazakhstan (47th) fell one spot because of weakness in financial intermediation. Specifically, Kazakhstan’s rank declined five, six, and eight spots in the banking financial services (55th), non-banking financial services (28th), and financial markets (44th) pillars, respectively. Kazakhstan’s
banking system decreased in size (54th) and efficiency (56th), M&A activity (24th) slowed down, and the country’s equity market (54th) took a hit to its level of development. These declines were offset by improvements in banking system stability (36th), IPO activity (45th), and commercial access (39th). In addition, Kazakhstan rose eight spots in the corporate governance (41st) subpillar because of positive developments across a number of indicators, most notably the efficacy of corporate boards (23rd), reliance on professional management (48th), and ethical behavior of firms (37th).
The Philippines was unable to continue its impressive climb up the rankings, falling five spots to 49th this year. The biggest change occurred in banking financial services (49th), where the Philippines fell 11 and 12 spots in the size (44th) and efficiency (33rd) indices, respectively. The Philippines also slipped in currency stability (32nd) because of significant weakness in the change in real effective exchange rate (52nd) indicator. Nevertheless, positive developments can be seen in the country’s institutional (39th) and business environment (54th) pillar results. Over the past year, the Philippines exhibited improvement in the corporate governance (27th), legal and regulatory issues (48th), human capital (42nd), and taxes (41st) subpillars. Financial access (53rd), particularly retail access (48th), remains an area for improvement.
As in 2011, Indonesia (50th), Vietnam (52nd), and Bangladesh (57th) all place near the bottom of the Financial Development Index. While Indonesia moved up one spot, Vietnam and Bangladesh fell two spots and one spot, respectively. All three countries continue to score quite low in the institutional and business environment pillars. Vietnam’s position in these pillars has worsened as the country dropped 10 and 13 spots in the legal and regulatory issues (52nd) and infrastructure (50th) subpillars, respectively. Indonesia likewise experienced a considerable drop in the legal and regulatory issues subpillar (41st), falling seven spots. Despite these weaknesses, Indonesia, Vietnam, and Bangladesh improved in financial intermediation. Vietnam and Bangladesh saw significant jumps in the financial markets subpillar (37th and
41st, respectively), and Indonesia saw minor improvement in non-banking financial services (23rd). All three countries experienced rank declines in the financial access pillar, with Vietnam and Bangladesh dropping the most, at 13 and 15 spots, respectively.
EUROPE AND NORTH AMERICA
The United States places 2nd overall for the second consecutive year. The United States continues to be the world leader in both non-banking financial services (1st) and financial markets (1st). It holds the top position across a number of financial intermediation-related subpillars, including: insurance, securitization, foreign exchange markets, and derivatives markets. Although there was little movement within these pillars, the United States did show slight improvement in equity (5th) and bond market development (3rd). Nevertheless, the United States remains comparatively weak in terms of factors, policies, and institutions. While it made a strong jump in financial sector liberalization (1st), the country saw a minor setback in the business environment pillar (13th), primarily because of an inefficient tax regime (30th). Financial stability (38th) continues to be the area of greatest weakness for the United States. However, it should be noted that the country exhibited an improvement in its banking system stability (40th) score, which may indicate
a shift in the right direction. With regard to financial access (5th), the United States exhibits mixed results. Whereas retail access (4th) scores are quite strong, commercial access (17th) results are comparatively weak.
Like the United States, the United Kingdom (3rd) maintains its position in the 2012 Financial Development Index. The United Kingdom’s strength resides primarily in the financial intermediation pillars—banking financial services, non-banking financial services, and financial markets. Although the United Kingdom’s banking financial services (2nd) are highly developed, the country experienced a five-spot decline in the efficiency index (23rd). This decrease was balanced by improvements in other areas of financial intermediation, such as securitization (4th) and equity market development (9th), which saw jumps in rank of eight and 10 spots, respectively. The United Kingdom’s strong institutional (2nd) and business environment (8th) is attributable to a liberalized financial sector (1st), an ability to effectively enforce contracts (3rd),
a strong legal and regulatory framework (6th), and welldeveloped infrastructure (7th). While the United Kingdom still suffers from financial instability (43rd), the country has shown improvement in the banking system stability (44th) subpillar.
Canada, which ranks 6th overall for the third consecutive year, ranks quite high across most pillars. Canada is particularly strong in factors, policies, and institutions, ranking 6th and
24 | The Financial Development Report 2012