

The Financial Development report 2012
.pdf2.11
Quality of overall infrastructure
How would you assess general infrastructure (e.g., transport, telephony, and energy) in your country? (1 = Extremely underdeveloped;
7 = Extensive and efficient by international standards) | 2011–2012 weighted average
Rank |
Country/economy |
value 1 |
MEAN 4.83 |
7 |
||
1 |
Switzerland |
6.64 |
|
|
|
|
|
|
|
|
|||
|
|
|
|
|||
2 |
Singapore |
6.54 |
|
|
|
|
|
|
|
|
|||
3 |
Finland |
6.52 |
|
|
|
|
|
|
|
|
|||
4 |
Hong Kong SAR |
6.46 |
|
|
|
|
|
|
|
|
|||
5 |
France |
6.41 |
|
|
|
|
|
|
|
|
|||
6 |
United Arab Emirates |
6.37 |
|
|
|
|
|
|
|
|
|||
7 |
Austria |
6.30 |
|
|
|
|
|
|
|
|
|||
8 |
Germany |
6.23 |
|
|
|
|
|
|
|
|
|||
9 |
Netherlands |
6.21 |
|
|
|
|
|
|
|
|
|||
10 |
Portugal |
6.17 |
|
|
|
|
|
|
|
|
|||
11 |
Denmark |
6.02 |
|
|
|
|
|
|
|
|
|||
12 |
Bahrain |
6.01 |
|
|
|
|
|
|
|
|
|||
13 |
Canada |
5.97 |
|
|
|
|
|
|
|
|
|||
14 |
Japan |
5.94 |
|
|
|
|
|
|
|
|
|||
15 |
Belgium |
5.87 |
|
|
|
|
|
|
|
|
|||
16 |
Spain |
5.84 |
|
|
|
|
|
|
|
|
|||
17 |
Sweden |
5.80 |
|
|
|
|
|
|
|
|
|||
18 |
Korea, Rep |
5.76 |
|
|
|
|
|
|
|
|
|||
19 |
Saudi Arabia |
5.76 |
|
|
|
|
|
|
|
|
|||
20 |
..................United Kingdom |
5.63 |
|
|
|
|
21 |
......................United States |
5.62 |
|
|
|
|
22 |
...................Czech Republic |
5.47 |
|
|
|
|
23 |
..............................Malaysia |
5.44 |
|
|
|
|
24 |
...................................Chile |
5.39 |
|
|
|
|
25 |
.................................Turkey |
5.26 |
|
|
|
|
26 |
..............................Australia |
5.24 |
|
|
|
|
27 |
.................................Ireland |
5.24 |
|
|
|
|
28 |
...............................Norway |
5.20 |
|
|
|
|
29 |
................................Jordan |
5.13 |
|
|
|
|
30 |
..............................Panama |
5.06 |
|
|
|
|
31 |
...................................Israel |
5.01 |
|
|
|
|
32 |
..............................Thailand |
4.86 |
|
|
|
|
33 |
..............................Hungary |
4.82 |
|
|
|
|
34 |
.............................Morocco |
4.75 |
|
|
|
|
35 |
...............................Ukraine |
4.59 |
|
|
|
|
36 |
........................South Africa |
4.51 |
|
|
|
|
37 |
................................Kuwait |
4.48 |
|
|
|
|
38 |
................................Greece |
4.46 |
|
|
|
|
39 |
................................Mexico |
4.41 |
|
|
|
|
40 |
..................................China |
4.28 |
|
|
|
|
41 |
Slovak Republic |
4.27 |
|
|
|
|
|
|
|
|
|||
42 |
Kazakhstan |
4.14 |
|
|
|
|
|
|
|
|
|||
43 |
................................Poland |
3.99 |
|
|
|
|
44 |
.................................Kenya |
3.98 |
|
|
|
|
45 |
.....................................Italy |
3.94 |
|
|
|
|
46 |
.................................Ghana |
3.86 |
|
|
|
|
47 |
....................................India |
3.81 |
|
|
|
|
48 |
..................................Egypt |
3.81 |
|
|
|
|
49 |
Indonesia |
3.74 |
|
|
|
|
|
|
|
|
|||
50 |
Philippines |
3.64 |
|
|
|
|
|
|
|
|
|||
51 |
Russian Federation |
3.50 |
|
|
|
|
|
|
|
|
|||
52 |
Pakistan |
3.40 |
|
|
|
|
|
|
|
|
|||
53 |
Brazil |
3.39 |
|
|
|
|
|
|
|
|
|||
54 |
Colombia |
3.38 |
|
|
|
|
|
|
|
|
|||
55 |
Peru |
3.37 |
|
|
|
|
|
|
|
|
|||
56 |
Argentina |
3.36 |
|
|
|
|
|
|
|
|
|||
57 |
Nigeria |
3.23 |
|
|
|
|
|
|
|
|
|||
58 |
Vietnam |
3.23 |
|
|
|
|
|
|
|
|
|||
59 |
Tanzania |
3.10 |
|
|
|
|
|
|
|
|
|||
60 |
Bangladesh |
2.84 |
|
|
|
|
|
|
|
|
|||
61 |
Romania |
2.83 |
|
|
|
|
|
|
|
|
|||
62 |
Venezuela |
2.79 |
|
|
|
|
|
|
|
|
|||
|
|
|
|
|
|
|
SOURCE: World Economic Forum, Executive Opinion Survey, 2011–2012
3: Data Tables | Business environment
2.12
Quality of electricity supply
How would you assess the quality of the electricity supply in your country (lack of interruptions and lack of voltage fluctuations)? (1 = Insufficient and suffers frequent interruptions; 7 = Sufficient and reliable) | 2011–2012 weighted average
Rank |
Country/economy |
value 1 |
MEAN 5.21 7 |
||||||
1 |
Netherlands |
6.80 |
|
|
|
|
|
|
|
|
|
|
|
|
|
|
|||
|
|
|
|
|
|
|
|||
2 |
Hong Kong SAR |
6.76 |
|
|
|
|
|
|
|
|
|
|
|
|
|
|
|||
3 |
Switzerland |
6.76 |
|
|
|
|
|
|
|
|
|
|
|
|
|
|
|||
4 |
Denmark |
6.76 |
|
|
|
|
|
|
|
|
|
|
|
|
|
|
|||
5 |
Singapore |
6.73 |
|
|
|
|
|
|
|
|
|
|
|
|
|
|
|||
6 |
Austria |
6.72 |
|
|
|
|
|
|
|
|
|
|
|
|
|
|
|||
7 |
United Kingdom |
6.69 |
|
|
|
|
|
|
|
|
|
|
|
|
|
|
|||
8 |
France |
6.66 |
|
|
|
|
|
|
|
|
|
|
|
|
|
|
|||
9 |
Finland |
6.60 |
|
|
|
|
|
|
|
|
|
|
|
|
|
|
|||
10 |
Sweden |
6.59 |
|
|
|
|
|
|
|
|
|
|
|
|
|
|
|||
11 |
Belgium |
6.57 |
|
|
|
|
|
|
|
|
|
|
|
|
|
|
|||
12 |
Canada |
6.56 |
|
|
|
|
|
|
|
|
|
|
|
|
|
|
|||
13 |
Czech Republic |
6.52 |
|
|
|
|
|
|
|
|
|
|
|
|
|
|
|||
14 |
Norway |
6.51 |
|
|
|
|
|
|
|
|
|
|
|
|
|
|
|||
15 |
Ireland |
6.51 |
|
|
|
|
|
|
|
|
|
|
|
|
|
|
|||
16 |
Germany |
6.41 |
|
|
|
|
|
|
|
|
|
|
|
|
|
|
|||
17 |
United Arab Emirates |
6.39 |
|
|
|
|
|
|
|
|
|
|
|
|
|
|
|||
18 |
Saudi Arabia |
6.35 |
|
|
|
|
|
|
|
|
|
|
|
|
|
|
|||
19 |
Bahrain |
6.32 |
|
|
|
|
|
|
|
|
|
|
|
|
|
|
|||
20 |
..................Slovak Republic |
6.28 |
|
|
|
|
|
|
|
21 |
..............................Portugal |
6.28 |
|
|
|
|
|
|
|
22 |
..............................Australia |
6.26 |
|
|
|
|
|
|
|
23 |
..................................Spain |
6.10 |
|
|
|
|
|
|
|
24 |
.........................Korea, Rep |
6.02 |
|
|
|
|
|
|
|
25 |
......................United States |
6.02 |
|
|
|
|
|
|
|
26 |
..............................Malaysia |
5.88 |
|
|
|
|
|
|
|
27 |
.................................Japan |
5.86 |
|
|
|
|
|
|
|
28 |
.....................................Italy |
5.75 |
|
|
|
|
|
|
|
29 |
................................Jordan |
5.74 |
|
|
|
|
|
|
|
30 |
..............................Hungary |
5.66 |
|
|
|
|
|
|
|
31 |
..............................Panama |
5.50 |
|
|
|
|
|
|
|
32 |
..............................Thailand |
5.49 |
|
|
|
|
|
|
|
33 |
................................Poland |
5.47 |
|
|
|
|
|
|
|
34 |
...................................Israel |
5.46 |
|
|
|
|
|
|
|
35 |
...................................Chile |
5.36 |
|
|
|
|
|
|
|
36 |
.............................Morocco |
5.24 |
|
|
|
|
|
|
|
37 |
................................Greece |
5.22 |
|
|
|
|
|
|
|
38 |
..................................China |
5.20 |
|
|
|
|
|
|
|
39 |
............................Colombia |
5.06 |
|
|
|
|
|
|
|
40 |
................................Kuwait |
5.03 |
|
|
|
|
|
|
|
41 |
Brazil |
4.94 |
|
|
|
|
|
|
|
|
|
|
|
|
|
|
|||
42 |
Peru |
4.81 |
|
|
|
|
|
|
|
|
|
|
|
|
|
|
|||
43 |
.................................Turkey |
4.64 |
|
|
|
|
|
|
|
44 |
...............................Ukraine |
4.58 |
|
|
|
|
|
|
|
45 |
................................Mexico |
4.56 |
|
|
|
|
|
|
|
46 |
.........................Kazakhstan |
4.45 |
|
|
|
|
|
|
|
47 |
..................................Egypt |
4.43 |
|
|
|
|
|
|
|
48 |
.............Russian Federation |
4.33 |
|
|
|
|
|
|
|
49 |
Romania |
4.18 |
|
|
|
|
|
|
|
|
|
|
|
|
|
|
|||
50 |
Indonesia |
3.91 |
|
|
|
|
|
|
|
|
|
|
|
|
|
|
|||
51 |
South Africa |
3.90 |
|
|
|
|
|
|
|
|
|
|
|
|
|
|
|||
52 |
Philippines |
3.73 |
|
|
|
|
|
|
|
|
|
|
|
|
|
|
|||
53 |
Kenya |
3.62 |
|
|
|
|
|
|
|
|
|
|
|
|
|
|
|||
54 |
Argentina |
3.48 |
|
|
|
|
|
|
|
|
|
|
|
|
|
|
|||
55 |
India |
3.24 |
|
|
|
|
|
|
|
|
|
|
|
|
|
|
|||
56 |
Vietnam |
3.14 |
|
|
|
|
|
|
|
|
|
|
|
|
|
|
|||
57 |
Ghana |
2.97 |
|
|
|
|
|
|
|
|
|
|
|
|
|
|
|||
58 |
Pakistan |
2.27 |
|
|
|
|
|
|
|
|
|
|
|
|
|
|
|||
59 |
Venezuela |
2.00 |
|
|
|
|
|
|
|
|
|
|
|
|
|
|
|||
60 |
Tanzania |
1.93 |
|
|
|
|
|
|
|
|
|
|
|
|
|
|
|||
61 |
Bangladesh |
1.79 |
|
|
|
|
|
|
|
|
|
|
|
|
|
|
|||
62 |
Nigeria |
1.69 |
|
|
|
|
|
|
|
|
|
|
|
|
|
|
|||
|
|
|
|
|
|
|
|
|
|
SOURCE: World Economic Forum, Executive Opinion Survey, 2011–2012
The Financial Development Report 2012 | 335

3: Data Tables | Business environment
2.13
Internet users
This variable is the percent of individuals using the Internet | 2011
Rank |
Country/economy |
value |
|
|
|
|
|
|
|
|
|
|
1 |
Norway |
93.97 |
|
|
|
|
|
|
|
|
|
|
|
|
|
|
|
|
|
|
|
|
|||
|
|
|
|
|
|
|
|
|
|
|||
2 |
Netherlands |
92.30 |
|
|
|
|
|
|
|
|
|
|
|
|
|
|
|
|
|
|
|
|
|||
3 |
Sweden |
91.00 |
|
|
|
|
|
|
|
|
|
|
|
|
|
|
|
|
|
|
|
|
|||
4 |
Denmark |
90.00 |
|
|
|
|
|
|
|
|
|
|
|
|
|
|
|
|
|
|
|
|
|||
5 |
Finland |
89.37 |
|
|
|
|
|
|
|
|
|
|
|
|
|
|
|
|
|
|
|
|
|||
6 |
Switzerland |
85.20 |
|
|
|
|
|
|
|
|
|
|
|
|
|
|
|
|
|
|
|
|
|||
7 |
Korea, Rep |
83.80 |
|
|
|
|
|
|
|
|
|
|
|
|
|
|
|
|
|
|
|
|
|||
8 |
Canada |
83.00 |
|
|
|
|
|
|
|
|
|
|
|
|
|
|
|
|
|
|
|
|
|||
8 |
Germany |
83.00 |
|
|
|
|
|
|
|
|
|
|
|
|
|
|
|
|
|
|
|
|
|||
10 |
United Kingdom |
82.00 |
|
|
|
|
|
|
|
|
|
|
|
|
|
|
|
|
|
|
|
|
|||
11 |
Austria |
79.80 |
|
|
|
|
|
|
|
|
|
|
|
|
|
|
|
|
|
|
|
|
|||
12 |
France |
79.58 |
|
|
|
|
|
|
|
|
|
|
|
|
|
|
|
|
|
|
|
|
|||
13 |
Japan |
79.53 |
|
|
|
|
|
|
|
|
|
|
|
|
|
|
|
|
|
|
|
|
|||
14 |
Australia |
79.00 |
|
|
|
|
|
|
|
|
|
|
|
|
|
|
|
|
|
|
|
|
|||
15 |
Belgium |
78.00 |
|
|
|
|
|
|
|
|
|
|
|
|
|
|
|
|
|
|
|
|
|||
16 |
United States |
77.86 |
|
|
|
|
|
|
|
|
|
|
|
|
|
|
|
|
|
|
|
|
|||
17 |
Bahrain |
77.00 |
|
|
|
|
|
|
|
|
|
|
|
|
|
|
|
|
|
|
|
|
|||
18 |
Ireland |
76.82 |
|
|
|
|
|
|
|
|
|
|
|
|
|
|
|
|
|
|
|
|
|||
19 |
Singapore |
75.00 |
|
|
|
|
|
|
|
|
|
|
|
|
|
|
|
|
|
|
|
|
|||
20 |
...............Hong Kong SAR |
74.50 |
|
|
|
|
|
|
|
|
|
|
21 |
................Slovak Republic |
74.44 |
|
|
|
|
|
|
|
|
|
|
22 |
..............................Kuwait |
74.20 |
|
|
|
|
|
|
|
|
|
|
23 |
.................Czech Republic |
72.97 |
|
|
|
|
|
|
|
|
|
|
24 |
.................................Israel |
70.00 |
|
|
|
|
|
|
|
|
|
|
24 |
........United Arab Emirates |
70.00 |
|
|
|
|
|
|
|
|
|
|
26 |
................................Spain |
67.60 |
|
|
|
|
|
|
|
|
|
|
27 |
..............................Poland |
64.88 |
|
|
|
|
|
|
|
|
|
|
28 |
............................Malaysia |
61.00 |
|
|
|
|
|
|
|
|
|
|
29 |
............................Hungary |
59.00 |
|
|
|
|
|
|
|
|
|
|
30 |
...................................Italy |
56.80 |
|
|
|
|
|
|
|
|
|
|
31 |
............................Portugal |
55.30 |
|
|
|
|
|
|
|
|
|
|
32 |
.................................Chile |
53.89 |
|
|
|
|
|
|
|
|
|
|
33 |
..............................Greece |
53.00 |
|
|
|
|
|
|
|
|
|
|
34 |
...........................Morocco |
51.00 |
|
|
|
|
|
|
|
|
|
|
35 |
...........Russian Federation |
49.00 |
|
|
|
|
|
|
|
|
|
|
36 |
..........................Argentina |
47.70 |
|
|
|
|
|
|
|
|
|
|
37 |
.....................Saudi Arabia |
47.50 |
|
|
|
|
|
|
|
|
|
|
38 |
.................................Brazil |
45.00 |
|
|
|
|
|
|
|
|
|
|
38 |
.......................Kazakhstan |
45.00 |
|
|
|
|
|
|
|
|
|
|
40 |
...........................Romania |
44.02 |
|
|
|
|
|
|
|
|
|
|
41 |
Panama |
42.70 |
|
|
|
|
|
|
|
|
|
|
|
|
|
|
|
|
|
|
|
|
|||
42 |
Turkey |
42.10 |
|
|
|
|
|
|
|
|
|
|
|
|
|
|
|
|
|
|
|
|
|||
43 |
..........................Colombia |
40.40 |
|
|
|
|
|
|
|
|
|
|
44 |
.........................Venezuela |
40.22 |
|
|
|
|
|
|
|
|
|
|
45 |
................................China |
38.30 |
|
|
|
|
|
|
|
|
|
|
46 |
..................................Peru |
36.50 |
|
|
|
|
|
|
|
|
|
|
47 |
..............................Mexico |
36.15 |
|
|
|
|
|
|
|
|
|
|
48 |
................................Egypt |
35.62 |
|
|
|
|
|
|
|
|
|
|
49 |
Vietnam |
35.07 |
|
|
|
|
|
|
|
|
|
|
|
|
|
|
|
|
|
|
|
|
|||
50 |
Jordan |
34.90 |
|
|
|
|
|
|
|
|
|
|
|
|
|
|
|
|
|
|
|
|
|||
51 |
Ukraine |
30.60 |
|
|
|
|
|
|
|
|
|
|
|
|
|
|
|
|
|
|
|
|
|||
52 |
Philippines |
29.00 |
|
|
|
|
|
|
|
|
|
|
|
|
|
|
|
|
|
|
|
|
|||
53 |
Nigeria |
28.43 |
|
|
|
|
|
|
|
|
|
|
|
|
|
|
|
|
|
|
|
|
|||
54 |
Kenya |
28.00 |
|
|
|
|
|
|
|
|
|
|
|
|
|
|
|
|
|
|
|
|
|||
55 |
Thailand |
23.70 |
|
|
|
|
|
|
|
|
|
|
|
|
|
|
|
|
|
|
|
|
|||
56 |
South Africa |
21.00 |
|
|
|
|
|
|
|
|
|
|
|
|
|
|
|
|
|
|
|
|
|||
57 |
Indonesia |
18.00 |
|
|
|
|
|
|
|
|
|
|
|
|
|
|
|
|
|
|
|
|
|||
58 |
Ghana |
14.11 |
|
|
|
|
|
|
|
|
|
|
|
|
|
|
|
|
|
|
|
|
|||
59 |
Tanzania |
12.00 |
|
|
|
|
|
|
|
|
|
|
|
|
|
|
|
|
|
|
|
|
|||
60 |
India |
10.07 |
|
|
|
|
|
|
|
|
|
|
|
|
|
|
|
|
|
|
|
|
|||
61 |
Pakistan |
9.00 |
|
|
|
|
|
|
|
|
|
|
|
|
|
|
|
|
|
|
|
|
|||
62 |
Bangladesh |
5.00 |
|
|
|
|
|
|
|
|
|
|
|
|
|
|
|
|
|
|
|
|
|||
|
|
|
|
|
|
|
|
|
|
|
|
|
SOURCE: International. Telecommunication Union, World Telecommunication/ICT
Indicators Database 2012
2.14
Broadband Internet subscriptions
This variable is the total broadband Internet subscriptions per 100 inhabitants | 2011
Rank |
Country/economy |
value |
|
|
|
|
|
|
|
1 |
Switzerland |
39.20 |
|
|
|
|
|
|
|
|
|
|
|
|
|
|
|||
|
|
|
|
|
|
|
|||
2 |
Netherlands |
38.74 |
|
|
|
|
|
|
|
|
|
|
|
|
|
|
|||
3 |
Denmark |
38.21 |
|
|
|
|
|
|
|
|
|
|
|
|
|
|
|||
4 |
Korea, Rep |
36.91 |
|
|
|
|
|
|
|
|
|
|
|
|
|
|
|||
5 |
Norway |
36.55 |
|
|
|
|
|
|
|
|
|
|
|
|
|
|
|||
6 |
France |
36.12 |
|
|
|
|
|
|
|
|
|
|
|
|
|
|
|||
7 |
Belgium |
32.95 |
|
|
|
|
|
|
|
|
|
|
|
|
|
|
|||
8 |
United Kingdom |
32.74 |
|
|
|
|
|
|
|
|
|
|
|
|
|
|
|||
9 |
Germany |
32.47 |
|
|
|
|
|
|
|
|
|
|
|
|
|
|
|||
10 |
Canada |
32.02 |
|
|
|
|
|
|
|
|
|
|
|
|
|
|
|||
11 |
Sweden |
31.77 |
|
|
|
|
|
|
|
|
|
|
|
|
|
|
|||
12 |
Hong Kong SAR |
31.54 |
|
|
|
|
|
|
|
|
|
|
|
|
|
|
|||
13 |
Finland |
29.50 |
|
|
|
|
|
|
|
|
|
|
|
|
|
|
|||
14 |
United States |
28.75 |
|
|
|
|
|
|
|
|
|
|
|
|
|
|
|||
15 |
Japan |
27.36 |
|
|
|
|
|
|
|
|
|
|
|
|
|
|
|||
16 |
Austria |
26.49 |
|
|
|
|
|
|
|
|
|
|
|
|
|
|
|||
17 |
Singapore |
25.51 |
|
|
|
|
|
|
|
|
|
|
|
|
|
|
|||
18 |
Australia |
23.93 |
|
|
|
|
|
|
|
|
|
|
|
|
|
|
|||
19 |
Israel |
23.80 |
|
|
|
|
|
|
|
|
|
|
|
|
|
|
|||
20 |
................................Spain |
23.52 |
|
|
|
|
|
|
|
21 |
...................................Italy |
22.84 |
|
|
|
|
|
|
|
22 |
............................Hungary |
22.16 |
|
|
|
|
|
|
|
23 |
...............................Ireland |
22.08 |
|
|
|
|
|
|
|
24 |
..............................Greece |
21.64 |
|
|
|
|
|
|
|
25 |
............................Portugal |
20.95 |
|
|
|
|
|
|
|
26 |
.................Czech Republic |
15.66 |
|
|
|
|
|
|
|
27 |
...........................Romania |
15.39 |
|
|
|
|
|
|
|
28 |
..............................Poland |
14.36 |
|
|
|
|
|
|
|
29 |
.............................Bahrain |
13.83 |
|
|
|
|
|
|
|
30 |
................Slovak Republic |
13.65 |
|
|
|
|
|
|
|
31 |
...........Russian Federation |
12.20 |
|
|
|
|
|
|
|
32 |
.................................Chile |
11.65 |
|
|
|
|
|
|
|
33 |
................................China |
11.61 |
|
|
|
|
|
|
|
34 |
........United Arab Emirates |
10.99 |
|
|
|
|
|
|
|
35 |
..............................Mexico |
10.62 |
|
|
|
|
|
|
|
36 |
..........................Argentina |
10.53 |
|
|
|
|
|
|
|
37 |
...............................Turkey |
10.29 |
|
|
|
|
|
|
|
38 |
...................................Brazil |
8.56 |
|
|
|
|
|
|
|
39 |
..............................Panama |
7.92 |
|
|
|
|
|
|
|
40 |
.........................Kazakhstan |
7.50 |
|
|
|
|
|
|
|
41 |
Malaysia |
7.44 |
|
|
|
|
|
|
|
|
|
|
|
|
|
|
|||
42 |
Ukraine |
7.01 |
|
|
|
|
|
|
|
|
|
|
|
|
|
|
|||
43 |
............................Colombia |
6.94 |
|
|
|
|
|
|
|
44 |
.......................Saudi Arabia |
5.73 |
|
|
|
|
|
|
|
45 |
..............................Thailand |
5.38 |
|
|
|
|
|
|
|
46 |
..............................Vietnam |
4.32 |
|
|
|
|
|
|
|
47 |
....................................Peru |
3.49 |
|
|
|
|
|
|
|
48 |
................................Jordan |
3.16 |
|
|
|
|
|
|
|
49 |
Egypt |
2.21 |
|
|
|
|
|
|
|
|
|
|
|
|
|
|
|||
50 |
Philippines |
1.89 |
|
|
|
|
|
|
|
|
|
|
|
|
|
|
|||
51 |
Morocco |
1.83 |
|
|
|
|
|
|
|
|
|
|
|
|
|
|
|||
52 |
South Africa |
1.80 |
|
|
|
|
|
|
|
|
|
|
|
|
|
|
|||
53 |
Kuwait 1 |
1.68 |
|
|
|
|
|
|
|
|
|
|
|
|
|
|
|||
|
|
|
|
|
|
|
|||
54 |
............................Indonesia |
1.13 |
|
|
|
|
|
|
|
55 |
India |
1.03 |
|
|
|
|
|
|
|
|
|
|
|
|
|
|
|||
56 |
Venezuela |
0.87 |
|
|
|
|
|
|
|
|
|
|
|
|
|
|
|||
57 |
Pakistan |
0.42 |
|
|
|
|
|
|
|
|
|
|
|
|
|
|
|||
58 |
Ghana |
0.25 |
|
|
|
|
|
|
|
|
|
|
|
|
|
|
|||
59 |
Nigeria |
0.13 |
|
|
|
|
|
|
|
|
|
|
|
|
|
|
|||
60 |
Kenya |
0.12 |
|
|
|
|
|
|
|
|
|
|
|
|
|
|
|||
61 |
Bangladesh |
0.04 |
|
|
|
|
|
|
|
|
|
|
|
|
|
|
|||
62 |
Tanzania |
0.01 |
|
|
|
|
|
|
|
|
|
|
|
|
|
|
|||
|
|
|
|
|
|
|
|
|
|
SOURCE: International Telecommunication Union, World Telecommunication/ICT
Indicators Database 2012
1 2010
336 | The Financial Development Report 2012

2.15
Telephone subscriptions
This variable is the number of fixed-telephone subscriptions per 100 inhabitants | 2011
Rank |
Country/economy |
value |
|
|
|
|
|
|
|
|
|
|
|
|
1 |
Germany |
63.05 |
|
|
|
|
|
|
|
|
|
|
|
|
|
|
|
|
|
|
|
|
|
|
|
|
|||
|
|
|
|
|
|
|
|
|
|
|
|
|||
2 |
Hong Kong SAR |
61.06 |
|
|
|
|
|
|
|
|
|
|
|
|
|
|
|
|
|
|
|
|
|
|
|
|
|||
3 |
Korea, Rep |
60.90 |
|
|
|
|
|
|
|
|
|
|
|
|
|
|
|
|
|
|
|
|
|
|
|
|
|||
4 |
Switzerland |
60.82 |
|
|
|
|
|
|
|
|
|
|
|
|
|
|
|
|
|
|
|
|
|
|
|
|
|||
5 |
France |
55.92 |
|
|
|
|
|
|
|
|
|
|
|
|
|
|
|
|
|
|
|
|
|
|
|
|
|||
6 |
United Kingdom |
53.24 |
|
|
|
|
|
|
|
|
|
|
|
|
|
|
|
|
|
|
|
|
|
|
|
|
|||
7 |
Japan |
51.06 |
|
|
|
|
|
|
|
|
|
|
|
|
|
|
|
|
|
|
|
|
|
|
|
|
|||
8 |
Greece |
49.91 |
|
|
|
|
|
|
|
|
|
|
|
|
|
|
|
|
|
|
|
|
|
|
|
|
|||
9 |
Sweden |
48.72 |
|
|
|
|
|
|
|
|
|
|
|
|
|
|
|
|
|
|
|
|
|
|
|
|
|||
10 |
United States |
47.91 |
|
|
|
|
|
|
|
|
|
|
|
|
|
|
|
|
|
|
|
|
|
|
|
|
|||
11 |
Canada |
47.86 |
|
|
|
|
|
|
|
|
|
|
|
|
|
|
|
|
|
|
|
|
|
|
|
|
|||
12 |
Australia |
46.63 |
|
|
|
|
|
|
|
|
|
|
|
|
|
|
|
|
|
|
|
|
|
|
|
|
|||
13 |
Israel |
46.28 |
|
|
|
|
|
|
|
|
|
|
|
|
|
|
|
|
|
|
|
|
|
|
|
|
|||
14 |
Ireland |
45.22 |
|
|
|
|
|
|
|
|
|
|
|
|
|
|
|
|
|
|
|
|
|
|
|
|
|||
15 |
Denmark |
45.13 |
|
|
|
|
|
|
|
|
|
|
|
|
|
|
|
|
|
|
|
|
|
|
|
|
|||
16 |
Belgium |
43.06 |
|
|
|
|
|
|
|
|
|
|
|
|
|
|
|
|
|
|
|
|
|
|
|
|
|||
17 |
Netherlands |
42.81 |
|
|
|
|
|
|
|
|
|
|
|
|
|
|
|
|
|
|
|
|
|
|
|
|
|||
18 |
Norway |
42.71 |
|
|
|
|
|
|
|
|
|
|
|
|
|
|
|
|
|
|
|
|
|
|
|
|
|||
19 |
Spain |
42.34 |
|
|
|
|
|
|
|
|
|
|
|
|
|
|
|
|
|
|
|
|
|
|
|
|
|||
20 |
............................Portugal |
42.33 |
|
|
|
|
|
|
|
|
|
|
|
|
21 |
..............................Austria |
40.27 |
|
|
|
|
|
|
|
|
|
|
|
|
22 |
.........................Singapore |
38.88 |
|
|
|
|
|
|
|
|
|
|
|
|
23 |
...................................Italy |
34.64 |
|
|
|
|
|
|
|
|
|
|
|
|
24 |
...........Russian Federation |
30.93 |
|
|
|
|
|
|
|
|
|
|
|
|
25 |
............................Hungary |
29.43 |
|
|
|
|
|
|
|
|
|
|
|
|
26 |
.............................Ukraine |
28.06 |
|
|
|
|
|
|
|
|
|
|
|
|
27 |
.......................Kazakhstan |
26.15 |
|
|
|
|
|
|
|
|
|
|
|
|
28 |
.........................Venezuela |
24.91 |
|
|
|
|
|
|
|
|
|
|
|
|
29 |
..........................Argentina |
24.87 |
|
|
|
|
|
|
|
|
|
|
|
|
30 |
........United Arab Emirates |
23.13 |
|
|
|
|
|
|
|
|
|
|
|
|
31 |
...........................Romania |
21.93 |
|
|
|
|
|
|
|
|
|
|
|
|
32 |
.................................Brazil |
21.88 |
|
|
|
|
|
|
|
|
|
|
|
|
33 |
................................China |
21.16 |
|
|
|
|
|
|
|
|
|
|
|
|
34 |
.................Czech Republic |
20.90 |
|
|
|
|
|
|
|
|
|
|
|
|
35 |
.............................Bahrain |
20.89 |
|
|
|
|
|
|
|
|
|
|
|
|
36 |
............................Kuwait 1 |
20.69 |
|
|
|
|
|
|
|
|
|
|
|
|
|
|
|
|
|
|
|
|
|
|
|
|
|||
37 |
...............................Turkey |
20.66 |
|
|
|
|
|
|
|
|
|
|
|
|
38 |
..............................Finland |
20.06 |
|
|
|
|
|
|
|
|
|
|
|
|
39 |
.................................Chile |
19.49 |
|
|
|
|
|
|
|
|
|
|
|
|
40 |
................Slovak Republic |
19.30 |
|
|
|
|
|
|
|
|
|
|
|
|
41 |
Poland |
18.07 |
|
|
|
|
|
|
|
|
|
|
|
|
|
|
|
|
|
|
|
|
|
|
|
|
|||
42 |
Mexico |
17.15 |
|
|
|
|
|
|
|
|
|
|
|
|
|
|
|
|
|
|
|
|
|
|
|
|
|||
43 |
Saudi Arabia |
16.50 |
|
|
|
|
|
|
|
|
|
|
|
|
|
|
|
|
|
|
|
|
|
|
|
|
|||
44 |
Indonesia |
15.94 |
|
|
|
|
|
|
|
|
|
|
|
|
|
|
|
|
|
|
|
|
|
|
|
|
|||
45 |
..........................Colombia |
15.19 |
|
|
|
|
|
|
|
|
|
|
|
|
45 |
............................Panama |
15.19 |
|
|
|
|
|
|
|
|
|
|
|
|
47 |
............................Malaysia |
14.70 |
|
|
|
|
|
|
|
|
|
|
|
|
48 |
............................Vietnam |
11.46 |
|
|
|
|
|
|
|
|
|
|
|
|
49 |
Peru |
11.08 |
|
|
|
|
|
|
|
|
|
|
|
|
|
|
|
|
|
|
|
|
|
|
|
|
|||
50 |
Morocco |
11.05 |
|
|
|
|
|
|
|
|
|
|
|
|
|
|
|
|
|
|
|
|
|
|
|
|
|||
51 |
Egypt |
10.56 |
|
|
|
|
|
|
|
|
|
|
|
|
|
|
|
|
|
|
|
|
|
|
|
|
|||
52 |
Thailand |
9.67 |
|
|
|
|
|
|
|
|
|
|
|
|
|
|
|
|
|
|
|
|
|
|
|
|
|||
53 |
South Africa |
8.18 |
|
|
|
|
|
|
|
|
|
|
|
|
|
|
|
|
|
|
|
|
|
|
|
|
|||
54 |
Jordan |
7.35 |
|
|
|
|
|
|
|
|
|
|
|
|
|
|
|
|
|
|
|
|
|
|
|
|
|||
55 |
Philippines |
7.15 |
|
|
|
|
|
|
|
|
|
|
|
|
|
|
|
|
|
|
|
|
|
|
|
|
|||
56 |
Pakistan |
3.24 |
|
|
|
|
|
|
|
|
|
|
|
|
|
|
|
|
|
|
|
|
|
|
|
|
|||
57 |
India |
2.63 |
|
|
|
|
|
|
|
|
|
|
|
|
|
|
|
|
|
|
|
|
|
|
|
|
|||
58 |
Ghana |
1.14 |
|
|
|
|
|
|
|
|
|
|
|
|
|
|
|
|
|
|
|
|
|
|
|
|
|||
59 |
Bangladesh |
1.06 |
|
|
|
|
|
|
|
|
|
|
|
|
|
|
|
|
|
|
|
|
|
|
|
|
|||
60 |
Kenya |
0.68 |
|
|
|
|
|
|
|
|
|
|
|
|
|
|
|
|
|
|
|
|
|
|
|
|
|||
61 |
Nigeria |
0.44 |
|
|
|
|
|
|
|
|
|
|
|
|
|
|
|
|
|
|
|
|
|
|
|
|
|||
62 |
Tanzania |
0.35 |
|
|
|
|
|
|
|
|
|
|
|
|
|
|
|
|
|
|
|
|
|
|
|
|
|||
|
|
|
|
|
|
|
|
|
|
|
|
|
|
|
SOURCE: International Telecommunication Union, World Telecommunication/ICT
Indicators Database 2012
1 2010
3: Data Tables | Business environment
2.16
Mobile telephone subscriptions
This indicator is the number of mobile cellular telephone subscriptions per 100 inhabitants | 2011
Rank |
Country/economy |
value |
|
|
|
|
|
|
|
1 |
Hong Kong SAR |
209.64 |
|
|
|
|
|
|
|
|
|
|
|
|
|
|
|||
|
|
|
|
|
|
|
|||
2 |
Panama |
203.88 |
|
|
|
|
|
|
|
|
|
|
|
|
|
|
|||
3 |
Saudi Arabia |
191.24 |
|
|
|
|
|
|
|
|
|
|
|
|
|
|
|||
4 |
Russian Federation |
179.31 |
|
|
|
|
|
|
|
|
|
|
|
|
|
|
|||
5 |
Finland |
166.02 |
|
|
|
|
|
|
|
|
|
|
|
|
|
|
|||
6 |
Kuwait 1 |
160.78 |
|
|
|
|
|
|
|
|
|
|
|
|
|
|
|||
7 |
............................Austria |
154.78 |
|
|
|
|
|
|
|
8 |
.................................Italy |
151.84 |
|
|
|
|
|
|
|
9 |
Singapore |
149.49 |
|
|
|
|
|
|
|
|
|
|
|
|
|
|
|||
10 |
United Arab Emirates |
148.62 |
|
|
|
|
|
|
|
|
|
|
|
|
|
|
|||
11 |
Vietnam |
143.39 |
|
|
|
|
|
|
|
|
|
|
|
|
|
|
|||
12 |
Kazakhstan |
142.55 |
|
|
|
|
|
|
|
|
|
|
|
|
|
|
|||
13 |
Argentina |
134.92 |
|
|
|
|
|
|
|
|
|
|
|
|
|
|
|||
14 |
Germany |
132.30 |
|
|
|
|
|
|
|
|
|
|
|
|
|
|
|||
15 |
United Kingdom |
130.75 |
|
|
|
|
|
|
|
|
|
|
|
|
|
|
|||
16 |
Switzerland |
130.06 |
|
|
|
|
|
|
|
|
|
|
|
|
|
|
|||
17 |
Chile |
129.71 |
|
|
|
|
|
|
|
|
|
|
|
|
|
|
|||
18 |
Poland |
128.46 |
|
|
|
|
|
|
|
|
|
|
|
|
|
|
|||
19 |
Bahrain |
127.96 |
|
|
|
|
|
|
|
|
|
|
|
|
|
|
|||
20 |
..........................Malaysia |
127.04 |
|
|
|
|
|
|
|
21 |
....................South Africa |
126.83 |
|
|
|
|
|
|
|
22 |
.........................Denmark |
126.46 |
|
|
|
|
|
|
|
23 |
...............................Brazil |
123.18 |
|
|
|
|
|
|
|
24 |
...........................Ukraine |
122.96 |
|
|
|
|
|
|
|
25 |
...............................Israel |
121.66 |
|
|
|
|
|
|
|
26 |
...............Czech Republic |
121.60 |
|
|
|
|
|
|
|
27 |
....................Netherlands |
119.02 |
|
|
|
|
|
|
|
28 |
..........................Sweden |
118.57 |
|
|
|
|
|
|
|
29 |
............................Jordan |
118.20 |
|
|
|
|
|
|
|
30 |
..........................Hungary |
117.30 |
|
|
|
|
|
|
|
31 |
...........................Norway |
116.75 |
|
|
|
|
|
|
|
32 |
..........................Belgium |
116.61 |
|
|
|
|
|
|
|
33 |
..........................Portugal |
114.92 |
|
|
|
|
|
|
|
34 |
..............................Spain |
114.23 |
|
|
|
|
|
|
|
35 |
.........................Morocco |
113.26 |
|
|
|
|
|
|
|
36 |
..........................Thailand |
113.16 |
|
|
|
|
|
|
|
37 |
................................Peru |
110.41 |
|
|
|
|
|
|
|
38 |
..............Slovak Republic |
109.35 |
|
|
|
|
|
|
|
39 |
.........................Romania |
109.16 |
|
|
|
|
|
|
|
40 |
.....................Korea, Rep |
108.50 |
|
|
|
|
|
|
|
41 |
Ireland |
108.41 |
|
|
|
|
|
|
|
|
|
|
|
|
|
|
|||
42 |
Australia |
108.34 |
|
|
|
|
|
|
|
|
|
|
|
|
|
|
|||
43 |
............................Greece |
106.48 |
|
|
|
|
|
|
|
44 |
..................United States |
105.91 |
|
|
|
|
|
|
|
45 |
............................France |
105.03 |
|
|
|
|
|
|
|
46 |
.............................Japan |
102.67 |
|
|
|
|
|
|
|
47 |
..............................Egypt |
101.08 |
|
|
|
|
|
|
|
48 |
..........................Colombia |
98.45 |
|
|
|
|
|
|
|
49 |
Venezuela |
97.78 |
|
|
|
|
|
|
|
|
|
|
|
|
|
|
|||
50 |
Indonesia |
97.72 |
|
|
|
|
|
|
|
|
|
|
|
|
|
|
|||
51 |
Philippines |
91.99 |
|
|
|
|
|
|
|
|
|
|
|
|
|
|
|||
52 |
Turkey |
88.70 |
|
|
|
|
|
|
|
|
|
|
|
|
|
|
|||
53 |
Ghana |
84.78 |
|
|
|
|
|
|
|
|
|
|
|
|
|
|
|||
54 |
Mexico |
82.38 |
|
|
|
|
|
|
|
|
|
|
|
|
|
|
|||
55 |
Canada |
75.28 |
|
|
|
|
|
|
|
|
|
|
|
|
|
|
|||
56 |
China |
73.19 |
|
|
|
|
|
|
|
|
|
|
|
|
|
|
|||
57 |
India |
72.00 |
|
|
|
|
|
|
|
|
|
|
|
|
|
|
|||
58 |
Kenya |
64.84 |
|
|
|
|
|
|
|
|
|
|
|
|
|
|
|||
59 |
Pakistan |
61.61 |
|
|
|
|
|
|
|
|
|
|
|
|
|
|
|||
60 |
Nigeria |
58.58 |
|
|
|
|
|
|
|
|
|
|
|
|
|
|
|||
61 |
Bangladesh |
56.48 |
|
|
|
|
|
|
|
|
|
|
|
|
|
|
|||
62 |
Tanzania |
55.53 |
|
|
|
|
|
|
|
|
|
|
|
|
|
|
|||
|
|
|
|
|
|
|
|
|
|
SOURCE: International Telecommunication Union, World Telecommunication/ICT
Indicators Database 2012
1 2010
The Financial Development Report 2012 | 337

3: Data Tables | Business environment
2.17
Cost of starting a business
This indicator is the cost of starting a business as a percent of income per capita | 2011
Rank |
Country/economy |
value |
|
|
|
|
|
|
|
1 |
Denmark |
0.00 |
|
|
|
|
|
|
|
|
|
|
|
|
|
|
|||
|
|
|
|
|
|
|
|||
2 |
South Africa |
0.30 |
|
|
|
|
|
|
|
|
|
|
|
|
|
|
|||
3 |
Canada |
0.40 |
|
|
|
|
|
|
|
|
|
|
|
|
|
|
|||
3 |
Ireland |
0.40 |
|
|
|
|
|
|
|
|
|
|
|
|
|
|
|||
5 |
Sweden |
0.60 |
|
|
|
|
|
|
|
|
|
|
|
|
|
|
|||
6 |
Australia |
0.70 |
|
|
|
|
|
|
|
|
|
|
|
|
|
|
|||
6 |
Bahrain |
0.70 |
|
|
|
|
|
|
|
|
|
|
|
|
|
|
|||
6 |
Singapore |
0.70 |
|
|
|
|
|
|
|
|
|
|
|
|
|
|
|||
6 |
United Kingdom |
0.70 |
|
|
|
|
|
|
|
|
|
|
|
|
|
|
|||
10 |
Kazakhstan |
0.80 |
|
|
|
|
|
|
|
|
|
|
|
|
|
|
|||
11 |
France |
0.90 |
|
|
|
|
|
|
|
|
|
|
|
|
|
|
|||
12 |
Finland |
1.00 |
|
|
|
|
|
|
|
|
|
|
|
|
|
|
|||
13 |
Kuwait |
1.20 |
|
|
|
|
|
|
|
|
|
|
|
|
|
|
|||
14 |
United States |
1.40 |
|
|
|
|
|
|
|
|
|
|
|
|
|
|
|||
15 |
Norway |
1.80 |
|
|
|
|
|
|
|
|
|
|
|
|
|
|
|||
15 |
Slovak Republic |
1.80 |
|
|
|
|
|
|
|
|
|
|
|
|
|
|
|||
17 |
Hong Kong SAR |
1.90 |
|
|
|
|
|
|
|
|
|
|
|
|
|
|
|||
18 |
Russian Federation |
2.00 |
|
|
|
|
|
|
|
|
|
|
|
|
|
|
|||
19 |
Switzerland |
2.10 |
|
|
|
|
|
|
|
|
|
|
|
|
|
|
|||
20 |
..............................Portugal |
2.30 |
|
|
|
|
|
|
|
21 |
.............................Romania |
3.00 |
|
|
|
|
|
|
|
22 |
..................................China |
3.50 |
|
|
|
|
|
|
|
23 |
...................................Israel |
4.40 |
|
|
|
|
|
|
|
23 |
...............................Ukraine |
4.40 |
|
|
|
|
|
|
|
25 |
.............................Germany |
4.60 |
|
|
|
|
|
|
|
26 |
..................................Spain |
4.70 |
|
|
|
|
|
|
|
27 |
...................................Chile |
5.10 |
|
|
|
|
|
|
|
28 |
................................Austria |
5.20 |
|
|
|
|
|
|
|
28 |
..............................Belgium |
5.20 |
|
|
|
|
|
|
|
30 |
...................................Brazil |
5.40 |
|
|
|
|
|
|
|
31 |
........................Netherlands |
5.50 |
|
|
|
|
|
|
|
32 |
..................................Egypt |
5.60 |
|
|
|
|
|
|
|
32 |
..........United Arab Emirates |
5.60 |
|
|
|
|
|
|
|
34 |
.......................Saudi Arabia |
5.90 |
|
|
|
|
|
|
|
35 |
..............................Thailand |
6.20 |
|
|
|
|
|
|
|
36 |
.................................Japan |
7.50 |
|
|
|
|
|
|
|
37 |
..............................Hungary |
7.60 |
|
|
|
|
|
|
|
38 |
............................Colombia |
8.00 |
|
|
|
|
|
|
|
39 |
...................Czech Republic |
8.40 |
|
|
|
|
|
|
|
40 |
..............................Panama |
9.90 |
|
|
|
|
|
|
|
41 |
Vietnam |
10.60 |
|
|
|
|
|
|
|
|
|
|
|
|
|
|
|||
42 |
Mexico |
11.20 |
|
|
|
|
|
|
|
|
|
|
|
|
|
|
|||
42 |
............................Pakistan |
11.20 |
|
|
|
|
|
|
|
42 |
...............................Turkey |
11.20 |
|
|
|
|
|
|
|
45 |
..........................Argentina |
11.90 |
|
|
|
|
|
|
|
45 |
..................................Peru |
11.90 |
|
|
|
|
|
|
|
47 |
..............................Jordan |
13.90 |
|
|
|
|
|
|
|
48 |
.......................Korea, Rep |
14.60 |
|
|
|
|
|
|
|
49 |
Morocco |
15.70 |
|
|
|
|
|
|
|
|
|
|
|
|
|
|
|||
50 |
Malaysia |
16.40 |
|
|
|
|
|
|
|
|
|
|
|
|
|
|
|||
51 |
Ghana |
17.30 |
|
|
|
|
|
|
|
|
|
|
|
|
|
|
|||
51 |
Poland |
17.30 |
|
|
|
|
|
|
|
|
|
|
|
|
|
|
|||
53 |
Indonesia |
17.90 |
|
|
|
|
|
|
|
|
|
|
|
|
|
|
|||
54 |
Italy |
18.20 |
|
|
|
|
|
|
|
|
|
|
|
|
|
|
|||
55 |
Philippines |
19.10 |
|
|
|
|
|
|
|
|
|
|
|
|
|
|
|||
56 |
Greece |
20.10 |
|
|
|
|
|
|
|
|
|
|
|
|
|
|
|||
57 |
Venezuela |
26.10 |
|
|
|
|
|
|
|
|
|
|
|
|
|
|
|||
58 |
Tanzania |
28.80 |
|
|
|
|
|
|
|
|
|
|
|
|
|
|
|||
59 |
Bangladesh |
30.60 |
|
|
|
|
|
|
|
|
|
|
|
|
|
|
|||
60 |
Kenya |
37.80 |
|
|
|
|
|
|
|
|
|
|
|
|
|
|
|||
61 |
India |
46.80 |
|
|
|
|
|
|
|
|
|
|
|
|
|
|
|||
62 |
Nigeria |
70.60 |
|
|
|
|
|
|
|
|
|
|
|
|
|
|
|||
|
|
|
|
|
|
|
|
|
|
2.18
Cost of registering property
This variable is the cost of registering property as a percent of the property value | 2011
Rank |
Country/economy |
value |
|
|
|
|
|
1 |
Saudi Arabia |
0.00 |
|
|
|
|
|
|
|
|
|
|
|||
|
|
|
|
|
|||
1 |
Slovak Republic |
0.00 |
|
|
|
|
|
|
|
|
|
|
|||
3 |
Kazakhstan |
0.10 |
|
|
|
|
|
|
|
|
|
|
|||
4 |
Russian Federation |
0.20 |
|
|
|
|
|
|
|
|
|
|
|||
5 |
Poland |
0.40 |
|
|
|
|
|
|
|
|
|
|
|||
5 |
Switzerland |
0.40 |
|
|
|
|
|
|
|
|
|
|
|||
7 |
Kuwait |
0.50 |
|
|
|
|
|
|
|
|
|
|
|||
8 |
Denmark |
0.60 |
|
|
|
|
|
|
|
|
|
|
|||
8 |
Vietnam |
0.60 |
|
|
|
|
|
|
|
|
|
|
|||
10 |
Ghana |
0.70 |
|
|
|
|
|
|
|
|
|
|
|||
11 |
Egypt |
0.80 |
|
|
|
|
|
|
|
|
|
|
|||
11 |
United States |
0.80 |
|
|
|
|
|
|
|
|
|
|
|||
13 |
Romania |
1.20 |
|
|
|
|
|
|
|
|
|
|
|||
14 |
Chile |
1.30 |
|
|
|
|
|
|
|
|
|
|
|||
15 |
Canada |
1.80 |
|
|
|
|
|
|
|
|
|
|
|||
16 |
Colombia |
2.00 |
|
|
|
|
|
|
|
|
|
|
|||
16 |
United Arab Emirates |
2.00 |
|
|
|
|
|
|
|
|
|
|
|||
18 |
Brazil |
2.30 |
|
|
|
|
|
|
|
|
|
|
|||
19 |
Norway |
2.50 |
|
|
|
|
|
|
|
|
|
|
|||
19 |
...........................Venezuela |
2.50 |
|
|
|
|
|
21 |
...............................Bahrain |
2.70 |
|
|
|
|
|
22 |
...........................Singapore |
2.80 |
|
|
|
|
|
23 |
...................Czech Republic |
3.00 |
|
|
|
|
|
24 |
..............................Malaysia |
3.30 |
|
|
|
|
|
24 |
....................................Peru |
3.30 |
|
|
|
|
|
24 |
.................................Turkey |
3.30 |
|
|
|
|
|
27 |
..................................China |
3.60 |
|
|
|
|
|
28 |
...............................Ukraine |
3.90 |
|
|
|
|
|
29 |
................................Finland |
4.00 |
|
|
|
|
|
30 |
.................Hong Kong SAR |
4.10 |
|
|
|
|
|
31 |
.................................Kenya |
4.30 |
|
|
|
|
|
31 |
..............................Sweden |
4.30 |
|
|
|
|
|
33 |
..............................Tanzania |
4.40 |
|
|
|
|
|
34 |
.....................................Italy |
4.50 |
|
|
|
|
|
35 |
................................Austria |
4.60 |
|
|
|
|
|
36 |
..................United Kingdom |
4.70 |
|
|
|
|
|
37 |
..........................Philippines |
4.80 |
|
|
|
|
|
38 |
.............................Morocco |
4.90 |
|
|
|
|
|
39 |
..............................Australia |
5.00 |
|
|
|
|
|
39 |
..............................Hungary |
5.00 |
|
|
|
|
|
39 |
Israel |
5.00 |
|
|
|
|
|
|
|
|
|
|
|||
42 |
Korea, Rep |
5.10 |
|
|
|
|
|
|
|
|
|
|
|||
43 |
.............................Germany |
5.20 |
|
|
|
|
|
44 |
................................Mexico |
5.30 |
|
|
|
|
|
44 |
..............................Panama |
5.30 |
|
|
|
|
|
46 |
........................South Africa |
5.60 |
|
|
|
|
|
47 |
.................................Japan |
5.70 |
|
|
|
|
|
48 |
................................France |
6.10 |
|
|
|
|
|
48 |
Netherlands |
6.10 |
|
|
|
|
|
|
|
|
|
|
|||
50 |
Thailand |
6.30 |
|
|
|
|
|
|
|
|
|
|
|||
51 |
Ireland |
6.50 |
|
|
|
|
|
|
|
|
|
|
|||
52 |
Bangladesh |
6.60 |
|
|
|
|
|
|
|
|
|
|
|||
53 |
Argentina |
7.00 |
|
|
|
|
|
|
|
|
|
|
|||
54 |
Spain |
7.10 |
|
|
|
|
|
|
|
|
|
|
|||
55 |
India |
7.30 |
|
|
|
|
|
|
|
|
|
|
|||
55 |
Portugal |
7.30 |
|
|
|
|
|
|
|
|
|
|
|||
57 |
Jordan |
7.50 |
|
|
|
|
|
|
|
|
|
|
|||
58 |
Pakistan |
7.70 |
|
|
|
|
|
|
|
|
|
|
|||
59 |
Indonesia |
10.80 |
|
|
|
|
|
|
|
|
|
|
|||
60 |
Greece |
12.00 |
|
|
|
|
|
|
|
|
|
|
|||
61 |
Belgium |
12.70 |
|
|
|
|
|
|
|
|
|
|
|||
62 |
Nigeria |
20.80 |
|
|
|
|
|
|
|
|
|
|
|||
|
|
|
|
|
|
|
|
SOURCE: The World Bank, Doing Business 2012 |
SOURCE: The World Bank, Doing Business 2012 |
338 | The Financial Development Report 2012
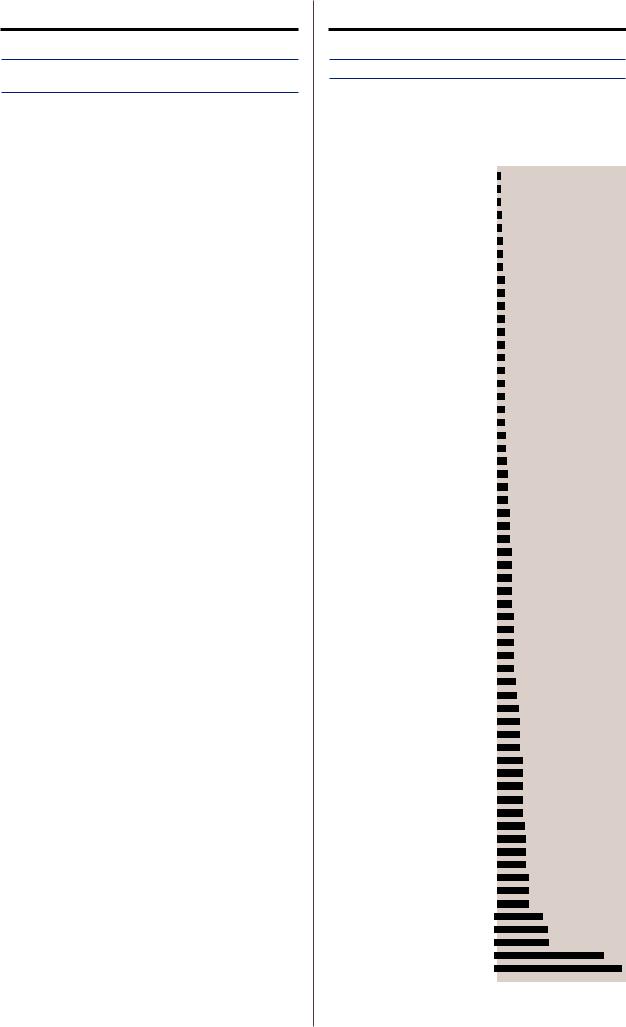
2.19
Cost of closing a business
This variable is the cost of closing a business as a percent of the estate | 2011
Rank |
Country/economy |
value |
|
|
|
|
|
|
|
|
|
|
1 |
Colombia |
1.00 |
|
|
|
|
|
|
|
|
|
|
|
|
|
|
|
|
|
|
|
|
|||
|
|
|
|
|
|
|
|
|
|
|||
1 |
Kuwait |
1.00 |
|
|
|
|
|
|
|
|
|
|
|
|
|
|
|
|
|
|
|
|
|||
1 |
Norway |
1.00 |
|
|
|
|
|
|
|
|
|
|
|
|
|
|
|
|
|
|
|
|
|||
1 |
Singapore |
1.00 |
|
|
|
|
|
|
|
|
|
|
|
|
|
|
|
|
|
|
|
|
|||
5 |
Belgium |
4.00 |
|
|
|
|
|
|
|
|
|
|
|
|
|
|
|
|
|
|
|
|
|||
5 |
Canada |
4.00 |
|
|
|
|
|
|
|
|
|
|
|
|
|
|
|
|
|
|
|
|
|||
5 |
Denmark |
4.00 |
|
|
|
|
|
|
|
|
|
|
|
|
|
|
|
|
|
|
|
|
|||
5 |
Finland |
4.00 |
|
|
|
|
|
|
|
|
|
|
|
|
|
|
|
|
|
|
|
|
|||
5 |
Japan |
4.00 |
|
|
|
|
|
|
|
|
|
|
|
|
|
|
|
|
|
|
|
|
|||
5 |
Korea, Rep |
4.00 |
|
|
|
|
|
|
|
|
|
|
|
|
|
|
|
|
|
|
|
|
|||
5 |
Netherlands |
4.00 |
|
|
|
|
|
|
|
|
|
|
|
|
|
|
|
|
|
|
|
|
|||
5 |
Pakistan |
4.00 |
|
|
|
|
|
|
|
|
|
|
|
|
|
|
|
|
|
|
|
|
|||
5 |
Switzerland |
4.00 |
|
|
|
|
|
|
|
|
|
|
|
|
|
|
|
|
|
|
|
|
|||
14 |
United Kingdom |
6.00 |
|
|
|
|
|
|
|
|
|
|
|
|
|
|
|
|
|
|
|
|
|||
15 |
Peru |
7.00 |
|
|
|
|
|
|
|
|
|
|
|
|
|
|
|
|
|
|
|
|
|||
15 |
United States |
7.00 |
|
|
|
|
|
|
|
|
|
|
|
|
|
|
|
|
|
|
|
|
|||
17 |
Australia |
8.00 |
|
|
|
|
|
|
|
|
|
|
|
|
|
|
|
|
|
|
|
|
|||
17 |
Bangladesh |
8.00 |
|
|
|
|
|
|
|
|
|
|
|
|
|
|
|
|
|
|
|
|
|||
17 |
Germany |
8.00 |
|
|
|
|
|
|
|
|
|
|
|
|
|
|
|
|
|
|
|
|
|||
20 |
................................France |
9.00 |
|
|
|
|
|
|
|
|
|
|
20 |
................................Greece |
9.00 |
|
|
|
|
|
|
|
|
|
|
20 |
.................Hong Kong SAR |
9.00 |
|
|
|
|
|
|
|
|
|
|
20 |
....................................India |
9.00 |
|
|
|
|
|
|
|
|
|
|
20 |
.................................Ireland |
9.00 |
|
|
|
|
|
|
|
|
|
|
20 |
................................Jordan |
9.00 |
|
|
|
|
|
|
|
|
|
|
20 |
..............................Portugal |
9.00 |
|
|
|
|
|
|
|
|
|
|
20 |
.............Russian Federation |
9.00 |
|
|
|
|
|
|
|
|
|
|
20 |
..............................Sweden |
9.00 |
|
|
|
|
|
|
|
|
|
|
29 |
.............................Bahrain |
10.00 |
|
|
|
|
|
|
|
|
|
|
30 |
...........................Romania |
11.00 |
|
|
|
|
|
|
|
|
|
|
30 |
................................Spain |
11.00 |
|
|
|
|
|
|
|
|
|
|
32 |
..........................Argentina |
12.00 |
|
|
|
|
|
|
|
|
|
|
32 |
.................................Brazil |
12.00 |
|
|
|
|
|
|
|
|
|
|
34 |
.................................Chile |
15.00 |
|
|
|
|
|
|
|
|
|
|
34 |
............................Hungary |
15.00 |
|
|
|
|
|
|
|
|
|
|
34 |
.......................Kazakhstan |
15.00 |
|
|
|
|
|
|
|
|
|
|
34 |
............................Malaysia |
15.00 |
|
|
|
|
|
|
|
|
|
|
34 |
..............................Poland |
15.00 |
|
|
|
|
|
|
|
|
|
|
34 |
...............................Turkey |
15.00 |
|
|
|
|
|
|
|
|
|
|
34 |
............................Vietnam |
15.00 |
|
|
|
|
|
|
|
|
|
|
41 |
Czech Republic |
17.00 |
|
|
|
|
|
|
|
|
|
|
|
|
|
|
|
|
|
|
|
|
|||
42 |
Austria |
18.00 |
|
|
|
|
|
|
|
|
|
|
|
|
|
|
|
|
|
|
|
|
|||
42 |
..........................Indonesia |
18.00 |
|
|
|
|
|
|
|
|
|
|
42 |
..............................Mexico |
18.00 |
|
|
|
|
|
|
|
|
|
|
42 |
...........................Morocco |
18.00 |
|
|
|
|
|
|
|
|
|
|
42 |
............................Panama |
18.00 |
|
|
|
|
|
|
|
|
|
|
42 |
................Slovak Republic |
18.00 |
|
|
|
|
|
|
|
|
|
|
42 |
......................South Africa |
18.00 |
|
|
|
|
|
|
|
|
|
|
49 |
China |
22.00 |
|
|
|
|
|
|
|
|
|
|
|
|
|
|
|
|
|
|
|
|
|||
49 |
Egypt |
22.00 |
|
|
|
|
|
|
|
|
|
|
|
|
|
|
|
|
|
|
|
|
|||
49 |
Ghana |
22.00 |
|
|
|
|
|
|
|
|
|
|
|
|
|
|
|
|
|
|
|
|
|||
49 |
Italy |
22.00 |
|
|
|
|
|
|
|
|
|
|
|
|
|
|
|
|
|
|
|
|
|||
49 |
Kenya |
22.00 |
|
|
|
|
|
|
|
|
|
|
|
|
|
|
|
|
|
|
|
|
|||
49 |
Nigeria |
22.00 |
|
|
|
|
|
|
|
|
|
|
|
|
|
|
|
|
|
|
|
|
|||
49 |
Saudi Arabia |
22.00 |
|
|
|
|
|
|
|
|
|
|
|
|
|
|
|
|
|
|
|
|
|||
49 |
Tanzania |
22.00 |
|
|
|
|
|
|
|
|
|
|
|
|
|
|
|
|
|
|
|
|
|||
57 |
Israel |
23.00 |
|
|
|
|
|
|
|
|
|
|
|
|
|
|
|
|
|
|
|
|
|||
58 |
United Arab Emirates |
30.00 |
|
|
|
|
|
|
|
|
|
|
|
|
|
|
|
|
|
|
|
|
|||
59 |
Thailand |
36.00 |
|
|
|
|
|
|
|
|
|
|
|
|
|
|
|
|
|
|
|
|
|||
60 |
Philippines |
38.00 |
|
|
|
|
|
|
|
|
|
|
|
|
|
|
|
|
|
|
|
|
|||
60 |
Venezuela |
38.00 |
|
|
|
|
|
|
|
|
|
|
|
|
|
|
|
|
|
|
|
|
|||
62 |
Ukraine |
42.00 |
|
|
|
|
|
|
|
|
|
|
|
|
|
|
|
|
|
|
|
|
|||
|
|
|
|
|
|
|
|
|
|
|
|
|
SOURCE: The World Bank, Doing Business 2012
3: Data Tables | Business environment
2.20
Time to start a business
This variable is the time in days to start a business | 2011
Rank |
Country/economy |
value |
1 |
Australia................................... |
2 |
2 |
Hong Kong SAR...................... |
3 |
2 |
Singapore................................ |
3 |
4 |
Belgium................................... |
4 |
4 |
Hungary................................... |
4 |
6 |
Canada.................................... |
5 |
6 |
Portugal................................... |
5 |
6 |
Saudi Arabia............................ |
5 |
9 |
Denmark.................................. |
6 |
9 |
Italy.......................................... |
6 |
9 |
Malaysia................................... |
6 |
9 |
Turkey...................................... |
6 |
9 |
United States........................... |
6 |
14 |
Chile........................................ |
7 |
14 |
Egypt....................................... |
7 |
14 |
France..................................... |
7 |
14 |
Korea, Rep.............................. |
7 |
14 |
Norway.................................... |
7 |
19 |
Netherlands............................. |
8 |
19 |
Panama................................... |
8 |
21 |
Bahrain.................................... |
9 |
21 |
Mexico..................................... |
9 |
23 |
Greece................................... |
10 |
24 |
Ghana.................................... |
12 |
24 |
Jordan................................... |
12 |
24 |
Morocco................................ |
12 |
27 |
Ireland.................................... |
13 |
27 |
United Arab Emirates............. |
13 |
27 |
United Kingdom..................... |
13 |
30 |
Colombia............................... |
14 |
30 |
Finland................................... |
14 |
30 |
Romania................................ |
14 |
33 |
Germany................................ |
15 |
33 |
Sweden................................. |
15 |
35 |
Slovak Republic..................... |
18 |
35 |
Switzerland............................ |
18 |
37 |
Bangladesh............................ |
19 |
37 |
Kazakhstan............................ |
19 |
37 |
South Africa........................... |
19 |
40 |
Czech Republic...................... |
20 |
41 |
Pakistan................................. |
21 |
42 |
Japan.................................... |
23 |
43 |
Ukraine.................................. |
24 |
44 |
Argentina............................... |
26 |
44 |
Peru....................................... |
26 |
46 |
Austria................................... |
28 |
46 |
Spain..................................... |
28 |
48 |
India....................................... |
29 |
48 |
Tanzania................................. |
29 |
48 |
Thailand................................. |
29 |
51 |
Russian Federation................ |
30 |
52 |
Kuwait................................... |
32 |
52 |
Poland................................... |
32 |
54 |
Kenya.................................... |
33 |
55 |
Israel...................................... |
34 |
55 |
Nigeria................................... |
34 |
57 |
Philippines............................. |
35 |
58 |
China..................................... |
38 |
59 |
Vietnam................................. |
44 |
60 |
Indonesia............................... |
45 |
61 |
Brazil.................................... |
119 |
62 |
Venezuela............................ |
141 |
SOURCE: The World Bank, Doing Business 2012
The Financial Development Report 2012 | 339
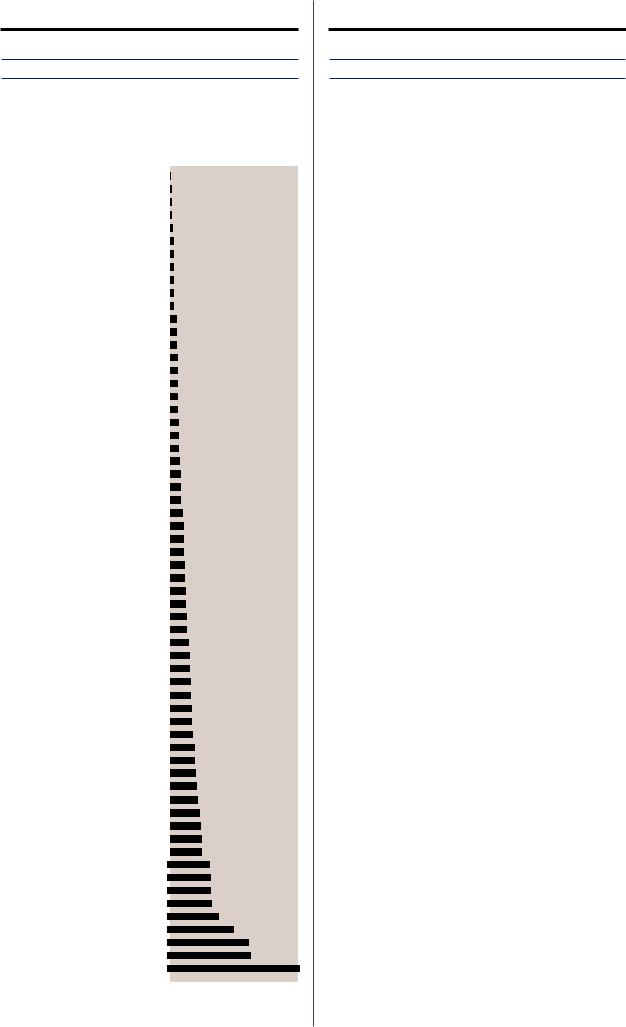
3: Data Tables | Business environment
2.21
Time to register property
This variable is the time in days to register property | 2011
Rank |
Country/economy |
value |
1 |
Portugal................................... |
1 |
2 |
Saudi Arabia............................ |
2 |
2 |
Thailand................................... |
2 |
2 |
United Arab Emirates............... |
2 |
5 |
Norway.................................... |
3 |
6 |
Australia................................... |
5 |
6 |
Singapore................................ |
5 |
8 |
Turkey...................................... |
6 |
9 |
Netherlands............................. |
7 |
9 |
Peru......................................... |
7 |
9 |
Sweden................................... |
7 |
12 |
Korea, Rep............................ |
11 |
13 |
United States......................... |
12 |
14 |
Spain..................................... |
13 |
15 |
Finland................................... |
14 |
15 |
Japan.................................... |
14 |
17 |
Colombia............................... |
15 |
18 |
Denmark................................ |
16 |
18 |
Switzerland............................ |
16 |
20 |
Canada.................................. |
17 |
20 |
Hungary................................. |
17 |
20 |
Slovak Republic..................... |
17 |
23 |
Greece................................... |
18 |
24 |
Austria................................... |
21 |
24 |
Jordan................................... |
21 |
26 |
Indonesia............................... |
22 |
27 |
South Africa........................... |
23 |
28 |
Czech Republic...................... |
25 |
29 |
Romania................................ |
26 |
30 |
Italy........................................ |
27 |
31 |
China..................................... |
29 |
31 |
United Kingdom..................... |
29 |
33 |
Bahrain.................................. |
31 |
33 |
Chile...................................... |
31 |
35 |
Panama................................. |
32 |
36 |
Ghana.................................... |
34 |
37 |
Hong Kong SAR.................... |
36 |
38 |
Ireland.................................... |
38 |
38 |
Venezuela.............................. |
38 |
40 |
Brazil...................................... |
39 |
40 |
Philippines............................. |
39 |
42 |
Germany................................ |
40 |
42 |
Kazakhstan............................ |
40 |
44 |
Russian Federation................ |
43 |
45 |
India....................................... |
44 |
46 |
Kuwait................................... |
47 |
47 |
Malaysia................................. |
48 |
48 |
Pakistan................................. |
50 |
49 |
Argentina............................... |
53 |
50 |
Vietnam................................. |
57 |
51 |
France................................... |
59 |
52 |
Belgium................................. |
64 |
52 |
Kenya.................................... |
64 |
54 |
Egypt..................................... |
72 |
55 |
Tanzania................................. |
73 |
56 |
Mexico................................... |
74 |
57 |
Morocco................................ |
75 |
58 |
Nigeria................................... |
82 |
59 |
Ukraine................................ |
117 |
60 |
Israel.................................... |
144 |
61 |
Poland................................. |
152 |
62 |
Bangladesh.......................... |
245 |
SOURCE: The World Bank, Doing Business 2012
2.22
Time to close a business
This variable is the time in years to close a business | 2011
Rank |
Country/economy |
value |
|
|
|
|
|
|
|
|
|
1 |
Ireland |
0.40 |
|
|
|
|
|
|
|
|
|
|
|
|
|
|
|
|
|
|
|||
|
|
|
|
|
|
|
|
|
|||
2 |
Japan |
0.60 |
|
|
|
|
|
|
|
|
|
|
|
|
|
|
|
|
|
|
|||
3 |
Canada |
0.80 |
|
|
|
|
|
|
|
|
|
|
|
|
|
|
|
|
|
|
|||
3 |
Singapore |
0.80 |
|
|
|
|
|
|
|
|
|
|
|
|
|
|
|
|
|
|
|||
5 |
Belgium |
0.90 |
|
|
|
|
|
|
|
|
|
|
|
|
|
|
|
|
|
|
|||
5 |
Finland |
0.90 |
|
|
|
|
|
|
|
|
|
|
|
|
|
|
|
|
|
|
|||
5 |
Norway |
0.90 |
|
|
|
|
|
|
|
|
|
|
|
|
|
|
|
|
|
|
|||
8 |
Australia |
1.00 |
|
|
|
|
|
|
|
|
|
|
|
|
|
|
|
|
|
|
|||
8 |
Denmark |
1.00 |
|
|
|
|
|
|
|
|
|
|
|
|
|
|
|
|
|
|
|||
8 |
United Kingdom |
1.00 |
|
|
|
|
|
|
|
|
|
|
|
|
|
|
|
|
|
|
|||
11 |
Austria |
1.10 |
|
|
|
|
|
|
|
|
|
|
|
|
|
|
|
|
|
|
|||
11 |
Hong Kong SAR |
1.10 |
|
|
|
|
|
|
|
|
|
|
|
|
|
|
|
|
|
|
|||
11 |
Netherlands |
1.10 |
|
|
|
|
|
|
|
|
|
|
|
|
|
|
|
|
|
|
|||
14 |
Germany |
1.20 |
|
|
|
|
|
|
|
|
|
|
|
|
|
|
|
|
|
|
|||
15 |
Colombia |
1.30 |
|
|
|
|
|
|
|
|
|
|
|
|
|
|
|
|
|
|
|||
16 |
Kazakhstan |
1.50 |
|
|
|
|
|
|
|
|
|
|
|
|
|
|
|
|
|
|
|||
16 |
Korea, Rep |
1.50 |
|
|
|
|
|
|
|
|
|
|
|
|
|
|
|
|
|
|
|||
16 |
Malaysia |
1.50 |
|
|
|
|
|
|
|
|
|
|
|
|
|
|
|
|
|
|
|||
16 |
Saudi Arabia |
1.50 |
|
|
|
|
|
|
|
|
|
|
|
|
|
|
|
|
|
|
|||
16 |
..................................Spain |
1.50 |
|
|
|
|
|
|
|
|
|
16 |
......................United States |
1.50 |
|
|
|
|
|
|
|
|
|
22 |
..................................China |
1.70 |
|
|
|
|
|
|
|
|
|
23 |
.....................................Italy |
1.80 |
|
|
|
|
|
|
|
|
|
23 |
................................Mexico |
1.80 |
|
|
|
|
|
|
|
|
|
23 |
.............................Morocco |
1.80 |
|
|
|
|
|
|
|
|
|
26 |
................................France |
1.90 |
|
|
|
|
|
|
|
|
|
26 |
.................................Ghana |
1.90 |
|
|
|
|
|
|
|
|
|
28 |
................................Greece |
2.00 |
|
|
|
|
|
|
|
|
|
28 |
..............................Hungary |
2.00 |
|
|
|
|
|
|
|
|
|
28 |
................................Nigeria |
2.00 |
|
|
|
|
|
|
|
|
|
28 |
..............................Portugal |
2.00 |
|
|
|
|
|
|
|
|
|
28 |
.............Russian Federation |
2.00 |
|
|
|
|
|
|
|
|
|
28 |
........................South Africa |
2.00 |
|
|
|
|
|
|
|
|
|
28 |
..............................Sweden |
2.00 |
|
|
|
|
|
|
|
|
|
35 |
...............................Bahrain |
2.50 |
|
|
|
|
|
|
|
|
|
35 |
..............................Panama |
2.50 |
|
|
|
|
|
|
|
|
|
37 |
..............................Thailand |
2.70 |
|
|
|
|
|
|
|
|
|
38 |
............................Argentina |
2.80 |
|
|
|
|
|
|
|
|
|
38 |
..............................Pakistan |
2.80 |
|
|
|
|
|
|
|
|
|
40 |
...............................Ukraine |
2.90 |
|
|
|
|
|
|
|
|
|
41 |
Poland |
3.00 |
|
|
|
|
|
|
|
|
|
|
|
|
|
|
|
|
|
|
|||
41 |
Switzerland |
3.00 |
|
|
|
|
|
|
|
|
|
|
|
|
|
|
|
|
|
|
|||
41 |
..............................Tanzania |
3.00 |
|
|
|
|
|
|
|
|
|
44 |
....................................Peru |
3.10 |
|
|
|
|
|
|
|
|
|
45 |
...................Czech Republic |
3.20 |
|
|
|
|
|
|
|
|
|
46 |
.............................Romania |
3.30 |
|
|
|
|
|
|
|
|
|
46 |
.................................Turkey |
3.30 |
|
|
|
|
|
|
|
|
|
48 |
.........................Bangladesh |
4.00 |
|
|
|
|
|
|
|
|
|
48 |
Brazil |
4.00 |
|
|
|
|
|
|
|
|
|
|
|
|
|
|
|
|
|
|
|||
48 |
Israel |
4.00 |
|
|
|
|
|
|
|
|
|
|
|
|
|
|
|
|
|
|
|||
48 |
Slovak Republic |
4.00 |
|
|
|
|
|
|
|
|
|
|
|
|
|
|
|
|
|
|
|||
48 |
Venezuela |
4.00 |
|
|
|
|
|
|
|
|
|
|
|
|
|
|
|
|
|
|
|||
53 |
Egypt |
4.20 |
|
|
|
|
|
|
|
|
|
|
|
|
|
|
|
|
|
|
|||
53 |
Kuwait |
4.20 |
|
|
|
|
|
|
|
|
|
|
|
|
|
|
|
|
|
|
|||
55 |
Jordan |
4.30 |
|
|
|
|
|
|
|
|
|
|
|
|
|
|
|
|
|
|
|||
56 |
Chile |
4.50 |
|
|
|
|
|
|
|
|
|
|
|
|
|
|
|
|
|
|
|||
56 |
Kenya |
4.50 |
|
|
|
|
|
|
|
|
|
|
|
|
|
|
|
|
|
|
|||
58 |
Vietnam |
5.00 |
|
|
|
|
|
|
|
|
|
|
|
|
|
|
|
|
|
|
|||
59 |
United Arab Emirates |
5.10 |
|
|
|
|
|
|
|
|
|
|
|
|
|
|
|
|
|
|
|||
60 |
Indonesia |
5.50 |
|
|
|
|
|
|
|
|
|
|
|
|
|
|
|
|
|
|
|||
61 |
Philippines |
5.70 |
|
|
|
|
|
|
|
|
|
|
|
|
|
|
|
|
|
|
|||
62 |
India |
7.00 |
|
|
|
|
|
|
|
|
|
|
|
|
|
|
|
|
|
|
|||
|
|
|
|
|
|
|
|
|
|
|
|
SOURCE: The World Bank, Doing Business 2012
340 | The Financial Development Report 2012

Data Tables
Section III Financial stability
The Financial Development Report 2012 | 341

3: Data Tables | Financial stability
3.01
Change in real effective exchange rate (REER)
This is the average percent change in real effective exchange rate (REER) from year-to-year over the period 2007–2011. Higher REER represents appreciation | 2007–2011
Rank |
Country/economy |
value |
|
|
|
|
|
|
|
|
|
|
1 |
Brazil |
8.30 |
|
|
|
|
|
|
|
|
|
|
|
|
|
|
|
|
|
|
|
|
|||
|
|
|
|
|
|
|
|
|
|
|||
2 |
Venezuela |
7.92 |
|
|
|
|
|
|
|
|
|
|
|
|
|
|
|
|
|
|
|
|
|||
3 |
Indonesia |
5.38 |
|
|
|
|
|
|
|
|
|
|
|
|
|
|
|
|
|
|
|
|
|||
4 |
Egypt |
5.06 |
|
|
|
|
|
|
|
|
|
|
|
|
|
|
|
|
|
|
|
|
|||
5 |
Colombia |
4.02 |
|
|
|
|
|
|
|
|
|
|
|
|
|
|
|
|
|
|
|
|
|||
6 |
Japan |
3.88 |
|
|
|
|
|
|
|
|
|
|
|
|
|
|
|
|
|
|
|
|
|||
7 |
Russian Federation |
3.86 |
|
|
|
|
|
|
|
|
|
|
|
|
|
|
|
|
|
|
|
|
|||
8 |
Malaysia |
3.78 |
|
|
|
|
|
|
|
|
|
|
|
|
|
|
|
|
|
|
|
|
|||
9 |
Israel |
3.60 |
|
|
|
|
|
|
|
|
|
|
|
|
|
|
|
|
|
|
|
|
|||
10 |
Norway |
3.52 |
|
|
|
|
|
|
|
|
|
|
|
|
|
|
|
|
|
|
|
|
|||
11 |
Australia |
3.42 |
|
|
|
|
|
|
|
|
|
|
|
|
|
|
|
|
|
|
|
|
|||
12 |
Czech Republic |
3.24 |
|
|
|
|
|
|
|
|
|
|
|
|
|
|
|
|
|
|
|
|
|||
13 |
Switzerland |
3.12 |
|
|
|
|
|
|
|
|
|
|
|
|
|
|
|
|
|
|
|
|
|||
14 |
Kazakhstan |
2.98 |
|
|
|
|
|
|
|
|
|
|
|
|
|
|
|
|
|
|
|
|
|||
15 |
China |
2.90 |
|
|
|
|
|
|
|
|
|
|
|
|
|
|
|
|
|
|
|
|
|||
16 |
Thailand |
2.58 |
|
|
|
|
|
|
|
|
|
|
|
|
|
|
|
|
|
|
|
|
|||
17 |
Peru |
2.34 |
|
|
|
|
|
|
|
|
|
|
|
|
|
|
|
|
|
|
|
|
|||
18 |
Chile |
1.62 |
|
|
|
|
|
|
|
|
|
|
|
|
|
|
|
|
|
|
|
|
|||
19 |
Saudi Arabia |
1.52 |
|
|
|
|
|
|
|
|
|
|
|
|
|
|
|
|
|
|
|
|
|||
20 |
...........................Singapore |
1.32 |
|
|
|
|
|
|
|
|
|
|
21 |
................................Kuwait |
1.32 |
|
|
|
|
|
|
|
|
|
|
22 |
..................Slovak Republic |
1.22 |
|
|
|
|
|
|
|
|
|
|
23 |
................................Greece |
1.20 |
|
|
|
|
|
|
|
|
|
|
24 |
..............................Panama |
1.12 |
|
|
|
|
|
|
|
|
|
|
25 |
........................South Africa |
0.84 |
|
|
|
|
|
|
|
|
|
|
26 |
.............................Romania |
0.72 |
|
|
|
|
|
|
|
|
|
|
27 |
..............................Pakistan |
0.60 |
|
|
|
|
|
|
|
|
|
|
28 |
..................................Spain |
0.56 |
|
|
|
|
|
|
|
|
|
|
29 |
..............................Belgium |
0.44 |
|
|
|
|
|
|
|
|
|
|
30 |
................................Poland |
0.42 |
|
|
|
|
|
|
|
|
|
|
31 |
..............................Hungary |
0.28 |
|
|
|
|
|
|
|
|
|
|
32 |
..............................Portugal |
0.06 |
|
|
|
|
|
|
|
|
|
|
33 |
.............................Denmark |
0.02 |
|
|
|
|
|
|
|
|
|
|
34 |
................................Austria |
0.00 |
|
|
|
|
|
|
|
|
|
|
35 |
...................................Italy |
-0.04 |
|
|
|
|
|
|
|
|
|
|
36 |
..............................Finland |
-0.06 |
|
|
|
|
|
|
|
|
|
|
37 |
..................................India |
-0.06 |
|
|
|
|
|
|
|
|
|
|
38 |
......................Netherlands |
-0.08 |
|
|
|
|
|
|
|
|
|
|
39 |
...............................Ireland |
-0.22 |
|
|
|
|
|
|
|
|
|
|
40 |
..............................France |
-0.28 |
|
|
|
|
|
|
|
|
|
|
41 |
Sweden |
-0.44 |
|
|
|
|
|
|
|
|
|
|
|
|
|
|
|
|
|
|
|
|
|||
42 |
Germany |
-0.52 |
|
|
|
|
|
|
|
|
|
|
|
|
|
|
|
|
|
|
|
|
|||
43 |
...........................Morocco |
-0.56 |
|
|
|
|
|
|
|
|
|
|
44 |
..............................Mexico |
-0.70 |
|
|
|
|
|
|
|
|
|
|
45 |
.............................Ukraine |
-0.70 |
|
|
|
|
|
|
|
|
|
|
46 |
..........................Argentina |
-0.82 |
|
|
|
|
|
|
|
|
|
|
47 |
....................United States |
-1.78 |
|
|
|
|
|
|
|
|
|
|
48 |
.............................Canada |
-1.96 |
|
|
|
|
|
|
|
|
|
|
49 |
Hong Kong SAR |
-2.34 |
|
|
|
|
|
|
|
|
|
|
|
|
|
|
|
|
|
|
|
|
|||
50 |
Turkey |
-2.38 |
|
|
|
|
|
|
|
|
|
|
|
|
|
|
|
|
|
|
|
|
|||
51 |
United Kingdom |
-3.24 |
|
|
|
|
|
|
|
|
|
|
|
|
|
|
|
|
|
|
|
|
|||
52 |
Philippines |
-3.32 |
|
|
|
|
|
|
|
|
|
|
|
|
|
|
|
|
|
|
|
|
|||
53 |
Bahrain |
-3.92 |
|
|
|
|
|
|
|
|
|
|
|
|
|
|
|
|
|
|
|
|
|||
54 |
Korea, Rep |
-4.24 |
|
|
|
|
|
|
|
|
|
|
|
|
|
|
|
|
|
|
|
|
|||
n/a |
Bangladesh........................... |
n/a |
|
|
|
|
|
|
|
|
|
|
n/a |
Ghana................................... |
n/a |
|
|
|
|
|
|
|
|
|
|
n/a |
Jordan.................................. |
n/a |
|
|
|
|
|
|
|
|
|
|
n/a |
Kenya................................... |
n/a |
|
|
|
|
|
|
|
|
|
|
n/a |
Nigeria.................................. |
n/a |
|
|
|
|
|
|
|
|
|
|
n/a |
Tanzania................................ |
n/a |
|
|
|
|
|
|
|
|
|
|
n/a |
United Arab Emirates............ |
n/a |
|
|
|
|
|
|
|
|
|
|
n/a |
Vietnam................................ |
n/a |
|
|
|
|
|
|
|
|
|
|
|
|
|
|
|
|
|
|
|
|
|
|
|
SOURCE: Moody’s,. Moody’s Country Credit Statistical Handbook, May 2012
3.02
External vulnerability indicator
The external vulnerability indicator is the sum of several measures of external exposure as a percent of foreign exchange reserves | 2011
Rank |
Country/economy |
value |
|
|
|
|
|
1 |
Saudi Arabia |
9.30 |
|
|
|
|
|
|
|
|
|
|
|||
|
|
|
|
|
|||
2 |
China |
14.30 |
|
|
|
|
|
|
|
|
|
|
|||
3 |
Egypt |
16.10 |
|
|
|
|
|
|
|
|
|
|
|||
4 |
Morocco |
19.10 |
|
|
|
|
|
|
|
|
|
|
|||
5 |
Bangladesh |
19.80 |
|
|
|
|
|
|
|
|
|
|
|||
5 |
Peru |
19.80 |
|
|
|
|
|
|
|
|
|
|
|||
7 |
Panama |
21.10 |
|
|
|
|
|
|
|
|
|
|
|||
8 |
Philippines |
25.10 |
|
|
|
|
|
|
|
|
|
|
|||
9 |
Russian Federation |
28.20 |
|
|
|
|
|
|
|
|
|
|
|||
10 |
Brazil |
33.70 |
|
|
|
|
|
|
|
|
|
|
|||
11 |
Thailand |
35.00 |
|
|
|
|
|
|
|
|
|
|
|||
12 |
Malaysia |
40.50 |
|
|
|
|
|
|
|
|
|
|
|||
13 |
India |
48.80 |
|
|
|
|
|
|
|
|
|
|
|||
14 |
Indonesia |
49.70 |
|
|
|
|
|
|
|
|
|
|
|||
15 |
Colombia |
55.30 |
|
|
|
|
|
|
|
|
|
|
|||
16 |
Mexico |
57.70 |
|
|
|
|
|
|
|
|
|
|
|||
17 |
Korea, Rep |
62.60 |
|
|
|
|
|
|
|
|
|
|
|||
18 |
Argentina |
66.10 |
|
|
|
|
|
|
|
|
|
|
|||
19 |
South Africa |
68.80 |
|
|
|
|
|
|
|
|
|
|
|||
20 |
............................Pakistan |
73.40 |
|
|
|
|
|
21 |
.................Czech Republic |
86.50 |
|
|
|
|
|
22 |
..............................Jordan |
86.60 |
|
|
|
|
|
23 |
............................Vietnam |
99.30 |
|
|
|
|
|
24 |
...............................Israel |
111.20 |
|
|
|
|
|
25 |
...............................Chile |
123.40 |
|
|
|
|
|
26 |
.....................Kazakhstan |
128.00 |
|
|
|
|
|
27 |
............................Poland |
138.20 |
|
|
|
|
|
28 |
............................Kuwait |
147.20 |
|
|
|
|
|
29 |
...........................Ukraine |
163.00 |
|
|
|
|
|
30 |
.........................Romania |
166.80 |
|
|
|
|
|
31 |
.............................Turkey |
173.80 |
|
|
|
|
|
32 |
..........................Hungary |
202.40 |
|
|
|
|
|
33 |
......United Arab Emirates |
272.00 |
|
|
|
|
|
34 |
.......................Venezuela |
297.70 |
|
|
|
|
|
35 |
...........................Bahrain |
631.30 |
|
|
|
|
|
n/a |
Australia................................ |
n/a |
|
|
|
|
|
n/a |
Austria.................................. |
n/a |
|
|
|
|
|
n/a |
Belgium................................ |
n/a |
|
|
|
|
|
n/a |
Canada................................. |
n/a |
|
|
|
|
|
n/a |
Denmark............................... |
n/a |
|
|
|
|
|
n/a |
Finland.................................. |
n/a |
|
|
|
|
|
n/a |
France.................................. |
n/a |
|
|
|
|
|
n/a |
Germany............................... |
n/a |
|
|
|
|
|
n/a |
Ghana................................... |
n/a |
|
|
|
|
|
n/a |
Greece.................................. |
n/a |
|
|
|
|
|
n/a |
Hong Kong SAR................... |
n/a |
|
|
|
|
|
n/a |
Ireland................................... |
n/a |
|
|
|
|
|
n/a |
Italy....................................... |
n/a |
|
|
|
|
|
n/a |
Japan................................... |
n/a |
|
|
|
|
|
n/a |
Kenya................................... |
n/a |
|
|
|
|
|
n/a |
Netherlands.......................... |
n/a |
|
|
|
|
|
n/a |
Nigeria.................................. |
n/a |
|
|
|
|
|
n/a |
Norway................................. |
n/a |
|
|
|
|
|
n/a |
Portugal................................ |
n/a |
|
|
|
|
|
n/a |
Singapore............................. |
n/a |
|
|
|
|
|
n/a |
Slovak Republic.................... |
n/a |
|
|
|
|
|
n/a |
Spain.................................... |
n/a |
|
|
|
|
|
n/a |
Sweden................................ |
n/a |
|
|
|
|
|
n/a |
Switzerland........................... |
n/a |
|
|
|
|
|
n/a |
Tanzania................................ |
n/a |
|
|
|
|
|
n/a |
United Kingdom.................... |
n/a |
|
|
|
|
|
n/a |
United States........................ |
n/a |
|
|
|
|
|
|
|
|
|
|
|
|
|
SOURCE: Moody’s,. Moody’s Country Credit Statistical Handbook, May 2012
342 | The Financial Development Report 2012

3.03
Current account balance to GDP
This variable, which is the three-year average of current account balance to GDP, provides an indicator of the difficulty a country might have in mobilizing the foreign exchange necessary for debt service | 2009–2011
Rank |
Country/economy |
value |
|
|
|
|
|
|
|
1 |
Kuwait |
31.96 |
|
|
|
|
|
|
|
|
|
|
|
|
|
|
|||
|
|
|
|
|
|
|
|||
2 |
Singapore |
20.86 |
|
|
|
|
|
|
|
|
|
|
|
|
|
|
|||
3 |
Saudi Arabia |
14.93 |
|
|
|
|
|
|
|
|
|
|
|
|
|
|
|||
4 |
Switzerland |
13.53 |
|
|
|
|
|
|
|
|
|
|
|
|
|
|
|||
5 |
Malaysia |
13.16 |
|
|
|
|
|
|
|
|
|
|
|
|
|
|
|||
6 |
Norway |
12.61 |
|
|
|
|
|
|
|
|
|
|
|
|
|
|
|||
7 |
Sweden |
6.68 |
|
|
|
|
|
|
|
|
|
|
|
|
|
|
|||
8 |
Netherlands |
6.10 |
|
|
|
|
|
|
|
|
|
|
|
|
|
|
|||
9 |
Hong Kong SAR |
6.08 |
|
|
|
|
|
|
|
|
|
|
|
|
|
|
|||
10 |
Germany |
5.92 |
|
|
|
|
|
|
|
|
|
|
|
|
|
|
|||
11 |
Venezuela |
5.36 |
|
|
|
|
|
|
|
|
|
|
|
|
|
|
|||
12 |
Thailand |
5.29 |
|
|
|
|
|
|
|
|
|
|
|
|
|
|
|||
13 |
United Arab Emirates |
5.22 |
|
|
|
|
|
|
|
|
|
|
|
|
|
|
|||
14 |
Nigeria |
5.12 |
|
|
|
|
|
|
|
|
|
|
|
|
|
|
|||
15 |
Denmark |
5.04 |
|
|
|
|
|
|
|
|
|
|
|
|
|
|
|||
16 |
Russian Federation |
4.74 |
|
|
|
|
|
|
|
|
|
|
|
|
|
|
|||
17 |
China |
4.38 |
|
|
|
|
|
|
|
|
|
|
|
|
|
|
|||
18 |
Philippines |
4.26 |
|
|
|
|
|
|
|
|
|
|
|
|
|
|
|||
19 |
Bahrain |
3.50 |
|
|
|
|
|
|
|
|
|
|
|
|
|
|
|||
20 |
.........................Korea, Rep |
3.07 |
|
|
|
|
|
|
|
21 |
.................................Japan |
2.81 |
|
|
|
|
|
|
|
22 |
................................Austria |
2.29 |
|
|
|
|
|
|
|
23 |
...................................Israel |
2.19 |
|
|
|
|
|
|
|
24 |
.........................Kazakhstan |
2.05 |
|
|
|
|
|
|
|
25 |
.........................Bangladesh |
1.35 |
|
|
|
|
|
|
|
26 |
............................Indonesia |
1.19 |
|
|
|
|
|
|
|
27 |
................................Finland |
0.85 |
|
|
|
|
|
|
|
28 |
..............................Hungary |
0.83 |
|
|
|
|
|
|
|
29 |
...................................Chile |
0.75 |
|
|
|
|
|
|
|
30 |
............................Argentina |
0.72 |
|
|
|
|
|
|
|
31 |
............................Belgium |
-0.11 |
|
|
|
|
|
|
|
32 |
..............................Mexico |
-0.55 |
|
|
|
|
|
|
|
33 |
...............................Ireland |
-0.79 |
|
|
|
|
|
|
|
34 |
..................................Peru |
-0.95 |
|
|
|
|
|
|
|
35 |
..............................France |
-1.83 |
|
|
|
|
|
|
|
36 |
.................................Brazil |
-1.94 |
|
|
|
|
|
|
|
37 |
................................Egypt |
-2.10 |
|
|
|
|
|
|
|
38 |
................Slovak Republic |
-2.18 |
|
|
|
|
|
|
|
39 |
................United Kingdom |
-2.23 |
|
|
|
|
|
|
|
40 |
............................Pakistan |
-2.58 |
|
|
|
|
|
|
|
41 |
Colombia |
-2.69 |
|
|
|
|
|
|
|
|
|
|
|
|
|
|
|||
42 |
India |
-2.72 |
|
|
|
|
|
|
|
|
|
|
|
|
|
|
|||
43 |
.................Czech Republic |
-2.82 |
|
|
|
|
|
|
|
44 |
...................................Italy |
-2.93 |
|
|
|
|
|
|
|
45 |
.............................Canada |
-2.97 |
|
|
|
|
|
|
|
46 |
....................United States |
-3.03 |
|
|
|
|
|
|
|
47 |
.............................Ukraine |
-3.10 |
|
|
|
|
|
|
|
48 |
............................Australia |
-3.10 |
|
|
|
|
|
|
|
49 |
South Africa |
-3.39 |
|
|
|
|
|
|
|
|
|
|
|
|
|
|
|||
50 |
Vietnam |
-3.75 |
|
|
|
|
|
|
|
|
|
|
|
|
|
|
|||
51 |
Romania |
-4.26 |
|
|
|
|
|
|
|
|
|
|
|
|
|
|
|||
52 |
Poland |
-4.32 |
|
|
|
|
|
|
|
|
|
|
|
|
|
|
|||
53 |
Spain |
-4.50 |
|
|
|
|
|
|
|
|
|
|
|
|
|
|
|||
54 |
Morocco |
-5.68 |
|
|
|
|
|
|
|
|
|
|
|
|
|
|
|||
55 |
Turkey |
-6.14 |
|
|
|
|
|
|
|
|
|
|
|
|
|
|
|||
56 |
Jordan |
-6.66 |
|
|
|
|
|
|
|
|
|
|
|
|
|
|
|||
57 |
Ghana |
-6.85 |
|
|
|
|
|
|
|
|
|
|
|
|
|
|
|||
58 |
Kenya |
-8.01 |
|
|
|
|
|
|
|
|
|
|
|
|
|
|
|||
59 |
Panama |
-8.08 |
|
|
|
|
|
|
|
|
|
|
|
|
|
|
|||
60 |
Portugal |
-9.11 |
|
|
|
|
|
|
|
|
|
|
|
|
|
|
|||
61 |
Tanzania |
-9.87 |
|
|
|
|
|
|
|
|
|
|
|
|
|
|
|||
62 |
Greece |
-10.21 |
|
|
|
|
|
|
|
|
|
|
|
|
|
|
|||
|
|
|
|
|
|
|
|
|
|
SOURCE: IMF, World Economic Outlook Database, April 2012
3: Data Tables | Financial stability
3.04
Dollarization vulnerability indicator
This variable measures the risk of payment crisis and default originating from the presence of a large amount of dollarization in the domestic banking system | 2011
Rank |
Country/economy |
value |
|
|
|
|
|
|
|
|
|
|
1 |
Australia |
0.00 |
|
|
|
|
|
|
|
|
|
|
|
|
|
|
|
|
|
|
|
|
|||
|
|
|
|
|
|
|
|
|
|
|||
1 |
Austria |
0.00 |
|
|
|
|
|
|
|
|
|
|
|
|
|
|
|
|
|
|
|
|
|||
1 |
Belgium |
0.00 |
|
|
|
|
|
|
|
|
|
|
|
|
|
|
|
|
|
|
|
|
|||
1 |
Brazil |
0.00 |
|
|
|
|
|
|
|
|
|
|
|
|
|
|
|
|
|
|
|
|
|||
1 |
Canada |
0.00 |
|
|
|
|
|
|
|
|
|
|
|
|
|
|
|
|
|
|
|
|
|||
1 |
Colombia |
0.00 |
|
|
|
|
|
|
|
|
|
|
|
|
|
|
|
|
|
|
|
|
|||
1 |
Denmark |
0.00 |
|
|
|
|
|
|
|
|
|
|
|
|
|
|
|
|
|
|
|
|
|||
1 |
Finland |
0.00 |
|
|
|
|
|
|
|
|
|
|
|
|
|
|
|
|
|
|
|
|
|||
1 |
France |
0.00 |
|
|
|
|
|
|
|
|
|
|
|
|
|
|
|
|
|
|
|
|
|||
1 |
Germany |
0.00 |
|
|
|
|
|
|
|
|
|
|
|
|
|
|
|
|
|
|
|
|
|||
1 |
Greece |
0.00 |
|
|
|
|
|
|
|
|
|
|
|
|
|
|
|
|
|
|
|
|
|||
1 |
Hong Kong SAR |
0.00 |
|
|
|
|
|
|
|
|
|
|
|
|
|
|
|
|
|
|
|
|
|||
1 |
Ireland |
0.00 |
|
|
|
|
|
|
|
|
|
|
|
|
|
|
|
|
|
|
|
|
|||
1 |
Italy |
0.00 |
|
|
|
|
|
|
|
|
|
|
|
|
|
|
|
|
|
|
|
|
|||
1 |
Japan |
0.00 |
|
|
|
|
|
|
|
|
|
|
|
|
|
|
|
|
|
|
|
|
|||
1 |
Netherlands |
0.00 |
|
|
|
|
|
|
|
|
|
|
|
|
|
|
|
|
|
|
|
|
|||
1 |
Norway |
0.00 |
|
|
|
|
|
|
|
|
|
|
|
|
|
|
|
|
|
|
|
|
|||
1 |
Portugal |
0.00 |
|
|
|
|
|
|
|
|
|
|
|
|
|
|
|
|
|
|
|
|
|||
1 |
Singapore |
0.00 |
|
|
|
|
|
|
|
|
|
|
|
|
|
|
|
|
|
|
|
|
|||
1 |
..................Slovak Republic |
0.00 |
|
|
|
|
|
|
|
|
|
|
1 |
..................................Spain |
0.00 |
|
|
|
|
|
|
|
|
|
|
1 |
..............................Sweden |
0.00 |
|
|
|
|
|
|
|
|
|
|
1 |
.........................Switzerland |
0.00 |
|
|
|
|
|
|
|
|
|
|
1 |
..................United Kingdom |
0.00 |
|
|
|
|
|
|
|
|
|
|
1 |
......................United States |
0.00 |
|
|
|
|
|
|
|
|
|
|
26 |
..............................Thailand |
2.50 |
|
|
|
|
|
|
|
|
|
|
27 |
...........................Venezuela |
2.90 |
|
|
|
|
|
|
|
|
|
|
28 |
.............................Morocco |
4.50 |
|
|
|
|
|
|
|
|
|
|
29 |
....................................India |
4.80 |
|
|
|
|
|
|
|
|
|
|
30 |
................................Mexico |
8.30 |
|
|
|
|
|
|
|
|
|
|
31 |
............................Pakistan |
22.80 |
|
|
|
|
|
|
|
|
|
|
32 |
............................Hungary |
24.40 |
|
|
|
|
|
|
|
|
|
|
33 |
........................Philippines |
28.20 |
|
|
|
|
|
|
|
|
|
|
34 |
..........................Argentina |
31.20 |
|
|
|
|
|
|
|
|
|
|
35 |
..........................Indonesia |
32.20 |
|
|
|
|
|
|
|
|
|
|
36 |
.............................Bahrain |
34.20 |
|
|
|
|
|
|
|
|
|
|
37 |
...........Russian Federation |
35.30 |
|
|
|
|
|
|
|
|
|
|
38 |
.......................Kazakhstan |
37.90 |
|
|
|
|
|
|
|
|
|
|
39 |
..............................Jordan |
38.70 |
|
|
|
|
|
|
|
|
|
|
40 |
...........................Romania |
41.50 |
|
|
|
|
|
|
|
|
|
|
41 |
Peru |
46.60 |
|
|
|
|
|
|
|
|
|
|
|
|
|
|
|
|
|
|
|
|
|||
42 |
Ukraine |
60.10 |
|
|
|
|
|
|
|
|
|
|
|
|
|
|
|
|
|
|
|
|
|||
43 |
................................Egypt |
67.90 |
|
|
|
|
|
|
|
|
|
|
44 |
..........................Vietnam 1 |
94.00 |
|
|
|
|
|
|
|
|
|
|
|
|
|
|
|
|
|
|
|
|
|||
45 |
.............................Turkey |
101.50 |
|
|
|
|
|
|
|
|
|
|
n/a |
Bangladesh........................... |
n/a |
|
|
|
|
|
|
|
|
|
|
n/a |
Chile..................................... |
n/a |
|
|
|
|
|
|
|
|
|
|
n/a |
China.................................... |
n/a |
|
|
|
|
|
|
|
|
|
|
n/a |
Czech Republic..................... |
n/a |
|
|
|
|
|
|
|
|
|
|
n/a |
Ghana................................... |
n/a |
|
|
|
|
|
|
|
|
|
|
n/a |
Israel..................................... |
n/a |
|
|
|
|
|
|
|
|
|
|
n/a |
Kenya................................... |
n/a |
|
|
|
|
|
|
|
|
|
|
n/a |
Korea, Rep........................... |
n/a |
|
|
|
|
|
|
|
|
|
|
n/a |
Kuwait.................................. |
n/a |
|
|
|
|
|
|
|
|
|
|
n/a |
Malaysia................................ |
n/a |
|
|
|
|
|
|
|
|
|
|
n/a |
Nigeria.................................. |
n/a |
|
|
|
|
|
|
|
|
|
|
n/a |
Panama................................ |
n/a |
|
|
|
|
|
|
|
|
|
|
n/a |
Poland.................................. |
n/a |
|
|
|
|
|
|
|
|
|
|
n/a |
Saudi Arabia......................... |
n/a |
|
|
|
|
|
|
|
|
|
|
n/a |
South Africa.......................... |
n/a |
|
|
|
|
|
|
|
|
|
|
n/a |
Tanzania................................ |
n/a |
|
|
|
|
|
|
|
|
|
|
n/a |
United Arab Emirates............ |
n/a |
|
|
|
|
|
|
|
|
|
|
|
|
|
|
|
|
|
|
|
|
|
|
|
SOURCE: Moody’s,. Moody’s Country Credit Statistical Handbook, May 2012
1 2010
The Financial Development Report 2012 | 343

3: Data Tables | Financial stability
3.05
External debt to GDP (developing economies)
This variable refers to a country’s external debt as a percent of GDP | 2011
Rank |
Country/economy |
value |
|
|
|
|
1 |
China |
9.60 |
|
|
|
|
|
|
|
|
|||
|
|
|
|
|||
2 |
Saudi Arabia |
14.10 |
|
|
|
|
|
|
|
|
|||
3 |
Egypt |
14.80 |
|
|
|
|
|
|
|
|
|||
4 |
Kuwait |
18.00 |
|
|
|
|
|
|
|
|
|||
5 |
Brazil |
18.10 |
|
|
|
|
|
|
|
|
|||
6 |
India |
19.00 |
|
|
|
|
|
|
|
|
|||
7 |
Bangladesh |
22.70 |
|
|
|
|
|
|
|
|
|||
8 |
Colombia |
22.80 |
|
|
|
|
|
|
|
|
|||
9 |
Mexico |
24.30 |
|
|
|
|
|
|
|
|
|||
10 |
Peru |
24.40 |
|
|
|
|
|
|
|
|
|||
11 |
Indonesia |
26.50 |
|
|
|
|
|
|
|
|
|||
12 |
South Africa |
27.30 |
|
|
|
|
|
|
|
|
|||
13 |
Pakistan |
29.40 |
|
|
|
|
|
|
|
|
|||
14 |
Russian Federation |
29.50 |
|
|
|
|
|
|
|
|
|||
15 |
Malaysia |
30.20 |
|
|
|
|
|
|
|
|
|||
16 |
Thailand |
30.70 |
|
|
|
|
|
|
|
|
|||
17 |
Argentina |
31.20 |
|
|
|
|
|
|
|
|
|||
18 |
Morocco |
31.40 |
|
|
|
|
|
|
|
|
|||
19 |
Venezuela |
34.00 |
|
|
|
|
|
|
|
|
|||
20 |
........................Philippines |
34.70 |
|
|
|
|
21 |
.......................Korea, Rep |
35.70 |
|
|
|
|
22 |
.................................Chile |
39.70 |
|
|
|
|
23 |
............................Panama |
40.90 |
|
|
|
|
23 |
...............................Turkey |
40.90 |
|
|
|
|
23 |
............................Vietnam |
40.90 |
|
|
|
|
26 |
.................................Israel |
42.00 |
|
|
|
|
27 |
........United Arab Emirates |
48.70 |
|
|
|
|
28 |
.................Czech Republic |
49.20 |
|
|
|
|
29 |
..............................Jordan |
58.30 |
|
|
|
|
30 |
.......................Kazakhstan |
72.10 |
|
|
|
|
30 |
...........................Romania |
72.10 |
|
|
|
|
32 |
..............................Poland |
72.20 |
|
|
|
|
33 |
.............................Ukraine |
76.40 |
|
|
|
|
34 |
..........................Hungary |
147.40 |
|
|
|
|
35 |
...........................Bahrain |
156.60 |
|
|
|
|
n/a |
Australia................................ |
n/a |
|
|
|
|
n/a |
Austria.................................. |
n/a |
|
|
|
|
n/a |
Belgium................................ |
n/a |
|
|
|
|
n/a |
Canada................................. |
n/a |
|
|
|
|
n/a |
Denmark............................... |
n/a |
|
|
|
|
n/a |
Finland.................................. |
n/a |
|
|
|
|
n/a |
France.................................. |
n/a |
|
|
|
|
n/a |
Germany............................... |
n/a |
|
|
|
|
n/a |
Ghana................................... |
n/a |
|
|
|
|
n/a |
Greece.................................. |
n/a |
|
|
|
|
n/a |
Hong Kong SAR................... |
n/a |
|
|
|
|
n/a |
Ireland................................... |
n/a |
|
|
|
|
n/a |
Italy....................................... |
n/a |
|
|
|
|
n/a |
Japan................................... |
n/a |
|
|
|
|
n/a |
Kenya................................... |
n/a |
|
|
|
|
n/a |
Netherlands.......................... |
n/a |
|
|
|
|
n/a |
Nigeria.................................. |
n/a |
|
|
|
|
n/a |
Norway................................. |
n/a |
|
|
|
|
n/a |
Portugal................................ |
n/a |
|
|
|
|
n/a |
Singapore............................. |
n/a |
|
|
|
|
n/a |
Slovak Republic.................... |
n/a |
|
|
|
|
n/a |
Spain.................................... |
n/a |
|
|
|
|
n/a |
Sweden................................ |
n/a |
|
|
|
|
n/a |
Switzerland........................... |
n/a |
|
|
|
|
n/a |
Tanzania................................ |
n/a |
|
|
|
|
n/a |
United Kingdom.................... |
n/a |
|
|
|
|
n/a |
United States........................ |
n/a |
|
|
|
|
|
|
|
|
|
|
|
SOURCE: Moody’s, Moody’s Country Credit Statistical Handbook, May 2012
3.06
Net international investment position to GDP (advanced economies)
This variable refers to a country’s net international investment position as a percent of GDP | 2011
Rank |
Country/economy |
value |
|
|
|
|
|
|
|
|
|
1 |
Hong Kong SAR |
287.70 |
|
|
|
|
|
|
|
|
|
|
|
|
|
|
|
|
|
|
|||
|
|
|
|
|
|
|
|
|
|||
2 |
Singapore 1 |
219.60 |
|
|
|
|
|
|
|
|
|
|
|
|
|
|
|
|
|
|
|||
3 |
.....................Switzerland |
156.90 |
|
|
|
|
|
|
|
|
|
4 |
...........................Norway 1 |
97.20 |
|
|
|
|
|
|
|
|
|
5 |
............................Belgium |
62.60 |
|
|
|
|
|
|
|
|
|
6 |
...............................Japan |
56.30 |
|
|
|
|
|
|
|
|
|
7 |
Netherlands |
37.30 |
|
|
|
|
|
|
|
|
|
|
|
|
|
|
|
|
|
|
|||
8 |
Germany |
36.30 |
|
|
|
|
|
|
|
|
|
|
|
|
|
|
|
|
|
|
|||
9 |
Denmark |
22.10 |
|
|
|
|
|
|
|
|
|
|
|
|
|
|
|
|
|
|
|||
10 |
Finland |
14.10 |
|
|
|
|
|
|
|
|
|
|
|
|
|
|
|
|
|
|
|||
11 |
Austria |
-5.50 |
|
|
|
|
|
|
|
|
|
|
|
|
|
|
|
|
|
|
|||
12 |
Sweden |
-7.00 |
|
|
|
|
|
|
|
|
|
|
|
|
|
|
|
|
|
|
|||
13 |
France |
-10.90 |
|
|
|
|
|
|
|
|
|
|
|
|
|
|
|
|
|
|
|||
14 |
Canada |
-12.00 |
|
|
|
|
|
|
|
|
|
|
|
|
|
|
|
|
|
|
|||
15 |
United Kingdom |
-13.40 |
|
|
|
|
|
|
|
|
|
|
|
|
|
|
|
|
|
|
|||
16 |
United States 1 |
-17.00 |
|
|
|
|
|
|
|
|
|
|
|
|
|
|
|
|
|
|
|||
|
|
|
|
|
|
|
|
|
|||
17 |
.................................Italy |
-21.80 |
|
|
|
|
|
|
|
|
|
18 |
Australia |
-59.30 |
|
|
|
|
|
|
|
|
|
|
|
|
|
|
|
|
|
|
|||
19 |
Slovak Republic |
-64.50 |
|
|
|
|
|
|
|
|
|
|
|
|
|
|
|
|
|
|
|||
20 |
Greece |
-79.20 |
|
|
|
|
|
|
|
|
|
|
|
|
|
|
|
|
|
|
|||
21 |
Spain |
-92.10 |
|
|
|
|
|
|
|
|
|
|
|
|
|
|
|
|
|
|
|||
22 |
...........................Ireland |
-101.90 |
|
|
|
|
|
|
|
|
|
23 |
........................Portugal |
-103.70 |
|
|
|
|
|
|
|
|
|
n/a |
Argentina.............................. |
n/a |
|
|
|
|
|
|
|
|
|
n/a |
Bahrain................................. |
n/a |
|
|
|
|
|
|
|
|
|
n/a |
Bangladesh........................... |
n/a |
|
|
|
|
|
|
|
|
|
n/a |
Brazil..................................... |
n/a |
|
|
|
|
|
|
|
|
|
n/a |
Chile..................................... |
n/a |
|
|
|
|
|
|
|
|
|
n/a |
China.................................... |
n/a |
|
|
|
|
|
|
|
|
|
n/a |
Colombia.............................. |
n/a |
|
|
|
|
|
|
|
|
|
n/a |
Czech Republic..................... |
n/a |
|
|
|
|
|
|
|
|
|
n/a |
Egypt.................................... |
n/a |
|
|
|
|
|
|
|
|
|
n/a |
Ghana................................... |
n/a |
|
|
|
|
|
|
|
|
|
n/a |
Hungary................................ |
n/a |
|
|
|
|
|
|
|
|
|
n/a |
India...................................... |
n/a |
|
|
|
|
|
|
|
|
|
n/a |
Indonesia.............................. |
n/a |
|
|
|
|
|
|
|
|
|
n/a |
Israel..................................... |
n/a |
|
|
|
|
|
|
|
|
|
n/a |
Jordan.................................. |
n/a |
|
|
|
|
|
|
|
|
|
n/a |
Kazakhstan........................... |
n/a |
|
|
|
|
|
|
|
|
|
n/a |
Kenya................................... |
n/a |
|
|
|
|
|
|
|
|
|
n/a |
Korea, Rep........................... |
n/a |
|
|
|
|
|
|
|
|
|
n/a |
Kuwait.................................. |
n/a |
|
|
|
|
|
|
|
|
|
n/a |
Malaysia................................ |
n/a |
|
|
|
|
|
|
|
|
|
n/a |
Mexico.................................. |
n/a |
|
|
|
|
|
|
|
|
|
n/a |
Morocco............................... |
n/a |
|
|
|
|
|
|
|
|
|
n/a |
Nigeria.................................. |
n/a |
|
|
|
|
|
|
|
|
|
n/a |
Pakistan................................ |
n/a |
|
|
|
|
|
|
|
|
|
n/a |
Panama................................ |
n/a |
|
|
|
|
|
|
|
|
|
n/a |
Peru...................................... |
n/a |
|
|
|
|
|
|
|
|
|
n/a |
Philippines............................ |
n/a |
|
|
|
|
|
|
|
|
|
n/a |
Poland.................................. |
n/a |
|
|
|
|
|
|
|
|
|
n/a |
Romania............................... |
n/a |
|
|
|
|
|
|
|
|
|
n/a |
Russian Federation............... |
n/a |
|
|
|
|
|
|
|
|
|
n/a |
Saudi Arabia......................... |
n/a |
|
|
|
|
|
|
|
|
|
n/a |
South Africa.......................... |
n/a |
|
|
|
|
|
|
|
|
|
n/a |
Tanzania................................ |
n/a |
|
|
|
|
|
|
|
|
|
n/a |
Thailand................................ |
n/a |
|
|
|
|
|
|
|
|
|
n/a |
Turkey................................... |
n/a |
|
|
|
|
|
|
|
|
|
n/a |
Ukraine................................. |
n/a |
|
|
|
|
|
|
|
|
|
n/a |
United Arab Emirates............ |
n/a |
|
|
|
|
|
|
|
|
|
n/a |
Venezuela............................. |
n/a |
|
|
|
|
|
|
|
|
|
n/a |
Vietnam................................ |
n/a |
|
|
|
|
|
|
|
|
|
|
|
|
|
|
|
|
|
|
|
|
|
SOURCE: Moody’s,. Moody’s Country Credit Statistical Handbook, May 2012
1 2010
344 | The Financial Development Report 2012