

1_c034415
.pdfDownloaded by 94.180.100.60 on November 25, 2018 | http://arc.aiaa.org | DOI: 10.2514/1.C034415
JOURNAL OF AIRCRAFT
Vol. 55, No. 3, May–June 2018
Basic Understanding of Airfoil Characteristics at Low
Reynolds Numbers (104–105)
Justin Winslow, Hikaru Otsuka,† Bharath Govindarajan,‡ and Inderjit Chopra§
University of Maryland, College Park, Maryland 20742
DOI: 10.2514/1.C034415
A computational study has been conducted on various airfoils to simulate flows at Reynolds numbers (Re) primarily between 104 and 105 to provide understanding and guidance for MAV and other low-Reynolds-number designs. The computational fluid dynamics tool used in this study is a Reynolds-averaged Navier–Stokes solver with a Spalart–Allmaras turbulence model and a correlation-based laminar–turbulent boundary-layer transition model. The airfoils investigated in this study include NACA 0009, NACA 0012 (conventional and reversed configuration), Clark-Y, flat plate airfoils (1, 3, and 5% thickness), and thin cambered plates (3, 6, and 9% camber). Airfoils were examined for lift and drag performance as well as surface pressure and flow field characteristics. In general, it is observed that below the Reynolds number of 106, lift and drag characteristics for most airfoils cannot be assumed to be constant with the Reynolds number. Below the Reynolds number of 105, cambered plate airfoils are shown to have better lift and drag characteristics than thick conventional airfoils with rounded-leading edges. Flat plate performance is generally invariant to the Reynolds number, but performance improves as thickness is decreased for a given Reynolds number.
I.Introduction
RECENT technological advances in compact electronics and power storage, combined with the growing need for situational awareness in urban military combat scenarios, have provided the impetus for current micro air vehicle (MAV) interests. Further motivation behind developing these vehicles is driven largely by potential military and civilian applications, with possible extension into research and commercial sections. These vehicles could be used to investigate dull, dirty, and dangerous environments, such as reconnaissance, into hostile territory or scouting missions where the risk of endangering human life is high: environments that are challenging for conventional aircraft and large-scale unmanned aerial vehicles (UAVs). Recent interest has also been generated for Mars exploration UAVs as a fast and mobile alternative to ground-based
rovers.
A common theme across these vehicles is the small geometric scales the rotating wings, that is, rotors, are required to operate, which effectively results in very-low-Reynolds-number (Re) flow around the blades. With respect to the Mars mission, the low atmospheric density and temperature on Mars result in low-Reynolds-number aerodynamics playing a vital role in aerial vehicle design [1]. Low-Reynolds-number flows are characterized by the increasing importance of viscous forces within the fluid compared with inertial forces. Consequently, boundary-layer physics such as flow separation, re-attachment zones, and the amount of laminar/turbulent flow on the airfoil varies. Therefore, caution must be exercised when using geometrically scaled airfoils from full-scale to small-scale regimes as they might not provide the best possible aerodynamic performance.
Received 12 February 2017; revision received 30 August 2017; accepted for publication 13 September 2017; published online Open Access 13 December 2017. Copyright © 2017 by Winslow, Otsuka, Govindarajan, and Chopra. Published by the American Institute of Aeronautics and Astronautics, Inc., with permission. All requests for copying and permission to reprint should be submitted to CCC at www.copyright.com; employ the ISSN 00218669 (print) or 1533-3868 (online) to initiate your request. See also AIAA Rights and Permissions www.aiaa.org/randp.
*Graduate Research Assistant, Department of Aerospace Engineering, Alfred Gessow Rotorcraft Center; jwinslow@umd.edu.
†Visiting Student, Alfred Gessow Rotorcraft Center; h-otsuka@frl.mech. tohoku.ac.hp.
‡Assistant Research Professor, Alfred Gessow Rotorcraft Center; bharath@umd.edu.
§Distinguised University Professor, Alfred Gessow Professor and Director, Alfred Gessow Rotorcraft Center; chopra@umd.edu. Fellow AIAA.
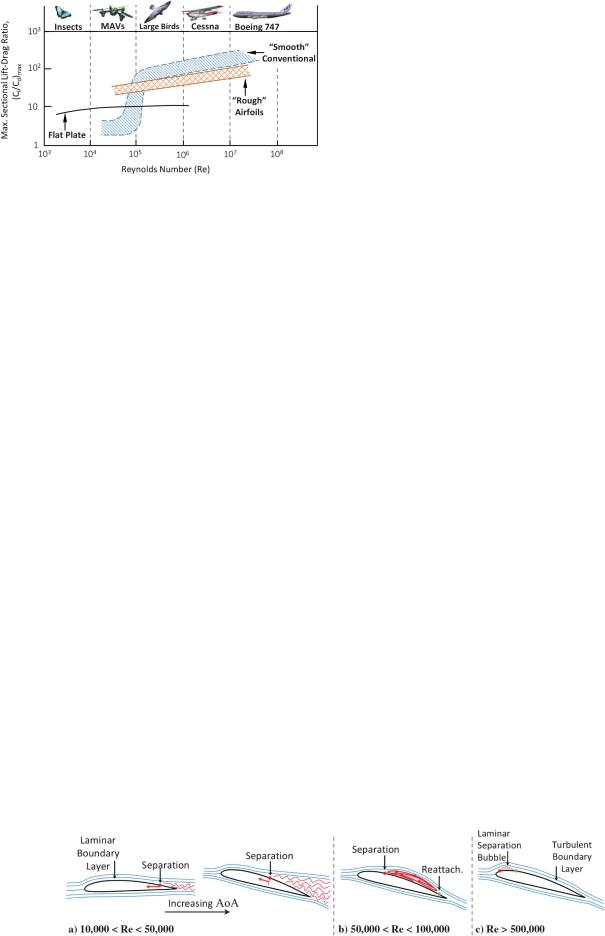
In previous studies, most researchers have generally focused on 105 < Re < 106 as the low-Reynolds-number range. However, this range excludes further lower Reynolds numbers, that is, less than 105, which is of most interest to MAV, UAV, and low-speed flight designers. Therefore, in the present work, a chord-based Reynolds number range between 104 and 105 is defined as the low-Reynolds- number range. Note that this range is two orders of magnitude lower than that of large-scale conventional aircraft, which typically operate at a Reynolds number of over 106. Although large-scale airfoil characteristics, such as high thickness-to-chord ratio (t∕c), rounded leading edge, and smooth surfaces, have been extensively researched and optimized for decades, these design characteristics may not be directly applicable to the low-Reynolds-number regime. Figure 1 shows the variation of maximum sectional lift-to-drag ratio with the Reynolds number and it can be seen that the Reynolds number has a strong effect on conventional airfoil performance. Although conventional airfoils perform best at high Reynolds numbers (>106), their performance quickly deteriorates at a lower Reynolds number and a geometrically simple flat-plate outperforms the conventional airfoil. Therefore, it is evident that simply trying to downsize these airfoils to low-Reynolds-number scales (below 105) drastically reduces their aerodynamic efficiency in terms of the lift-to-drag ratio [2,3]. Consequently, aerodynamic bodies operating at low Reynolds numbers with conventional airfoils incur high power requirements because of excessive aerodynamic drag. Therefore, there is a need to systematically understand the performance of airfoils at these low Reynolds numbers and their sensitivities to geometric variations, such as camber and thickness.
II.Flow Separation Physics
Before investigating the effect of different airfoil parameters have on their aerodynamic performance, a brief description of the separation physics is presented with respect to variation in Reynolds numbers. Flow field studies, such as particle image velocimetry (PIV), smoke flow visualization, and hot-wire turbulence measurement, have been conducted by previous researchers to provide a physical insight into the effect of the Reynolds number, highlighting the difference between lowand high-Reynolds-number flows. It is known that the sensitivity of airfoil performance at different Reynolds number ranges is strongly related to its boundary-layer characteristics.
Figure 2 shows a schematic of the streamlines over a representative airfoil at various Reynolds numbers for a moderate angle of attack. At higher, more conventional Reynolds numbers (>500;000), represented in Fig. 2c, laminar flow over the upper airfoil surface is subjected to a large adverse pressure gradient close to the leading edge. Because of the
1050
Downloaded by 94.180.100.60 on November 25, 2018 | http://arc.aiaa.org | DOI: 10.2514/1.C034415
WINSLOW ET AL. |
1051 |
Fig. 1 Effect of Reynolds number on airfoil maximum sectional lift-to-drag ratio. (Adapted from McMasters and Henderson [2] and Mueller [3].)
inherently lower kinetic energy of the laminar boundary layer, the flow separates as a shear layer. This shear layer gains momentum from the free-stream and reattaches as a turbulent boundary layer, creating a laminar separation bubble (LSB) [4]. Because the turbulent boundary layer is energized from the free-stream, it is much less prone to separation and usually remains attached till the trailing edge. However, at sufficiently high angles of attack, the turbulent boundary layer will begin to separate close to the trailing edge, resulting in increased pressure drag and decreased lift. As the angle of attack is further increased, the turbulent separation point propagates along the airfoil surface toward the leading edge and in doing so, the drag rises dramatically along with an abrupt drop in lift. The airfoil is considered stalled. This form of separation is known as trailing edge separation and is typically associated with thick, rounded leading edge airfoils.
At lower Reynolds numbers (50;000 < Re < 100;000), the separation bubble and turbulent boundary-layer thickness both increase in size (a consequence of the higher contribution of the viscous forces), resulting in increased parasitic drag. As shown in Fig. 2b, the separated shear layer still gains enough momentum from the free-stream to reattach to the airfoil surface as a turbulent boundary layer. However, in this Reynolds number range, the reattachment point is relatively far back on the airfoil. As the angle of attack increases, the reattachment point moves toward the trailing edge, creating relatively large separation bubbles (15–40% chord) [5]. When the airfoil is close to stall, the flow fluctuates between reattachment and complete separation, resulting in hysteresis, which can result in an unsteady aerodynamic phenomenon with large variations in pitching moment as well. From an experimental standpoint, lift and drag measurements are difficult to quantify, resulting in large uncertainty bands.
At much lower Reynolds numbers, that is, 104 < Re < 5 × 10⁴, shown in Fig. 2a, the laminar separation point is delayed until close to the trailing edge of the airfoil, even at very low angles of attack, because of the increased stability of the boundary layer, which is more resistant to flow transition [5]. As the angle of attack increases, the separation point moves toward the leading edge, resulting in a pronounced shear layer. Unlike at higher Reynolds numbers, the shear layer is unable to transition and reattach on to the airfoil as a turbulent boundary layer, resulting in high-pressure drag and poor lift generation [5]. The airfoil is effectively in trailing edge stall for most or all of its operational range. The trailing edge separation increases
in size as the Reynolds number is further decreased for a given angle of attack, resulting in even lower airfoil efficiencies [6].
III.Previous Studies
The effects of decreasing the Reynolds number on airfoil performance were initially investigated by researchers, such as Schmitz [7], as early as 1930. Schmitz conducted experiments on three airfoils, a thin flat plate, thin cambered plate, and a conventional N60 airfoil (12.4% t∕c, 4% camber), within a Reynolds number range of 2 × 10⁴ to 2 × 10⁵. This study resulted in two key conclusions: 1) thin plate airfoils consistently performed better below Re 105, and 2) the flow is more susceptible to separation below a Reynolds number of 105, especially for the thicker N60. In the 1980s, interest in low-Re aerodynamics was renewed by researchers, such as Mueller, Selig, and Hoerner, whose studies [8] also agreed with those of Schmitz’s experiments. Specifically, thin flat and cambered plates are more efficient than conventional airfoils below the Reynolds number of 105. Another observation was that cambered plates show small variations in the lift coefficient (cl) and drag coefficient (cd) with the Reynolds number, whereas flat plates remain virtually unchanged, which is also evident from Fig. 1. Hoerner showed that between Reynolds numbers
of 4 × 10⁴ and 1.2 × 10⁵, the maximum lift coefficient (clmax ) of the cambered plate rose by 4%, whereas that of the N60 airfoil rose by over
180% [8]. Further low-Reynolds-number experiments by Selig et al. [9] and Mueller and Batill [10] on a range of airfoils also concluded that clmax consistently increases with higher Reynolds numbers and that the minimum drag coefficient significantly decreases above a Reynolds number of 105. Selig further observed that for the 60 sailplane-type airfoils tested, the drag polar was visually similar and was nearly insensitive to Reynolds number variations once above 105. But below this threshold, there was a large degree of nonlinearity in the drag polar at different Reynolds numbers [9]. The initial results from each of these studies indicated that low-Reynolds-number airfoil performance was highly sensitive to the airfoil geometry and the specific Reynolds number at which they operate.
Although the experimental measurements of previous studies are useful for understanding trends in low-Reynolds-number aerodynamics, they also have their limitations. Previous studies on Reynolds numbers below 105 typically contain lift and drag data only for a single Reynolds number [11] for each airfoil, which is not sufficient to fully characterize its performance across the spectrum. Furthermore, the data sets that are below 105 contain uncertainties and discrepancies. For instance, drag measurements taken on the E387 airfoil (9.1% t∕c, 3.2% camber) at a Reynolds number of 6 × 10⁴ have been shown to vary by 28–68% between independent measurements, which have been taken at different facilities [12], whereas at a higher Reynolds number of 2 × 10⁵, the drag measurements were much more consistent and varied by less than 13% [12], which is still a significant margin around the mean. These discrepancies are due to factors such as the drag measurement method used (wake-momentum deficit [13] or load measurement), inadequate force measurement sensitivity [14], and wind tunnel turbulence levels [15]. Additionally, below 105 small changes in a Reynolds number have a much more prominent effect on airfoil performance than they would at a higher Reynolds number. It has been shown that for the NACA 0012 airfoil, the lift curve is highly nonlinear [16], particularly below 5 × 10⁴, resulting in the lift coefficient at the Reynolds number 5 × 10⁴ being three times higher than that at 104 for a given angle of attack [16]. As noted previously, many of the airfoils tested below a Reynolds number
Fig. 2 Illustration highlighting conventional airfoil separation characteristics at different Reynolds number regimes below 106.
Downloaded by 94.180.100.60 on November 25, 2018 | http://arc.aiaa.org | DOI: 10.2514/1.C034415
1052 |
WINSLOW ET AL. |
of 105 were done so for very specific conditions, resulting in sporadic test data, which is insufficient to capture the performance sensitivity of the airfoils to the Reynolds number.
On the one hand, it may be possible to perform a large number of experiments to assess the performance characteristics of various airfoils at different Reynolds numbers over a wide range of angles of attack and Mach numbers. However, these tests can be prohibitively expensive and time-consuming, making them practically infeasible. On the other hand, computational fluid dynamics (CFD) has been significantly refined over the past three decades and has now been routinely used by academia and industry to the point of accurately predicting both internal and external aerodynamic flows past complex geometries. CFD is being extensively used to design and predict the performance of a wide range of singleand multi-element airfoils. Therefore, the goal of the present work is to use an in-house computational tool capable of generating reliable lift, drag, and moment data for an arbitrary twodimensional (2D) airfoil at different Reynolds numbers to extract useful trends from the data to 1) understand the behavior of airfoils at these low Reynolds numbers, and 2) provide insight and guidance for low-Reynolds-number designers.
IV. Computational Method
The CFD solver used in this study to investigate low-Reynolds- number aerodynamics is the Transonic Unsteady Rotor Navier–Stokes 2D (TURNS2D) fluid dynamics solver developed in-house [17]. TURNS2D has been widely used in the past for flows past airfoil and rotor blades at high Reynolds numbers with confidence. TURNS2D uses a dual-volume formulation to solve for the Reynolds-averaged Navier–Stokes (RANS) equations. The inviscid fluxes are computed using a third-order MUSCL reconstruction scheme in conjunction with Roe’s scheme, whereas the viscous fluxes are evaluated using a second-order central difference. For steady problems, an Euler implicit formulation was used for time marching, with the matrix inversion performed using a lower–upper symmetric line–Gauss Seidel approach. It has been previously recognized that at low Reynolds numbers, the flow is laminar, which can then possibly transition to the turbulent regime. Therefore, it is imperative that the solver not assume a fully laminar or a fully turbulent flow over the airfoil. A key feature in TURNS2D is the inclusion of a laminar–turbulent transition model coupled with the Spalart–Allmaras (SA) turbulence model [18], which improves the numerical solution by better predicting the flow transition physics. The formulation keeps track of the “intermittency” in the flow, whose value varies between 0 and 1, indicating a fully laminar or fully turbulent flow, respectively. RANS equations were solved using TURNS2D to generate sectional coefficients of surface pressure (cp), skin friction (cf), lift (cl), drag (cd), and pitching moment (cm) under given set of flow conditions.
A C-mesh was used as the grid type around the airfoil with an outer boundary at 15 chord lengths away from the airfoil surface. Mesh sizes typically contained 267 grid points in the surface-wrap direction and 123 grid points in the wall-normal direction. Grid spacing within the boundary layer in the normal direction was 0.001% of the chord length. The freestream Mach number was fixed at 0.1 because the majority of studies did not report an exact Mach number, and the flows were assumed to be within the incompressible range. TURNS2D contains a low-Mach preconditioner to aid in the convergence of flows at these low Mach numbers. The above parameters were found to be sufficient for solution convergence at the range of low Reynolds numbers investigated.
V.Results and Discussion
A.TURNS2D Validation
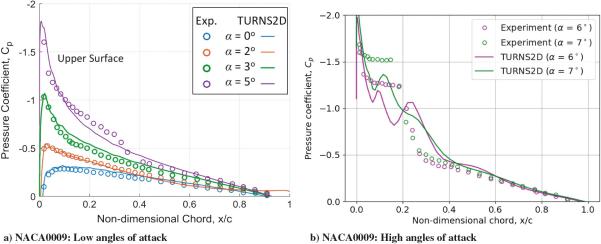
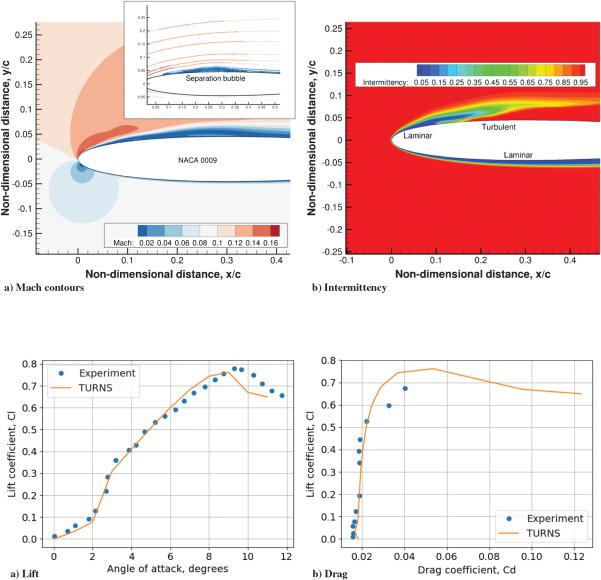
To demonstrate the capability of TURNS2D, validation cases were carried out by comparing previous experimental results to current computational results. Figures 3a and 3b show the pressure distribution on the upper surface of a NACA 0009 airfoil at various angles of attack at a Reynolds number of 5 × 10⁴. Experimental results for lift, drag, and pressure distribution were reported by Lutz et al. [19]. The open circles represent experimental data and the solid lines represent numerical predictions. It is evident that at low angles of attack (α ≤ 5 deg ), the pressure distribution predicted by TURNS2D agrees well with experimental data and the location and magnitude of the pressure peak captured quite accurately. At higher angles of attack, as shown in Fig. 3b, the agreement is less satisfactory but still follows the trend as the angle of attack increases. It should be noted that at these very low Reynolds numbers, significant separation is observed on the upper surface of the airfoil even at moderately high angles of attack, and is captured to some extent in the current prediction, but not in its entirety. The incorrect prediction of the plateau in the pressure curve could be attributed to modification required in the transition model employed within the CFD formulation for low-Re flows. Figure 4a shows the Mach contours of the flow along with the streamlines for an angle of attack of 6 deg and a Reynolds number of 50,000. The streamlines on the upper surface show the process of flow separation and reattachment at this moderate angle of attack. Furthermore, Fig. 4b shows the intermittency contours around the airfoil, which varies from 0 (fully laminar) to 1 (fully turbulent). The flow on the upper surface is laminar, which through a separation bubble, reattaches and transitions to a turbulent flow. The lower surface remains laminar for much of its chord length. However, as noted previously, there are discrepancies in the pressure distribution between the experiments and numerical predictions.
Figures 5a and 5b show the lift and drag comparison, respectively, for the NACA 0009 airfoil at a Reynolds number of 5 × 10⁴ between
Fig. 3 Nondimensional pressure over the upper surface of a NACA0009 airfoil for low (a) and high (b) angles of attack at an Re of 5 × 10⁴. (Experimental data from Lutz et al. [19].)
WINSLOW ET AL. |
1053 |
Downloaded by 94.180.100.60 on November 25, 2018 | http://arc.aiaa.org | DOI: 10.2514/1.C034415
Fig. 4 Mach number and intermittency contours at 6 deg angle of attack for the NACA 0009 highlighting the presence of flow transition on the upper surface.
Fig. 5 Lift and drag comparison of TURNS2D with experiments for NACA 0009 at an Re of 5 × 10⁴. (Experimental data from Lutz et al. [19].)
experiments [19] and CFD predictions for a range of angles of attack. It can be seen that the lift and drag curve predictions from TURNS2D compare very well with experiments until close to stall. The nonlinear behavior in lift is well-captured by TURNS2D. Near stall conditions, the SA model and the transition model may be limited because of the large separated regions of flow. The SA turbulence model within RANS is known to overpredict the eddy viscosity, which tends to lead to high rates of dissipation in the flow. To better predict the onset of stall and the immediate poststall characteristics, either a large-Eddy simulation or a detached Eddy simulation may be required, which is beyond the scope of the present study.
B. Effect of Reynolds Number on NACA 0012
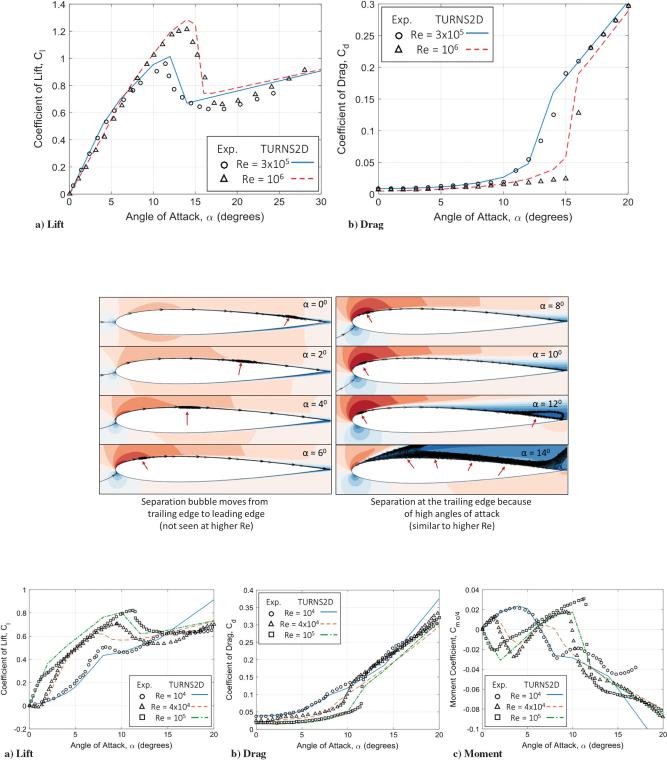
The NACA 0012 is a widely popular airfoil, which has been experimentally tested for a wide range of Reynolds numbers. Therefore, these experimental results serve a dual purpose of validating the numerical simulation at various Reynolds numbers, while providing insight into the effects of the Reynolds number on airfoil performance. Figures 6a and 6b show the comparison of lift and drag, respectively, between TURNS2D and experimental measurements taken at Sandia National Laboratories [20] at two Reynolds numbers of 3 × 10⁵ and 1.8 × 10⁶. TURNS2D follows the experimental observation quite well except for some deviation in the magnitude of lift and drag in the stall region, which is expected from RANS-based models. A 23% drop in
peak lift coefficient was observed in decreasing the Reynolds number from 106 to 3 × 10⁵. The drag also rises at a lower angle of attack as the Reynolds number is decreased, indicating early onset of flow separation. Whereas a linear lift-curve slope was observed at the higher Reynolds number of 1 million, a nonlinear behavior was observed at the lower Reynolds number.
The reason for this nonlinearity was mentioned by Ohtake et al. [16], which was linked to the presence of flow separation on the upper surface of the airfoil at different angles of attack. A comparison was made between various angles of attack between 0 and 14 deg at a Reynolds number of 3 × 10⁵ for the NACA0012 airfoil. The Mach contour and streamlines close to the surface are shown in Fig. 7. The nonlinear phenomenon of the lift curve slope can be explained by the existence of two separate phenomena that occur for the low-Reynolds-number flows. From the angle of attack of 0 to 8 deg, there is a separation bubble on the upper surface of the airfoil that travels from the trailing edge to the leading edge, effectively changing the point of flow transition from laminar to turbulent. This separation bubble travel was not observed in the higher-Reynolds-number case of 1 × 10⁶. Second, after 8 deg, there is the presence of a conventional trailing edge separation bubble formed as the angle of attack increases till the point of complete separation on the upper surface of the airfoil, that is, stall, at around an angle of attack of 12–14 deg. These two phenomena could explain the two slopes observed in the lift curve diagram at lower Reynolds numbers.
1054 |
WINSLOW ET AL. |
Downloaded by 94.180.100.60 on November 25, 2018 | http://arc.aiaa.org | DOI: 10.2514/1.C034415
Fig. 6 High-Reynolds-number lift and drag comparison of CFD predictions for NACA0012 at Reynolds numbers of 3 × 10⁵ and 1 × 10⁶. (Experimental data from Sheldahl and Klimas [20].)
Fig. 7 Process of separation bubble travel at a lower Reynolds number of 3 × 10⁵. Red arrow highlights the separation bubble.
Fig. 8 Lift, drag, and pitching moment comparison of CFD predictions for NACA0012 between Reynolds numbers of 104 and 105. (Experimental data from Ohtake et al. [16].)
Figure 8 shows the comparison of lift, drag, and pitching moment for the NACA 0012 airfoil at various low Reynolds numbers between 104 and 105. The results show an extreme sensitivity of airfoil performance to changing Reynolds numbers below 105. As the Reynolds number decreases, there is an increase in drag (again, possibly because of premature separation of the laminar boundary layer). This separation can be inferred from a large decrease in lift and the shrinking of the drag bucket, as shown in Figs. 8a and 8b, respectively. The peak lift coefficient decreases by approximately 46% with an order drop in magnitude of the Reynolds number from 105 to 104. Unlike the higher
Reynolds number (see Fig. 6), the lift curves are highly nonlinear, particularly for α < 5 deg , and consequently, a single lift-curve-slope value cannot be assumed in this range. It should also be noted that the drag bucket is significantly smaller at a low Reynolds number and the minimum drag increases compared with the minimum drag in Fig. 6b. Although TURNS2D has difficulty in predicting some of the exact values as noted by experiments, the general trend is well captured. The moment curves are shown to vary significantly as the Reynolds number changes and a clear trend is not identifiable, but these are still predicted moderately well.
Downloaded by 94.180.100.60 on November 25, 2018 | http://arc.aiaa.org | DOI: 10.2514/1.C034415
WINSLOW ET AL. |
1055 |
Fig. 9 Effect of flat plate thickness on lift and drag at a Reynolds number of 104. (Experimental data from Okamoto et al. [21].)
C. Effect of Thickness on Flat Plates
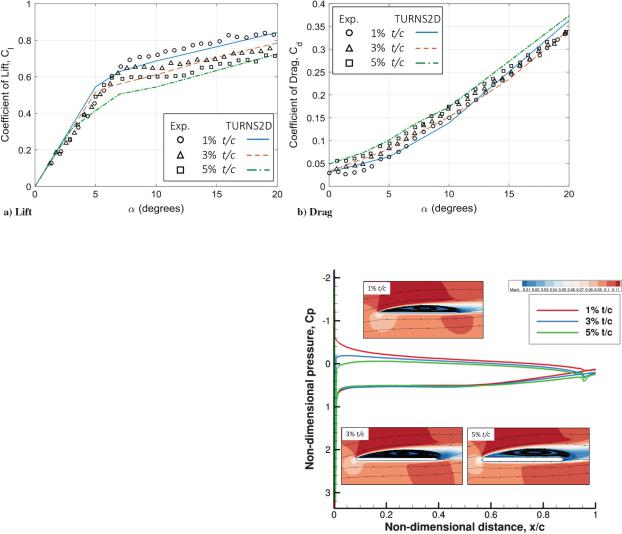
Specific airfoil characteristics, such as camber and thickness, heavily affect airfoil lift and drag qualities. Figure 9 shows the variation in lift and drag against angle of attack for conventional flat plates of varying thickness (t∕c of 1, 3, and 5%) at a Reynolds number of 104. Results are shown from both TURNS2D and experimental measurements. It is evident that as flat plate thickness-to-chord (t∕c) decreases, lift and drag characteristics improved, with the 1% flat plate being the most efficient. Thicker flat plates tend to increase the pressure drag and, therefore, results in poorer aerodynamic performance compared with thin plates. For each flat plate, the lift-curve slope is generally constant up to approximately an angle of attack of 7 deg, after which the slope abruptly changes to a much shallower value, as shown in Fig. 9a. However, the high lift-curve slope is maintained to higher angles of attack as the t∕c ratio is decreased. Furthermore, flat plate drag decreases as t∕c decreases, as shown in Fig. 9b. The drag coefficient appears to decrease with lower t∕c between 0 deg < α < 10 deg and then converges to similar values at higher angles of attack (≈20 deg ), a trend that is not particularly well captured by TURNS2D. Therefore, minimum t∕c was observed to be a key characteristic for increased aerodynamic efficiency at low Reynolds numbers.
An explanation for the decreased performance as the flat plate t∕c increases is the increased separation of the flow around the airfoil. The thicker the flat plate, the more exacerbated the sharp corner is at the leading edge. This increased “bluntness” of the airfoil leading edge increases the strength of the adverse pressure gradient, causing the laminar flow to separate very close to the leading edge, resulting in higher form drag. Furthermore, the increased separation observed for thicker flat plates reduces the pressure differential between the upper and lower surfaces, thus reducing its lifting force. Figure 10 shows the surface pressure distribution and Mach contours (with streamlines) on flat plates of various thickness-to-chord ratios (1, 3, and 5%) at an angle of attack of 5 deg and a Reynolds number of 104. The large suction peak for the lower-thickness plates is the primary source of higher lift. As in all three cases, the flow is almost entirely separated from the upper surface. Furthermore, a plot of nondimensional pressure (Cp) versus z∕c was examined to verify that the pressure-drag is indeed higher for the thicker flat plates. However, as the plots are rectangles (z∕c is constant across the upper surface and lower surface, respectively), they are not presented in the paper.
D. Effect of Camber on Thin Plates
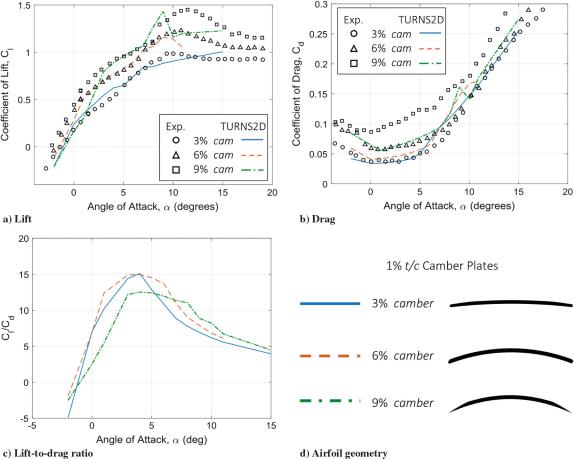
To understand the performance trends at low Reynolds numbers arising from camber, thin plates with a varying camber were investigated. Figure 11 shows the lift and drag at various angles of attack for 1% thick flat plates with cambers of 3, 6, and 9% at a Reynolds number of 104. Results are shown from TURNS2D and compared against experimental measurements of Okamoto et al. [21]. The results show that as camber is increased, so does the lift curve and peak lift by a significant margin. An increase of 47% in the
Fig. 10 Mach contours and surface pressure over flat plates of different thickness at 5 deg angle of attack for a Reynolds number of 104.
maximum lift coefficient was observed as the camber increased from 3 to 9%. However, there was also an increase in drag as the camber was increased—most pronounced for the 9% camber.
Although the general trend in lift and drag is captured by TURNS2D, the magnitude of lift and drag is not accurately predicted. The discrepancy was linked to the transition model used in TURNS2D and perhaps its limitation in assessing the transition characteristics of low-Reynolds-number flows. The transition model employed within TURNS2D was calibrated such that the source terms of the intermittency transport equation were tuned to match the transition onset locations from T3-series zero-pressure gradient flat experiments [18]. It is not entirely clear how this transition model will work for low-Reynolds-number flows and highly cambered flat plates, which encounter signification adverse pressure gradients. The other variable is the free-stream turbulence intensity (FSTI), which was set to 0.03% in the present study. The variation of lift and drag to FSTI is not entirely clear and will be studied in the future.
Figure 11c shows the lift-to-drag ratio of each cambered plate as predicted by TURNS2D, a combination of the data presented in Figs. 11a and 11b. It is evident that despite the higher lift coefficient of the 9% camber when compared with the other camber ratios, a moderate camber of 6% yields the highest lift-to-drag of 15. While the 3% camber airfoil also has a similar value of peak lift-to-drag, the 6% camber flat plate was able to maintain a higher lift-to-drag ratio over a wider range of angles of attack, which would be preferred from a design standpoint, that is, robustness in design. Clearly, camber has a strong effect on low-Reynolds-number aerodynamic performance.
1056 |
WINSLOW ET AL. |
Downloaded by 94.180.100.60 on November 25, 2018 | http://arc.aiaa.org | DOI: 10.2514/1.C034415
Fig. 11 Effect of thin plate (t∕c1%) camber on lift, drag, and lift-to-drag at a Reynolds number of 104. (Experimental data from Okamoto et al. [21].)
The effect of increasing the airfoil camber causes a greater differential change in momentum of the flow around the airfoil, which causes differences in the pressure difference, thus increasing lift. However, the trade-off is that an increase in the camber of the flat plate also increases drag (form drag). When a high camber is introduced, a large separation region is created on the aft end the airfoil. This separation region effectively increases the size of the wake behind the thin plate, which increases the momentum deficit and consequently the drag. At a low Reynolds number (104), the camber value at which the drag increase begins to outweigh the lift gains appears to be at 6%. Based on Fig. 11, a low-Reynolds-number wing design for high-lift application can use a 9% camber, whereas a 6% camber should be used if efficiency is the desired design factor.
Prior results have compared numerical predictions from TURNS2D against various experimental observation of lift, drag, and some pressure distribution for different airfoils at multiple low Reynolds numbers. TURNS2D was observed to capture the magnitudes and trends in the aerodynamic data fairly well, with certain mispredictions close to stall, which in turn could serve as motivation for further developing RANS-based numerical tools and transition models at these low Reynolds numbers. The rest of the Results section is devoted to further understanding the behavior of airfoils based on aerodynamic prediction from TURNS2D.
E. Effect of Reynolds Number on Thin Cambered Airfoils
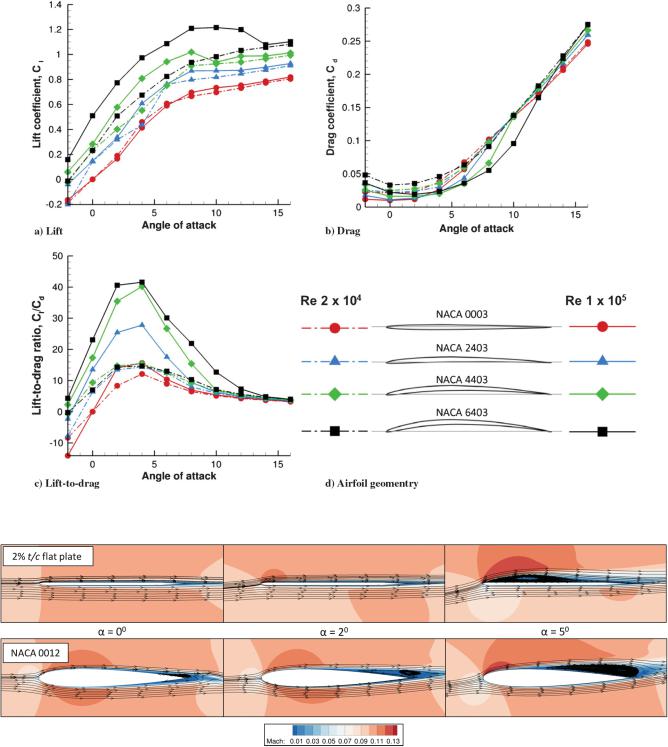
The effect of camber on thin (3% t∕c) NACA airfoils was examined with the use of computational results from TURNS2D. Figure 12 shows the performance results for the symmetric NACA0003 airfoil, 2% cambered NACA2403, 4% cambered NACA4403, and 6% cambered NACA6403 at two Reynolds numbers of 2 × 10⁴ (indicated by the dashed lines) and 1 × 10⁵ (indicated by the solid lines). At both these Reynolds numbers, increasing the camber increases the lift coefficient over the given range of angles of attack. However, the increase in camber
is also accompanied with a drag penalty that is most noticeable via the increase in the base drag coefficient, as shown in Fig. 12b, which is more pronounced for the lower Reynolds number. Consequently, the lift-to-drag curves of the cambered airfoils are similar to each other at the Reynolds number of 2 × 10⁴, but are slightly higher compared with the symmetric airfoil’s lift-to-drag, as shown in Fig. 12c.
However, at a higher Reynolds number of 1 × 10⁵, increasing camber has a more pronounced effect on performance. It is seen in Fig. 12a that increasing the Reynolds number increases the lift coefficient by a larger amount for higher-camber airfoils. Additionally, the base drag decreases as the Reynolds number increases for highercambered airfoils, particularly within the angle-of-attack range of 4–12 deg. Therefore, cumulative performance of the airfoil (reflected in the lift-to-drag curves) is more differentiated than that at the lower Reynolds number and can achieve a maximum lift-to-drag ratio of around 40 compared with a maximum of 15 at a lower Reynolds number of 104. The performance of the symmetric airfoil changes marginally because of a change in the Reynolds number. The above result indicates the degree to which an airfoil performance characteristic is dependent on the operating Reynolds number.
F. Flat Plate and NACA 0012
It was seen in Fig. 1 that simple flat plates outperform conventional airfoils for Reynolds numbers lower than 5 × 10⁴. To obtain a deeper understanding of this rationale as to why certain airfoil characteristics are better suited to low-Reynolds-number flows than others, the flow field solution from TURNS2D was examined. Figure 13 shows the comparisons in Mach contours between the NACA 0012 airfoil and a 2% t∕c flat plate at a Reynolds number of 2 × 10⁴ at three different angles of attack. The key distinguishing factor between the thick NACA 0012 and the thinner flat plate is the difference in boundarylayer separation, inferred from the streamlines shown in Fig. 13. For the NACA 0012, the upper surface boundary layer stays attached for a
WINSLOW ET AL. |
1057 |
Downloaded by 94.180.100.60 on November 25, 2018 | http://arc.aiaa.org | DOI: 10.2514/1.C034415
Fig. 12 Effect of camber on lift, drag, and lift-to-drag ratio for NACA airfoils of 3% t∕c ratio at Reynolds numbers of 2 × 10⁴ and 1 × 10⁵.
Fig. 13 Difference in boundary-layer characteristics between NACA 0012 and 2% t∕c flat plate at a Reynolds number of 2 × 10⁴. Contours represent Mach number.
majority of the airfoil until it separates close to the trailing edge. This separation characteristic is similar to flow-field results from previous studies [5,6] on thick, conventional airfoils at Reynolds numbers less than 5 × 10⁴, that is, a classic representation of trailing edge stall. For the range of angles of attack shown, the flow separates close to the trailing edge to gain momentum from the free-stream and reattach as a turbulent boundary layer. The resulting separation region causes high form drag and prevents the formation of a beneficial drag bucket at low angles of attack.
The large trailing edge separation on the NACA 0012 results in low lift because of the decreased suction pressure on the upper surface.
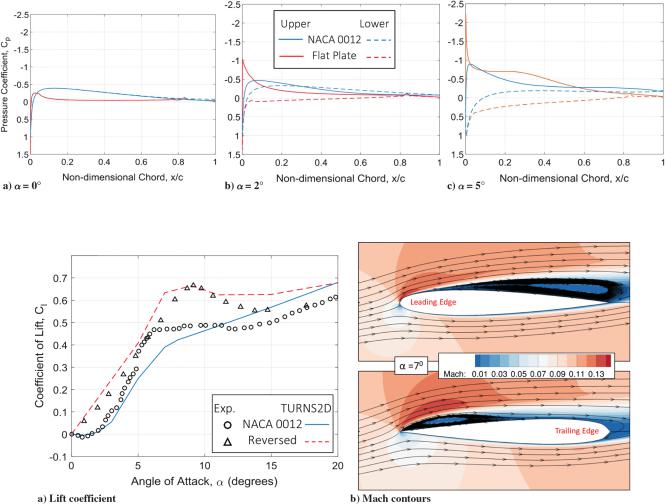
This low-Reynolds-number separation effect is particularly influential on the lift curve for angles of attack of 0 and 2 deg for a Reynolds number of 2 × 10⁴. In this range of angle of attack, the separation region can be large enough such that the upper-surface pressure is higher than the lower-surface pressure for most of the chord. This effect is evident in Fig. 14b at α 2 deg where the upperand lowersurface pressure curves for the NACA 0012 cross at 30% chord. At Reynolds numbers lower than 5 × 10⁴, this pressure difference causes the lift curve slope close to α 0 deg to be shallower than at other angles, and can cause slightly negative lift values as seen in Fig. 8a for a Reynolds number of 4 × 10⁴.
Downloaded by 94.180.100.60 on November 25, 2018 | http://arc.aiaa.org | DOI: 10.2514/1.C034415
1058 |
WINSLOW ET AL. |
Fig. 14 Pressure distribution on the upper and lower surfaces of a NACA 0012 and 2% t∕c flat plate at a Reynolds number of 2 × 10⁴.
Fig. 15 Characteristics of a NACA 0012 airfoil in conventional and reversed configurations at a Reynolds number of 2 × 10⁴ at 7 deg angle of attack. Contours represent nondimensional density. (Experimental data from Laitone [14] and Ohtake et al. [16].)
The pressure distribution over the upper surface of the flat plate in Fig. 14 also indicates the presence of the LSB. At an angle of attack of 5 deg, there is a flattening of the pressure distribution on the upper surface of the thin plate, which is typical of a separation bubble. The reattachment of the upper boundary layer preserves the pressure difference and, therefore, enables the flat plate to provide more lift than the NACA 0012 at a Reynolds number lower than 5 × 10⁴.
The 2% t∕c flat plate airfoil exhibits significantly different flow characteristics than the NACA 0012 in the same flow regime. As seen in Fig. 13, the flat plate does not exhibit trailing edge separation. Instead, the laminar flow is tripped early along the surface by the sharp leading edge. The separated laminar shear layer gains momentum from the free-stream and transitions to a turbulent flow. Because this transition occurs near the leading edge, there is sufficient chord length remaining for the turbulent boundary layer to reattach, forming a leading edge separation bubble. This bubble is most visible at α 5 deg in Fig. 13 for the flat plate.
G. Conventional and Reversed NACA 0012
The effect of reversing airfoils at a low Reynolds number may actually be beneficial depending on the airfoil. The rationale behind the reversing the airfoil is that the sharp trailing edge is now the aerodynamic leading edge, which will promote early separation of the laminar flow and can possibly result in the reattachment of the boundary layer through a separation bubble. In addition to the maximum thickness of the airfoil, its leading edge geometry, that is, sharp or rounded, has a strong effect on its performance. By reversing a symmetric airfoil, the leading edge geometry is essentially changed, but the maximum thickness of the airfoil remains the same.
Figure 15 shows the characteristics of a NACA 0012 in its conventional configuration (rounded leading edge) compared with its reversed configuration. Figure 15a compares the lift variation with angle of attack between experimental data [14,16] and TURNS2D predictions at a Reynolds number of 2 × 10⁴. The reversed configured results in a much higher maximum lift compared with the baseline configuration. In particular, there is a very strong effect on peak lift between angles of attack of 7 and 10 deg. The computational flow fields around the NACA 0012 at α 7 deg provides insight into the difference in lift values. Figure 15b shows that the NACA 0012 in its conventional configuration creates a large separation region over 80% of the upper surface. However, when the NACA 0012 is reversed under the same flow condition, the airfoil behaves more like a flat plate; see Fig. 13. Most notably, the now-sharp leading edge creates a similar separation bubble as seen on the 2% t∕c flat plate, and this separation of the boundary layer on the reversed NACA 0012 allows it to reattach as a turbulent boundary layer further downstream. The flow reattachment maintains lower pressure on the upper surface and subsequently results in increased lift compared with the conventional configuration. Despite the fact that the NACA 0012 has the same maximum thickness in either configuration, these results indicate that the distribution of the thickness along the chord, particularly at the leading edge, has an effect on airfoil performance at a low Reynolds number that is counterintuitive to expectations at higher Reynolds numbers.
H. Overall Reynolds Number Effects
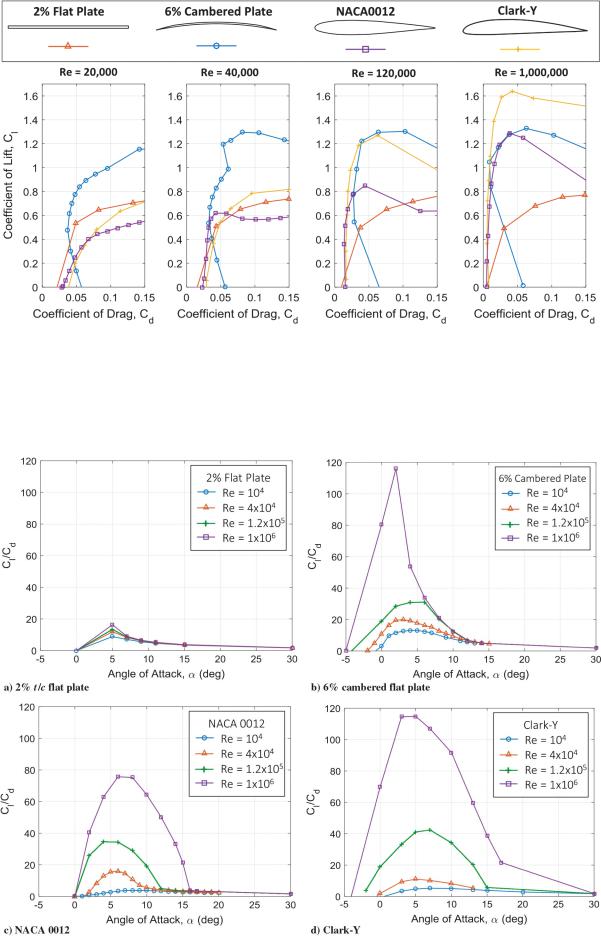
As a concluding study, TURNS2D has been used to determine trends in aerodynamic performance of different airfoils across a range of Reynolds numbers. Figure 16 shows the effect of the Reynolds
Downloaded by 94.180.100.60 on November 25, 2018 | http://arc.aiaa.org | DOI: 10.2514/1.C034415
WINSLOW ET AL. |
1059 |
Fig. 16 Effect of Reynolds number on multiple airfoils in terms of the drag polar.
number (ranging for 2 × 10⁴ to 1 × 10⁶) on multiple types of airfoils: |
NACA 0012 and Clark-Y are much more sensitive to the Reynolds |
a 2% thick flat plate, 6% cambered plate (2% t∕c), NACA 0012, and |
number than plate-type airfoils. As seen in Fig. 16, the peak lift |
Clark-Y. This comparison was conducted to obtain an understanding |
coefficient of the 6% cambered plate increases from approximately |
of Reynolds number effects on vastly different airfoils. The major |
1.15 at a Reynolds number of 2 × 10⁴ to approximately 1.32 at a |
distinguishing factor between the airfoils is that the more conventional |
Reynolds number of 106, and the peak lift coefficient of the flat plate is |
Fig. 17 Effect of Reynolds number on multiple airfoils in terms of lift-to-drag against angle of attack.