

1_c034196
.pdfDownloaded by 94.180.100.60 on November 25, 2018 | http://arc.aiaa.org | DOI: 10.2514/1.C034196
JOURNAL OF AIRCRAFT
Vol. 54, No. 6, November–December 2017
Energy-Based Metrics for Safety Analysis of General Aviation Operations
Tejas Puranik, Hernando Jimenez,† and Dimitri Mavris‡
Georgia Institute of Technology, Atlanta, Georgia 30332-0150
DOI: 10.2514/1.C034196
Energy management and energy state awareness are important concepts in aircraft safety analysis. Many loss-of- control accidents are correlated to poor energy management. Energy-based metrics provide a measurable quantity of the energy state of the aircraft and can be viewed as an objective currency to evaluate various safety-critical conditions. In this work, key energy-based metrics are surveyed from various domains and the challenges of implementing these metrics for general aviation operations are identified. Modifications to existing metrics and the definition of some new energy metrics are proposed. A methodology is developed that can be used to unify and implement all the energy metrics. Two case studies are demonstrated that highlight the potential value of energy metrics in a retrospective flight data analysis setting.
|
Nomenclature |
am |
= acceleration during turn, m∕s2 |
D= drag, N
E= specific total energy, m
Etol |
= tolerance in energy error, m |
_ |
= specific total energy rate, m∕s |
E |
|
^ |
= energy rate demand |
E |
|
e |
= specific energy to turn, m |
g= acceleration due to gravity, m∕s2
h= altitude, ft
m |
= |
mass, kg |
Ps |
= specific excess power, m∕s |
|
T |
= |
thrust, N |
V= velocity, m∕s
W= weight of the aircraft, N
γ= flight-path angle, deg
γE |
= total energy angle, deg |
|
γp |
= potential flight-path angle, deg |
|
δE |
= specific energy error, m |
|
δEn |
= |
normalized energy error |
_ |
= energy error rate, m∕s |
|
δE |
||
η _ |
= |
energy rate efficiency |
ωE |
= angular velocity during turn, rad∕s |
|
I.Introduction
THERE is a great impetus to improve safety across all flight regimes in general aviation (GA) operations. Energy state awareness and energy management are critical concepts in the characterization, detection, and prevention of safety-critical conditions. Poor energy management and loss of energy state awareness have been shown to be top contributors to Loss of Control (LOC) [1] and Controlled Flight Into Terrain (CFIT), which are recognized by the
Presented as Paper 2016-3915 at the 16th AIAA Aviation Technology, Integration, and Operations Conference, Washington, D.C., 13–17 June 2016; received 25 August 2016; revision received 5 March 2017; accepted for publication 6 March 2017; published online Open Access 18 May 2017. Copyright © 2017 by Tejas Puranik, Hernando Jimenez, and Dimitri Mavris. Published by the American Institute of Aeronautics and Astronautics, Inc., with permission. All requests for copying and permission to reprint should be submitted to CCC at www.copyright.com; employ the ISSN 0021-8669 (print) or 1533-3868 (online) to initiate your request. See also AIAA Rights and Permissions www.aiaa.org/randp.
*Graduate Researcher, Daniel Guggenheim School of Aerospace Engineering. Student Member AIAA.
†Research Faculty, Daniel Guggenheim School of Aerospace Engineering. Senior Member AIAA.
‡S.P. Langley NIA Distinguished Regents Professor, Daniel Guggenheim School of Aerospace Engineering. Fellow AIAA.
Federal Aviation Administration (FAA) as the leading causes of fatal accidents in general aviation and by others [2] as leading causes among all aircraft types, operations, and phases of flight. Paradoxically, energy state awareness and management have been addressed almost exclusively in commercial aviation where the concepts are intrinsic in operational safety and have been the subject of much research. Nevertheless, the General Aviation Joint Steering Committee has identified various safety enhancements for new and current GA aircraft intended to improve state awareness such as angle-of-attack systems, stall margin indicators, and stabilized approach indicators [3].
We assert that energy-based metrics (namely, those that characterize the energy state and safety boundary conditions of the aircraft) hold significant potential for improving GA operational safety because they explicitly address poor energy management and state awareness as the top contributing factors underlying LOC and CFIT events.
We further assert that energy-based metrics have no loss generality in the characterization of aircraft states and safety boundaries across the GA fleet, and are therefore preferred over flight parameters such as angle of attack, stall margin, or rate of descent. Previous work in the GA domain by Fala and Marais [4] identified the inconsistency in safety-related event definitions using flight parameters in the approach and landing phase. The heterogeneous nature of GA flight operations and the large variation in the parameters can make the task of defining these events more difficult. Whereas safety boundaries expressed with such flight parameters change from one aircraft to another and states may not be directly comparable, energy metrics provide a common and objective language that is broadly applicable across the spectrum of a very heterogeneous GA fleet.
Lastly, we posit that flight data monitoring (FDM) is extremely well suited as a means to introduce energy management and state awareness to the GA community, as well as to adopt energy-based metrics as a staple in the state of the practice of operational safety assessments. FDMs are voluntary safety programs that aim to improve operational safety with a continuous cycle involving data collection from onboard recorders, retrospective analysis of flight data records, identification of operational safety exceedances, design and implementation of corrective measures, and monitoring to assess their effectiveness. In current FDM practice, safety events are defined a priori as the concurrent exceedance of one or more flight parameters over corresponding threshold values. Implementation of FDM is widespread in commercial aviation and, although it is sparse among GA operators, recent and current efforts seek its introduction and broad adoption in that sector.
In consideration of the preceding, we articulate the needs motivating the work here reported as follows. First, suitable energybased metrics are requisite for retrospective monitoring of energy management in FDM. They must provide an objective and meaningful quantification of the aircraft’s energy state, safety boundaries, and departure from safe or nominal conditions that is consistent with the flight parameters recorded. Second, implementation and evaluation of energy metrics in FDM data analysis using real
2285
2286 |
PURANIK, JIMENEZ, AND MAVRIS |
Downloaded by 94.180.100.60 on November 25, 2018 | http://arc.aiaa.org | DOI: 10.2514/1.C034196
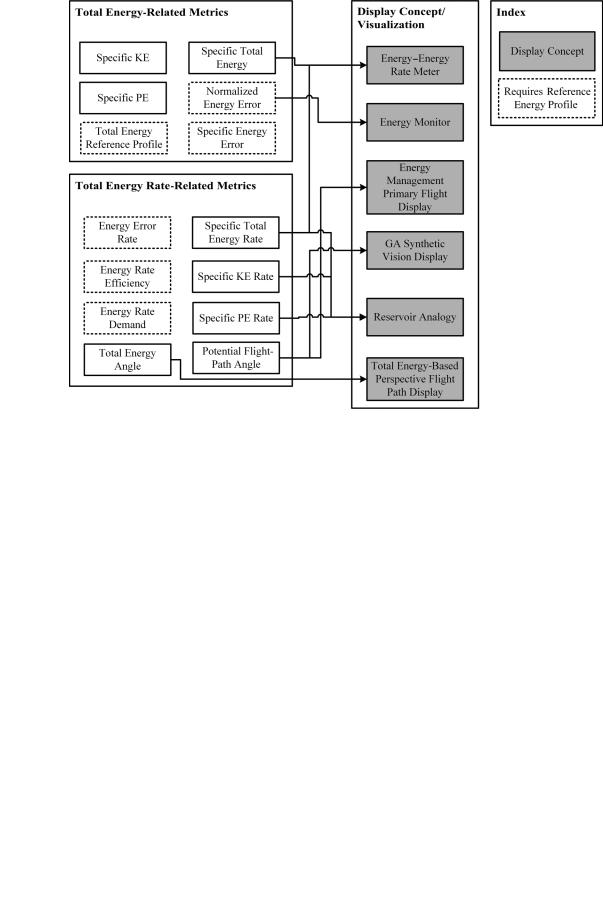
Fig. 1 Summary of energy-based metrics and display concepts in the literature and their relationship.
flight data records are necessary to demonstrate its feasibility and outline practical considerations.
This paper presents key outcomes and contributions to the state of the art resulting from our efforts to address the aforementioned needs. In Sec. II, we present an exhaustive survey and review of the body of work on aircraft energy state characterization. We describe a wealth of energybased metrics and propose an exhaustive classification scheme based on their definition, purpose, and underlying energy concept. We then outline intrinsic challenges in the application of these energy metrics to FDM analysis for GA operations in Sec. III. We outline the methodology and implementation of identified energy metrics for FDM analysis on a large set of flight data records in Sec. IV. This includes our approach to define a reference energy profile that forms the basis of evaluation for a subset of energy metrics. We also outline validated GA aircraft performance models developed in prior work [5,6]. New energy metrics developed in this work, either as all-new metrics or variants of existing metrics, are introduced and discussed. Section V contains two case studies that demonstrate the visualization of all energy metrics as a time series for large sets of flight data records and illustrates its use for the visual inspection of individual records where anomalous energy states may be readily identified. A summary of observations, findings, and an outline for future work is presented in Sec. VI.
II.Review of Energy Metrics and Their Applications
A.Classification and Organization of the Literature
The literature on energy management outlines two fundamental objectives at the highest level: improving safety and efficiency [7]. Within the literature targeting safety improvements, there are three major themes used to outline the scope of each effort: the intended aircraft category, the flight regime, and the specific purpose of application. We organize the literature surveyed according to these themes as follows:
Included in the classification based on aircraft category are 1) commercial aircraft [1,7–20],§ 2) fighter aircraft [21,22],
§Williams, D. H., “Flight Deck Merging and Spacing and AdvancedFMS Operations,” 8th EWG Operations Workshop, No. 1, 2008, https://smartech. gatech.edu/handle/1853/34339 [retrieved March 2017].
3) unmanned aerial vehicles [23–25], 4) general aviation [26], and 5) simulator-based studies [27].
Included in the classification based on flight regimes are 1) general, which includes work applicable to all flight regimes [1,7,8,10–12,16–18,21,23–25,28]; 2) descent, approach, and landing [9,13–15,19,20,26,27,29]; 3) turning and maneuvering [22,30]; and
4)cruise [15].
Included in the classification based on intended purpose are
1) energy management during descent or defining descent trajectories with specific objectives [13–15,19,20,27,29], 2) development of cockpit flight displays for enhancing energy awareness [9,10,21,26–28], 3) development of a control system based on energy management [8,10,12,16,31], 4) analysis of accidents or incidents involving poor energy state management [1,17,18], 5) trajectory optimization algorithms [23], and 6) pilot training for better energy management [7].
From the preceding groupings, some immediate trends are apparent. Most notably, it is observed that a majority of the work done on energy metrics has been performed with commercial aviation in mind. Additionally, although most work is not specific to a given flight regime (denoted by “general” in the preceding), phase-specific metrics are most often developed for descent, approach, and landing, which is consistent with the significant number of accidents and incidents that are known to occur in these phases. With regard to the overall purpose of each work, a broad spread of applications is observed, suggesting a variety of approaches to the problem of energy-based safety assessments. With respect to the aforementioned classifications, the current work is focused on the approach and landing phase, and the intended purpose is retrospective safety analysis (for which energy-based metrics have not previously been explicitly used).
B. Energy-Based Metrics used in Literature
Figure 1 illustrates our organization and categorization of energybased metrics in the literature. It also lists the various cockpit displays or visualizations used for energy management, as well as which metrics they use. As noted in Fig. 1, energy-based metrics in the

Downloaded by 94.180.100.60 on November 25, 2018 | http://arc.aiaa.org | DOI: 10.2514/1.C034196
PURANIK, JIMENEZ, AND MAVRIS |
2287 |
literature can be divided into two main categories: 1) metrics related to total energy, and 2) metrics related to the total energy rate.
There are a few other energy-based metrics in the literature that do not fall clearly in either of these two categories, and these will be introduced later under the “other metrics” category. Most work related to energy metrics or energy management uses simple energy metrics that can be obtained from the kinematics of the aircraft (altitude, velocity, and their rates). Some of the metrics might require the definition of a reference energy profile against which to compare the energy state (e.g., energy rate demand and energy rate efficiency).
The metrics listed in Fig. 1 under “total energy metrics” and “total energy rate metrics” are calculated at each point of time during the flight, and they can be displayed on a cockpit monitor. Therefore, they characterize an instantaneous energy state of the aircraft. Other metrics provide measures of energy states, or compliance to nominal states, aggregated over a time period. For instance, the mean of the absolute value of the energy/energy error [9] measures how well a pilot followed a certain energy profile over a particular phase of flight. For the application considered in this paper (which is retrospective flight data analysis), instantaneous metrics have been given more importance because we are looking for deviations from safe states. Aggregated metrics will be used in the future for automatic identification of anomalous flights. The remaining part of this section focuses on the formulas and definitions of energy metrics used in the literature.
1. Total Energy-Related Metrics
For defining total energy-related metrics, the total mechanical energy kinetic potential of the aircraft is either used directly or compared against a reference value to obtain the metric.
a. Specific Total Energy. The specific total energy (STE) is defined as the total mechanical energy per unit weight of the aircraft. This is one of the most widely used metrics in the literature [7,12,17,18,21]. The specific total energy is usually the metric representing the energy state of the aircraft as defined in many papers. It is also known as energy height. The specific total energy is given by the following:
E h |
V2 |
(1) |
2g |
The specific potential energy and specific kinetic energy are usually a part of any formulation that involves the specific total energy because these are the two components that make up the specific total energy. In addition, the specific potential energy (in the form of altitude) and the specific kinetic energy (in the form of airspeed) are part of any cockpit display for most aircraft. These two metrics give an indication of the aircraft’s mechanical energy distribution and can be important indicators for operational/safetyrelated events.
d. Specific Energy Error. The specific energy error is defined as the difference in the specific total energy in actual flight to that of a reference energy profile. It is given by the following:
δE |
|
E |
|
− E |
|
h |
|
− h |
|
V2 |
− V2 ∕2g |
(4) |
|
|
|
act |
ref |
|
act |
ref |
act |
ref |
|
|
|||
|
|
|
|
|
|
| {z } |
| {z } |
|
|||||
|
|
|
|
|
|
PE Error δEpot |
|
KE Error δEkin |
|
||||
This metric is very widely used for commercial aircraft, especially in descent and landing where a reference energy profile is available. Williams et al. [14] used the specific energy error to compare various descent trajectories. de Jong et al. [13] used the specific energy error as a metric in developing a planning and guidance concept for optimizing aircraft trajectories during descent. Amelink et al. [28] used the total energy deviation and kinetic energy deviation in the formulation of their total energy-based perspective flight-path display. Lambregts et al. [10] used the specific energy error in their energy management primary flight display concept. Other works that include the energy error as a metric in their formulation include the works of Williams et al. [15].
This metric is very useful for defining deviations from a reference trajectory when such a trajectory is available. Reference trajectories for both potential and kinetic energy must be available. The specific energy error can be further divided into the specific potential energy error δEpot and specific kinetic energy error δEkin.
e. Normalized Energy Error. The normalized energy error is the specific energy error normalized by a tolerance on the specific energy error. This metric has been used by Gandhi et al. [9] in the development of their “energy monitor” display concept. The normalized energy error is given by Eq. (5):
δEn |
E − Eref |
(5) |
Etol |
This metric has been used in a display concept called the energy/energy rate meter by Zagalsky [21]. The specific total energy has also been extensively used by Rutowski [32] in a graphical method to determine the optimum flight profile for an aircraft to reach a certain speed and altitude. Boyd et al. [30] used an energymaneuverability theory to generate “sky maps” for candidate aircraft. One of the important parameters used on these sky maps is energy height. This metric can be completely obtained from the state of the aircraft and does not require a reference energy profile. Specific total energy by itself is not a very useful metric because it can only give an indication of the total energy of the aircraft and not how it is distributed.
b. Specific Potential Energy. The specific potential energy (SPE) is defined as the potential energy (PE) per unit weight of the aircraft. It is given by the following:
PE |
mgh |
h |
(2) |
W |
c. Specific Kinetic Energy. The specific kinetic energy (SKE) is defined as the kinetic energy (KE) per unit weight of the aircraft. It is given by the following:
The tolerance in energy error Etol is updated dynamically as the aircraft tries to follow a reference approach profile. The authors have developed a crew alerting system that provides various cues when the normalized error exceeds a certain threshold.
2. Total Energy Rate-Related Metrics
Similar to the total energy metrics described earlier, these metrics use the rates of change of the total, potential, and kinetic energy. These rates may be directly used as a metric or they may be compared to reference/threshold values.
a. Specific Total Energy Rate. The specific total energy rate (STER), which is also rate of change of energy height, is defined as the rate of change of specific total energy. It is given by the following:
|
dE |
|
_ |
|
_ |
_ |
V × V |
|
|
E |
dt |
h |
g |
(6) |
It is also called specific excess power [7,30] and can be
alternatively represented as follows: |
|
|
|
|
|||
E_ |
|
T − D V |
|
P |
s |
(7) |
|
W |
|||||||
|
|
|
|||||
|
|
1∕2 mV2 |
|
V2 |
|
Equation (6) is the energy rate from the aircraft state point of view |
KE |
|
|
(3) |
(altitude and velocity), whereas Eq. (7) is from the aircraft systems |
||
|
W |
2g |
|
point of view (propulsion/thrust and aerodynamics/drag). Zagalsky |

Downloaded by 94.180.100.60 on November 25, 2018 | http://arc.aiaa.org | DOI: 10.2514/1.C034196
2288 |
PURANIK, JIMENEZ, AND MAVRIS |
|
[21] used the specific energy rate in his energy/energy rate meter |
The authors highlighted that the energy error rate when presented |
|
display concept. Lambregts [8] used the specific energy rate in his |
as a trend arrow on the cockpit displays aids pilots in flying the |
|
formulation of the total energy control system concept. |
|
reference profile while staying within the limits of energy errors, |
|
|
which are dynamically updated. |
b. Specific Potential Energy Rate. The specific potential energy rate |
|
|
(SPER) is given by the following: |
|
f. Energy Rate Efficiency. The energy rate efficiency is a measure of |
|
|
how closely an aircraft is following a commanded energy profile |
_ |
(8) |
(for example, during descent). It is given by the following: |
SPER h V × sin γ |
|
|
c. Specific Kinetic Energy Rate. The specific kinetic energy rate (SKER) is given by the following:
|
|
2 |
∕2g |
|
_ |
|
|
SKER |
|
d V |
|
V × V |
(9) |
||
dt |
g |
||||||
|
|
||||||
Both the specific potential energy rate and specific kinetic energy rate are typically used in conjunction with the specific total energy rate. The reservoir analogy [7,28] uses the specific potential and kinetic energy rates along with the specific total energy rate to show how the energy entering the system is being distributed. Lambregts et al. [10] used these metrics in their new ecological primary flight display concept.
d. Potential Flight-Path Angle/Total Energy Angle. The potential flight-path angle (hereafter referred to as PFPA) is a measure of the attainable flight-path angle at the current throttle setting. It is the flight-path angle that the aircraft can attain when there is no acceleration along the flight path. The PFPA is given by the following:
_
γp γ V (10) g
It is a measure of the dimensionless specific total energy rate and can be related to the total specific energy rate as follows:
_
γp E (11)
V
The upper limit associated with the PFPA is the maximum potential flight-path angle γp;max, which represents the flight-path angle that can be achieved at the theoretical maximum thrust while maintaining the current speed and current aircraft configuration. Similarly, the minimum PFPA γ is the flight-path angle that can be achieved with idle thrust setting while maintaining the current speed and aircraft configuration.
The PFPA has been widely used in the literature as an energy metric for cockpit displays. Adami et al. [26] used the PFPA in their “general aviation synthetic vision display” concept. Tadema and Theunissen [24] used the PFPA in their display concept of “traffic terrain and energy awareness display for unmanned aerial vehicles (UAVs).” Lambregts et al. [25] used the PFPA and PFPA-max (theoretical maximum flight path angle that the aircraft can attain at the maximum thrust while maintaining current speed and configuration) in their work on investigating the use of full lateral and vertical control authority for UAV conflict resolution. This work explored the possibility of the flight-path angle going beyond the maximum PFPA γp;max in certain maneuvers. Lambregts [8] and Kurdjukov et al. [12] used the PFPA in the formulation of the total energy control system. The PFPA has been used under the name “total energy angle” by van den Hoven et al. [27] and Amelink et al. [28] in the description of the total energy-based perspective flight-path display.
e. Energy Error Rate. The energy error rate is a metric that has been used by Williams et al. [14]. This metric provides a measure of whether the energy error with respect to a reference energy profile is increasing or decreasing. This metric is given by the following:
|
|
|
_ |
|
|
|
|
|
_ |
|
|
η |
E_ |
|
Ecmd |
|
VcW γc Vc∕g |
(13) |
|||||
_ |
|
||||||||||
|
V |
a |
T |
− |
D |
|
|
||||
|
|
|
Etot |
|
|
|
|
|
|||
The energy rate efficiency has been used by van den Hoven et al. [27] to analyze descent trajectories. When this metric is equal to unity, the aircraft is following the commanded trajectory exactly. A value higher than unity indicates a deficit of the total energy rate, and a value lower than one indicates excess total energy rate than what is required by the approach profile. This metric does not yield meaningful results when there is no ascent/descent or acceleration (such as steady level flight).
g. Energy Rate Demand. The energy rate demand is the maximum energy dissipation that the aircraft can attain at the current speed and configuration. This is used when the aircraft is descending. It is given by the following:
Descending flight:
|
|
_ |
|
|
E^ |
|
W γc Vc∕g |
(14a) |
|
Tidle − D |
||||
|
|
|||
Ascending flight: |
|
|
|
|
|
|
_ |
|
|
E^ |
|
W γc Vc∕g |
(14b) |
|
Tmax − D |
||||
|
|
When the energy rate demand goes above unity, it indicates that the aircraft, in its current configuration, cannot fly the commanded trajectory. The energy rate demand has been used in the literature by van den Hoven et al. [27] and Amelink et al. [28]. It has also been used as a constraint by Vormer et al. [19] to ascertain which profile can and cannot be flown by an aircraft during flexible descent trajectory optimization.
h. Total Energy Reference Profile. The total energy reference profile (TERP) is defined as the energy profile followed by the aircraft when the total energy error δE [defined earlier in Eq. (4)] from a commanded profile is zero. When the aircraft is flying along the TERP, the potential flight-path angle is equal to the potential flightpath angle of the reference trajectory (γp γp;c). van den Hoven et al. [27] and Amelink et al. [28] used the total energy reference profile in the development of their “total energy-based perspective flight-path display.”
3. Other Metrics/Applications of Energy Concepts
Apart from the metrics described previously, there are other metrics covered in the literature that are related to the energy state. They have been elaborated on here:
a. Fuel Energy Height. Pennycuick [11] defined a metric called fuel energy height. This metric is the total specific mechanical energy plus the chemical energy contained in the fuel, which is converted into an equivalent height assuming some efficiency of converting the chemical energy into potential energy. Thus, the fuel energy height gives an absolute upper bound on the total energy available to an aircraft at any point in time.
|
|
|
δE |
|
b. Specific Energy to Turn. Yajnik [22] defined a metric to evaluate |
|
δE |
|
(12) |
efficiency of turning flight. It is the energy required to overcome air |
|
|
t |
|
resistance per unit mass per turn. This metric is given by Eq. (15): |

Downloaded by 94.180.100.60 on November 25, 2018 | http://arc.aiaa.org | DOI: 10.2514/1.C034196
PURANIK, JIMENEZ, AND MAVRIS |
2289 |
g 2π |
|
e DV W ω |
(15) |
Turning with the minimum specific energy to turn is desired, and this metric would prove useful in these situations. This metric has been used by the author in the form of a specific energy to turn rate graph for various trade studies on important conceptual design parameters such as wing loading, zero-lift drag coefficient, and others.
c. Energy Maneuverability and Sky Maps. Rutowski [32] used contours of the total energy to calculate the minimum time to climb using a graphical method. Boyd et al. [30] extended this to the energymaneuverability theory to rank the relative performance of combat aircraft. Recently, Takahashi [33] used the concept of sky maps for visualizing various aircraft performance parameters and capabilities, including some of the energy metrics discussed earlier.
III.Challenges and Opportunities for General
Aviation Application
To enhance GA aircraft safety with the surveyed energy-based metrics, it is important to be aware of the challenges of implementing the energy-based metrics into GA aircraft safety enhancement efforts. Several challenges were identified and have been enumerated in the following:
1)To define some of the energy metrics (especially during approach and landing), a nominal or reference energy profile is desired. The energy metrics represent how well the aircraft is adhering to this reference profile and whether the aircraft can fly the trajectory. The reference energy profile is usually well defined for commercial aircraft operations (especially in descent phase: constant speed and 3 deg glideslope) but is not so clearly defined in the GA aircraft category. Therefore, it is important to identify ways of defining such reference energy profiles to aid in the use of energy metrics. This problem has been addressed by Puranik et al. in a parallel effort [34].
2)In addition to the metrics defined earlier, defining the limits of aircraft operation is also important. Various ways of defining the aircraft’s operational envelope and determination of the extent to which the current aircraft state is safe or allowable need to be identified. Energy metrics can potentially be used to measure this offset from the safe limits. It is important to distinguish what limit is more critical to the cause of accidents or incidents.
3)Recoverability is an important concept to measure or determine how safe the aircraft is in its envelope. For example, an aircraft may cross the stall limit and still be recoverable if the aircraft is in a high total energy state, but it should not cross the stall limit in a low-energy state. Thus, metrics that not only define aircraft-specific operating envelopes but also combine different envelopes need to be established in order to quantitatively determine the safety of an aircraft.
4)Even with the availability of a reference energy profile, the implementation of energy metrics should be meaningful and insightful. Safety assessments provided using energy metrics should correspond to actual unsafe states. Therefore, solicitation of subject matter expert opinion on flights identified as unsafe is required for validation of the approach.
5)A unified and automated approach to implementation of energy metrics is essential to identify unsafe/anomalous flight data records with respect to these energy metrics in a FDM setting. This can help in comparison of an energy-based approach to traditional exceedance detection methods currently used in FDM.
6)The flight data record available on the typical kind of GA aircraft considered in this exercise (Cessna 172) records much fewer parameters than those on commercial aircraft. Therefore, parameters such as the flap deflection, pilot’s control inputs, etc., may not be available; and energy metrics that require these parameters might not be easy to evaluate. Therefore, intelligent ways of estimating these parameters should be developed to enhance the usefulness of this approach.
7)Energy-based methods hold the potential to possibly reveal emergent safety issues that may not be apparent from traditional prescriptive approaches such as exceedance detection.
Although this work focuses on overcoming some portions of the challenges listed previously and does not address all of them in this paper, it is worthwhile to recognize the challenges in order to facilitate future areas of research in this domain.
IV. Methodology and Implementation
The methodology outlined in Fig. 2 is used to implement energy metrics identified earlier. The important components of the methodology include reference energy profiles, aircraft performance models, the metric evaluation for each flight record, and the visualization and safety analysis. Using this methodology, the values of energy metrics surveyed along with those defined later in this section are evaluated for each flight data record available.
Each individual flight data record is a part of a dataset of over 1000 records collected from GA training flights using a Cessna 172 aircraft equipped with a Garmin G1000 for flight data collection. The data are collected at a frequency of 1 Hz. The flight data recorder preserves the history of the flight by recording information about the aircraft speed, altitude, attitude, basic engine information such as revolutions per minute, etc. It is important to note that, unlike other uses of energy metrics, this work focuses on using energy metrics in a retrospective flight data analysis setting. Therefore, the values of the energy metrics are evaluated at each data point in the flight data record and stored for further analysis. Once the energy metrics have been evaluated for all flight data records, they are collectively analyzed for trends, observations, and insights. This methodology was implemented in MATLAB© with the flight data records imported from .csv files. The values of the energy metrics at each point were stored as additional fields in the data structure created for each flight record.
Since many GA accidents occur during approach and landing [18], this phase was chosen to test the approach. The following subsections elaborate on each of the important components of this methodology.
A. Reference Energy Profiles
As noted earlier, defining a reference energy profile is essential for implementing some energy metrics identified from the literature. To define reference energy profiles, a data-driven statistical approach is used in this work. For some phases of flight (such as takeoff, descent, and approach and landing), a reference energy profile can sometimes be defined. For other phases of flight in GA, such as cruise, it may not be so easy to define due to heterogeneity in operations. In this work,
Fig. 2 Outline of the methodology and steps involved in the process.

Downloaded by 94.180.100.60 on November 25, 2018 | http://arc.aiaa.org | DOI: 10.2514/1.C034196
2290 |
PURANIK, JIMENEZ, AND MAVRIS |
Fig. 3 Finding a nominal energy profile using flight records.
the focus is on approach and landing; therefore, reference energy profiles for these phases have been defined using the methodology developed by Puranik et al. in previous work [34]. For other phases of flight, only those metrics that do not require a reference energy profile will be evaluated.
In previous work [34], various aspects of defining a nominal approach and landing trajectory for GA applications were explored. This nominal profile is defined using a statistical averaging of the energy profiles (obtained from the altitude and velocity data of the flight record) over a large dataset of flights. For the approach and landing phase, in order to ensure that this averaging is done such that different records can be compared against each other, the flight record is sampled based on the distance remaining to touchdown rather than time. This allows discretizing the approach and landing phase into extremely small segments and averaging the values of the specific total energy (obtained by adding specific kinetic and specific potential energy) at each point. For the takeoff phase, the average profiles are obtained using the application of takeoff power as the anchor point in time. A similar approach has been followed for anchoring flights and sampling values of flight parameters in commercial aviation operations [35]. The results of this analysis for the approach and landing phase are shown in Fig. 3, which contains the reference (average) specific kinetic and specific potential energy profiles shown as the dashed lines. Similar profiles can be obtained for specific total energy.
The idea behind using average profiles obtained from real flight data records is that these energy profiles have been demonstrated to be safe and allowable. Therefore, it serves as a good baseline or nominal profile to compare against. For some phases of flight in commercial operations such as descent and approach, there are certain prescriptive energy profiles (e.g., altitude profile with a 3 deg glideslope and constant-velocity profile). However, these are not necessarily completely adhered to in the GA approach phase: especially the constant velocity (or kinetic energy) approach profile [34]. Therefore, in this implementation, the average energy profile from safe operations is used rather than any prescriptive profile. Further insights and details on the implementation can be found in the work of Puranik et al. [34].
B. Aircraft Performance Models
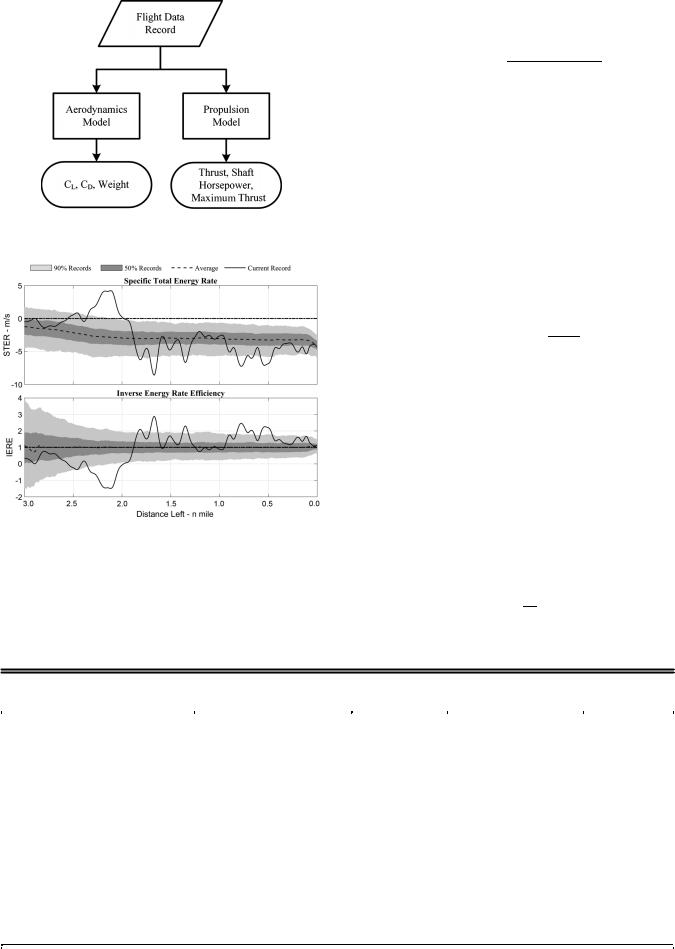
To evaluate some of the energy metrics listed earlier in Sec. II, we need additional data beyond what are captured by the typical onboard flight data recorder on GA aircraft. The thrust, drag, and weight of the aircraft at any given point of time are required for some energy metrics. Previous work by Min et al. [5] and Harrison et al. [6] included the development and validation of performance models for GA aircraft using publicly available data. A brief description of the models is given here, and readers are encouraged to refer Min et al. [5] for the aerodynamics model and Harrison et al. [6] for the propulsion model. It should be noted that, in this methodology, other equivalent
performance models could have been used that are able to provide validated predictions for the quantities of interest.
For both models, the input is the flight data record of interest containing information such as velocity, altitude, engine revolutions per minute, exhaust gas temperature, etc. These quantities are available at each sampled point and are passed onto the individual models.
For the aerodynamic model, lift-curve modeling consists of three stages; and each stage has five parameters to define the curve. The drag polar can be defined with two parameters for the simplified parabolic drag model. Thorough analysis on various modeling methods outputs an optimum set of parameters that minimizes modeling errors as compared to any publicly available reference data. Based on the work in this published aerodynamic model, the aerodynamic model used in this paper is refined using hundreds of flight data records by minimizing the errors between the modeling results and the actual datadriven values. The outputs are the dimensional and nondimensional lift and drag, and an estimate of the weight of the aircraft.
Alongside the aerodynamic forces of flight, an estimation of the propulsive characteristics creates a more complete picture of GA performance. The implemented propulsion model generates an estimate of thrust produced by a fixed-pitch propeller driven by an internal combustion piston engine. First, an Otto-cycle-based simulation of the engine is performed to generate the output power of the engine. Then, this power is used by an empirical-based propeller performance model to estimate propeller thrust and the theoretical maximum thrust at that flight condition. Figure 4 shows the flow of information in performance models.
C. Energy Metrics Evaluation
Using the nominal energy profiles defined and the aircraft performance models, it is possible to evaluate all the relevant metrics reviewed from the literature. The availability of performance models allows the definition of some additional metrics that may not be directly defined using the raw data obtained from the flight data recorder. Similarly, some metrics identified in the literature tend to be numerically ill-behaved. These need to be redefined in such a way that they are useful. The following subsection elaborates some of these modified metrics in addition to some newly defined metrics used in this approach.
1. Additional or Modified Energy Metrics
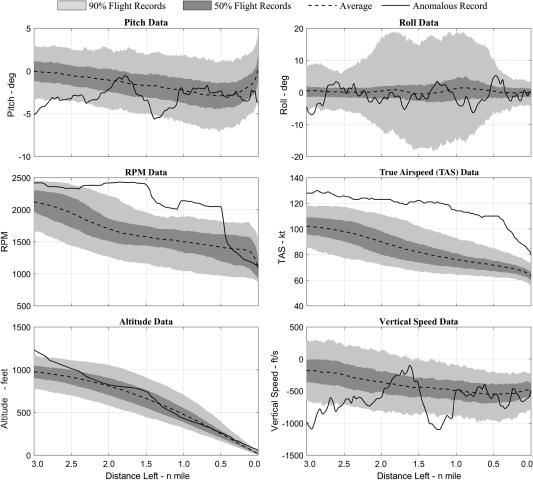
a. Inverse of Energy Rate Efficiency. Earlier, the energy rate efficiency was defined by Eq. (13) as the ratio between the specific energy rate of the reference energy profile to the actual profile. However, during approach and landing (or takeoff) operations in GA, at many points in time, the actual total energy rate can be zero. This causes the energy rate efficiency to have sharp peaks, and even be undefined at some places (division by zero).
Downloaded by 94.180.100.60 on November 25, 2018 | http://arc.aiaa.org | DOI: 10.2514/1.C034196
PURANIK, JIMENEZ, AND MAVRIS |
2291 |
Fig. 4 Inputs and out puts of aircraft performance models.
Fig. 5 Inverse energy rate efficiency (IERE) during approach.
On the other hand, as observed in Fig. 5, the specific total energy rate of the nominal reference energy profile is never zero during approach and landing (it is always negative) or takeoff (always positive). Therefore, defining the energy rate efficiency as the inverse
of what was defined in Eq. (13) is more meaningful and intuitive. This inverse energy rate efficiency is defined as follows:
|
|
|
_ |
|
Va T − D |
|
η |
E;_ inv |
|
Etot |
|
(16) |
|
_ |
_ |
|||||
|
|
|
Ecmd |
|
VcW γc Vc∕g |
|
A value of this metric higher than unity would indicate a specific energy rate higher than the reference (and possibly point to unsafe states). On the other hand, a negative value would indicate that the aircraft is gaining energy where the reference profile is losing (because it is applied to approach and landing phase): again, possibly indicating a red flag in terms of safety. A value between zero and one is preferred.
b. Modified Energy Error Rate. The energy error rate is defined by Eq. (12). This rate represents whether the total energy error with respect to the nominal profile is increasing or decreasing. However, just the error rate does not represent the entire picture. A positive energy error rate would be preferred if the energy error itself is negative, and vice versa. Therefore, a modified energy error rate is proposed to be used that also takes into consideration the sign of the energy error. This is given by the following:
|
m |
|
|
|
|
t |
|
δE_ |
|
sign |
δE |
|
× |
δE |
(17) |
|
|
|
A negative value of the modified energy error rate is always preferred because this will mean that the error is being driven toward zero. Although it is understood that the modified energy error rate will not always be zero, it is nevertheless desirable to have this metric within reasonable bounds. Another characteristic related to this metric is that it should not be positive for extended periods of time, which would indicate that the current energy profile is deviating away from the reference energy profile. Figure 6 shows the modified energy error rate for a sample flight data record.
c. Glideslope. The specific potential energy rate describes the change in potential energy with respect to time. It is also useful to find the rate of change of potential energy with respect to the ground track distance covered (instantaneous glideslope). The glideslope (GS) metric is defined as the ratio of the altitude change per unit distance covered along the ground track. It is given by the following:
dh |
|
GS dx |
(18) |
Table 1 Summary of implemented energy metrics, formulas, and data required for computation
|
|
|
|
|
Can be estimated using flight |
|
|
|
|
|
Can be estimated |
data plus performance |
Requires reference |
Metric |
|
Formula |
|
using flight data |
models |
profile |
Specific total energy |
|
h V2∕2g |
|
Yes |
Yes |
No |
Specific potential energy |
|
h |
|
Yes |
Yes |
No |
Specific kinetic energy |
|
V2∕2g |
|
Yes |
Yes |
No |
Specific total energy error |
|
hact − href Vact2 − Vref2 ∕2g |
Yes |
Yes |
Yes |
|
Specific potential energy error |
|
hact − href |
|
Yes |
Yes |
Yes |
Specific kinetic energy error |
|
Vact2 − Vref2 ∕2g |
|
Yes |
Yes |
Yes |
Normalized energy error |
_ |
E − Eref ∕Etol |
|
Yes |
Yes |
Yes |
Specific total energy rate |
h |
V V ∕g T − D V∕W |
Yes |
Yes |
No |
|
Specific potential energy rate |
|
_ |
|
Yes |
Yes |
No |
|
h V sin γ |
|
||||
Specific kinetic energy rate |
|
_ |
|
Yes |
Yes |
No |
|
V V ∕g |
|
||||
Potential flight-path angle |
|
_ |
|
Yes |
Yes |
No |
|
γ V∕g |
|
||||
Glideslope |
|
dh∕dx |
|
Yes |
Yes |
No |
Modified specific energy error rate |
|
sign δE × δE ∕ |
t |
Yes |
Yes |
No |
Inverse energy rate efficiency |
|
_ |
Yes |
Yes |
Yes |
|
Va T − D ∕VcW γc Vc∕g |
||||||
Maximum potential flight-path angle |
|
Tmax − D ∕W |
|
No |
Yes |
No |
Minimum potential flight-path angle |
|
Tidle − D ∕W |
|
No |
Yes |
No |
Energy rate demand (approach and landing) |
|
_ |
|
No |
Yes |
Yes |
|
W γc Vc∕g ∕ Tidle − D |
|||||
Thrust margin |
|
1 − T∕Tmax |
− D |
No |
Yes |
No |
Energy rate margin |
|
_ |
No |
Yes |
No |
|
|
W γa Va∕g ∕ Tmax |
|||||
|
|
|
|
|
|
|

Downloaded by 94.180.100.60 on November 25, 2018 | http://arc.aiaa.org | DOI: 10.2514/1.C034196
2292 |
PURANIK, JIMENEZ, AND MAVRIS |
Fig. 6 Modified total energy error rate (MTEER) during approach.
d. Thrust Margin. The thrust margin (TM) metric is defined as the one minus the ratio of the thrust at the current state to the theoretical maximum thrust possible at that flight condition. It is given by the following:
T |
|
TM 1 − Tmax |
(19) |
The thrust margin is an indicator of the amount of energy that can enter the system. Operating at a higher margin would mean that the
aircraft can escape possible low-energy scenarios by the aggressive addition of energy. On the other hand, a lower value of this margin would indicate that the capability to add energy is lower. However, it should be noted that a high thrust margin is not necessarily always a good thing because this might also be an indicator of an engine-out situation.
e. Energy Rate Margin. The energy rate margin is defined as the ratio of the actual specific energy rate to the specific energy rate using the theoretical maximum thrust value for the same configuration (same drag). It is given by the following:
E |
|
_ |
|
|
W γa Va∕g |
(20) |
|
|
Tmax − D |
|
During approach and landing, the actual specific energy rate is expected to be negative, whereas the maximum specific energy rate will be positive. Therefore, a small negative value (greater than −1) would indicate that the specific energy rate is negative but can be made positive at the current configuration by increasing the thrust. A value less than −1 would indicate that the specific energy rate is negative and the aircraft does not have sufficient margin to make this rate positive. Avalue greater than zero would indicate that the aircraft has a positive specific energy rate instead of negative. The theoretical upper limit on this metric is 1.
Similarly, during takeoff, both the actual and maximum specific energy rates are expected to be positive. Therefore, a small positive value of this metric would mean that the aircraft has the ability to increase the energy rate substantially. A larger value (less than one) would indicate a diminished ability to increase the specific energy rate. A negative value would mean that the aircraft is losing energy instead of gaining it during the takeoff phase.
Fig. 7 Visualization of energy metrics for a high-energy approach.
Downloaded by 94.180.100.60 on November 25, 2018 | http://arc.aiaa.org | DOI: 10.2514/1.C034196
PURANIK, JIMENEZ, AND MAVRIS |
2293 |
2. Summary and Interpretation of Implemented Energy Metrics
Table 1 outlines all the energy metrics implemented in this work along with their formulas and the data required for computation. It should be noted that, in most cases, the metrics are specific metrics, meaning that they have been normalized by the weight. This ensures that they can be used as objective currency to compare across a broad range of flights. For each flight record, at each point in time, the metrics listed in Table 1 are evaluated and stored. For those phases of flight that do not have a reference energy profile, only the relevant metrics are defined. The first two columns of this table contain the name and formula of each metric. The third and fourth columns indicate what data are sufficient to evaluate the metric (raw flight data or both flight data and performance models). The last column indicates whether a reference profile is required to calculate the value of the metric. This tabulation assists in choosing energy metrics depending on available resources.
The subset of metrics that can be obtained from raw flight data is the most basic kinematic metrics and their rates (which are obtained by numerical differentiation); these are indicated by a “Yes” in the third column. The performance models mentioned in earlier sections are essential in evaluating metrics that provide information about limits of the aircraft with respect to energy or energy rates. These are the rows that contain “No” in the third column and Yes in the fourth column. In addition, if a reference profile is available, then the metrics indicating deviation from this profile can also be evaluated from the raw flight data: rows that contain Yes in the fifth column.
In addition to the metrics defined in Table 1, aggregate metrics over the entire approach and landing or takeoff phase are also evaluated. For example, for each flight record, the average value of the specific total energy during approach and landing can be calculated. These values can be used as a measure of the overall energetic state of the aircraft during approach and landing rather than at a specific point.
These metrics are not used in the current work, but some uses of these metrics have been addressed in other work by Puranik et al. [34].
V.Case Studies
Once all the energy metrics have been evaluated for each flight record, they can be visualized and used for making safety assessments. For flight data monitoring applications, a large set of flight data records is essential. In this work, the flight records from over 1000 training flights mentioned earlier are used. An important advantage in FDM is the ability to take into account the information contained in the entire dataset rather than just the specific data record under consideration.
In this research, for the phase of flight considered the approach and landing, the values of all energy metrics are evaluated at specific intervals anchored at a specific event in time. This event is typically touchdown, and the energy metrics are sampled at a fixed distancebased interval to touchdown. This is because many procedures in the approach and landing phase depend on the distance or height rather than time remaining [35]. This allows the comparison of values of metrics across different flights at each sampled point.
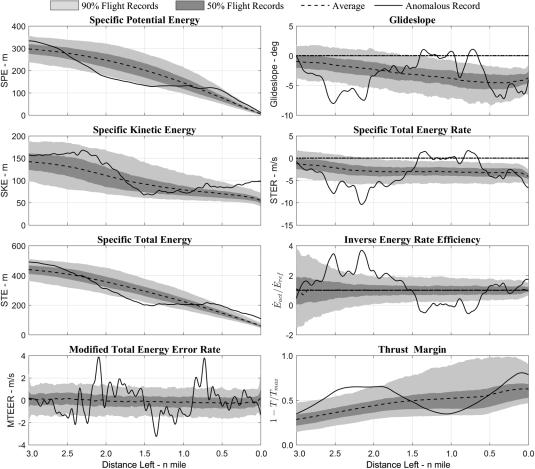
Once the metrics have been sampled, the data series of metrics from multiple flights can be overlaid on top of each other. As seen in Fig. 7, for each metric during approach and landing, the average is shown with the dashed line; metric values within the 50th percentile of flight records are shown with the dark gray band; and metric values within the 90th percentile of flight records are shown with the light gray band. Metric values for the particular record under consideration are shown using the solid black line. Those flight data records that are anomalous or abnormal from the perspective of energy metrics can be further investigated. These abnormal records can be identified using various data-mining algorithms (such as clustering, classification,
Fig. 8 Visualization of raw flight parameters for a high-energy approach.
Downloaded by 94.180.100.60 on November 25, 2018 | http://arc.aiaa.org | DOI: 10.2514/1.C034196
2294 |
PURANIK, JIMENEZ, AND MAVRIS |
etc.) on the energy metrics. We are interested in whether flight records that are identified to be abnormal from an energy metrics perspective also exhibit abnormal behavior of flight parameters. If this is indeed the case, then the quantified correlation between abnormal energy metrics behavior and safety-related events will need to be examined.
Although automatically obtaining flight data records exhibiting anomalous energy metric values is a subject of future work, in the current work, two case studies identified using data mining are presented. The first one is a high-energy approach, and the second one is a low-energy approach case. In each case, a selected subset of interesting energy metrics is presented to highlight abnormal behavior. In a visualization similar to the energy metrics, a subset of the raw flight parameters for the same flight record is also presented to compare how the parameters behave during these approaches and whether they exhibit abnormal patterns.
A. High-Energy Approach
In this subsection, a flight record with high energy during approach and landing is inspected using energy metrics and flight data. Figure 7 shows a visualization of the energy metrics for this flight record. As seen in the figure, the current flight comes in with a specific kinetic energy much higher than the average. As a result, the specific total energy throughout this approach and landing is higher than nominal, and even beyond the 90th percentile. Inspecting the other metrics in Fig. 7, it is apparent that, even though the specific energy is high, the modified energy error rate is not negative for large parts of the approach. This indicates that the energy profile is not tending to revert back toward the average. This is also evident at the end of the record where the total and kinetic energies are higher than nominal at the runway threshold. The specific total energy rate is quite high (magnitude) throughout the approach. Therefore, even though the aircraft is coming in at a higher than normal energy, it is also bleeding energy faster.
The glideslope is near the average toward the end, but it has a few significantly lower than normal values during the initial stages of the approach. These locations could potentially be closer to unsafe operations. The inverse energy rate efficiency is positive in most places, indicating that the energy rate profile does not have opposite tendency during approach (gaining energy instead of bleeding). However, the magnitudes of this metric are quite high at several places where the energy rate is dangerously high. The thrust margin is initially quite low, indicating more energy input into the system, but becomes higher toward the end. This is what would be expected because the thrust would be cut back toward the end when the aircraft was desperately trying to bleed more energy.
A similar visualization of the raw flight parameters for the same flight record can be seen in Fig. 8. It can be seen that the pitch angle for the initial part of the descent is far outside the 90th percentile bounds. In the initial stages, the revolutions per minute and vertical speed are outside the 90th percentile bounds. The revolutions per minute stay high for a large part of the approach and landing. This might be a reason for the very high total energy. The vertical speed toward the middle of the approach (between 1.5 and 1 n miles) dips very low [below −1000 fpm (feet per minute)].
It is important to note that the behavior of energy metrics was used in this case to single out this flight record. It is a good corroboration that flight records with abnormal behavior in energy metrics are those that have unusual patterns with respect to raw parameters like roll, pitch, vertical speed, etc., which are typically used to specific safety events [4,36].
B. Low-Energy Approach
In this subsection, a flight record with a very low specific total energy during segments of the approach is inspected. As seen from Fig. 9, the specific potential and total energies of the flight record for a large part of the approach are lower than average.
Fig. 9 Visualization of energy metrics for a low-energy approach.