

1_c034064
.pdfDownloaded by 94.180.100.60 on November 25, 2018 | http://arc.aiaa.org | DOI: 10.2514/1.C034064
JOURNAL OF AIRCRAFT
Vol. 54, No. 5, September–October 2017
Limit-Cycle Oscillation of the Subsonic Ultra-Green Aircraft Research Truss-Braced Wing Aeroelastic Model
Robert E. Bartels, Christie J. Funk,† and Robert C. Scott‡
NASA Langley Research Center, Hampton, Virginia 23681
DOI: 10.2514/1.C034064
Recent research has focused on the design of aircraft that provide significant reductions in emissions, noise, and fuel usage. One of the strategies to increase fuel efficiency is to leverage the potential structural weight saving available by using novel configurations such as the truss-braced wing. The Boeing Company recently tested the Subsonic UltraGreen Aircraft Research Truss-Braced Wing wind-tunnel model in the NASA Langley Research Center Transonic Dynamics Tunnel. This test resulted in a wealth of accelerometer data that are indicative of the dynamic behavior of the model near flutter onset. For the truss-braced wing model test, the flutter onset was preceded by a large Mach number/dynamic pressure area in which the model displayed wing/engine nacelle aeroelastic limit-cycle oscillation. This paper analyzes those limit-cycle oscillation data to provide additional insights into the aeroelastic behavior of the model. Spectral analyses indicate the coalescence of several wing modes into a single-frequency limit-cycle oscillation. The mapping of limit-cycle oscillation at that frequency at progressive amplitudes indicates a substantial variation in onset with angle of attack. Spectral analysis also provides evidence of nonlinearity in both the aerodynamic and structural dynamics.
I.Introduction
ONE of the goals of recent research has been the design of a commercial air transport that provides significant reductions in emissions, noise, and fuel usage. Increases in fuel efficiency can be achieved by, among other means, reducing structural weight. Those reductions, however, can also intensify detrimental interactions between the aerodynamics, structures, and control system, contributing to problems such as excessive gust loading, an unacceptable flutter
margin, and destabilizing aeroservoelastic coupling.
This necessitates multidisciplinary design methods that fully take this interaction into account. Although modern multidisciplinary optimization methods have helped in mitigating these problems, increases in computing power along with new materials and manufacturing techniques has enabled a consideration of nontraditional designs. This has also enabled the consideration of passive or active aeroelastic measures to achieve, for instance, optimal aerodynamics for drag reduction, active flutter suppression, or gust load alleviation.
Such methods are being applied to the development of a trussbraced wing (TBW) aircraft, which was originally funded by NASA under a phase I research grant to the Boeing Company. The Subsonic Ultra-Green Aircraft Research (SUGAR) TBW aircraft was identified as the best option to advance the fuel efficiency metric, among other means, by its large aspect ratio, which reduces induced drag.
Further advantage is taken of the superior load bearing potential of the strut or truss wing. The multiple load paths of a strut and jury reduce the bending moment at the root of the inner wing and allow an inboard wing box to be thinner and thus lighter. Transonic wave drag and parasite drag are lower because a thinner wing alleviates the need for wing sweep, resulting in laminar flow over a greater portion of the wing. Countering this benefit is a more complex load path and aerodynamics that can lead to unique aeroelastic behavior.
Received 21 June 2016; revision received 12 November 2016; accepted for publication 25 November 2016; published online Open Access 22 February 2017. This material is declared a work of the U.S. Government and is not subject to copyrightprotection in the United States. All requests for copying and permission to reprint should be submitted to CCC at www.copyright.com; employ the ISSN 0021-8669 (print) or 1533-3868 (online) to initiate your request. See also AIAA Rights and Permissions www.aiaa.org/randp.
*Senior Aerospace Engineer, Aeroelasticity Branch, MS 340. Senior Member AIAA.
†Aerospace Engineer, Aeroelasticity Branch, MS 340. Member AIAA.
‡Senior Aerospace Engineer, Aeroelasticity Branch, MS 340. Associate Fellow AIAA.
Furthermore, the smaller body of engineering experience in designing a strut and jury reinforced wing adds to design uncertainty. Uncertainty about the flutter behavior of a truss-braced wing structure in a transonic flowfield motivated the development of an aeroelastic wind-tunnel test by the Boeing Company. An aeroelastic wind-tunnel model was tested in the NASA Langley Transonic Dynamics Tunnel (TDT) in the December 2013–April 2014 time frame [1].
That test resulted in a large database that has been documented, along with test procedures, in several previous papers. A few select experimental data points were published several months after the completion of the test [2], whereas a more-detailed discussion of the test and development of the wind-tunnel model was presented by Allen et al. [3]. Additional details regarding the flutter testing, development and implementation of flutter suppression control laws, and their use in the aeroservoelastic testing of the SUGAR model were reported by Scott et al. [4]. The Mach number/dynamic pressure region at which occurred explosive flutter or large-amplitude limitcycle oscillatory (LCO) motion, sometimes termed hard flutter, was documented in those papers. What has not been documented are the varying levels of moderate to high dynamics through which the vehicle passed as it approached hard flutter. A mapping of the levels of dynamics and the regions in which various modes participated provides insight into the nature of transonic fluid–structure interaction for such a vehicle. Additional spectral analyses may also reveal important frequency content as well as possible nonlinearity in the dynamic response [5–7].
The transonic testing of an aeroelastic model always entails the risk of high flowfield induced dynamics, flutter, and LCO, even for a clean wing geometry [8–10]. Flowfield nonlinearity due to shocks and shock separation alone can produce LCO-type flutter even when structural nonlinearity is absent [11]. In this Mach number range, flutter is much more sensitive to spanwise and chordwise bending than in a subcritical flowfield due to sensitivity of shock location to local angle of attack (AOA) and camber. For this reason, LCO response is sensitive to small changes in structural parameters [9,12], such as alteration between compression or tension of a truss, or the positioning of the truss/wing junction. The resulting truss tension or compression produces a geometrically nonlinear stiffening that can affect the onset of aeroelastic instability [13] and influence intensity and composition of the dynamics [14]. This is particularly true near an explosive flutter event, where there are often isolated bursts of large-amplitude oscillation. For instance, dynamics of this sort were reported in the transonic aeroelastic test of a transport wing [8] with and without a wing-tip pencil store. Transonic flowfield effects about a complex configuration are evident in the large body of work done in
1605
Downloaded by 94.180.100.60 on November 25, 2018 | http://arc.aiaa.org | DOI: 10.2514/1.C034064
1606 |
BARTELS, FUNK, AND SCOTT |
characterizing the transonic LCO of an F-16 with wing stores [12]. Transonic shock-induced trailing-edge separation was implicated as one possible cause of LCO in that vehicle [15,16].
The data used to characterize the LCO are structural accelerations at several locations on the model. Contour mappings of the levels of dynamics as functions of Mach number, dynamic pressure, and AOA will be provided. The techniques of signal processing, in particular the short-time fast Fourier transform, wavelet transform, and autospectra, will be used to infer the physical processes at work in producing the LCO.
II. Transonic Dynamics Tunnel and Subsonic Ultra-Green Aircraft Research Wind-Tunnel Model
The Langley TDT is dedicated to identifying, understanding, and solving relevant aeroelastic and aeroservoelastic problems. It is specially configured for flutter testing with a clear visibility from the control room as well as a control room activated bypass valve system that rapidly decreases the test section dynamic pressure in the event of excessive model dynamics. In the TBWaeroelastic test, the heavy gas 1,1,1,2-tetrafluoroethane (R-134a) was used as the test medium. It was tested in the Mach number range 0.6–0.8.
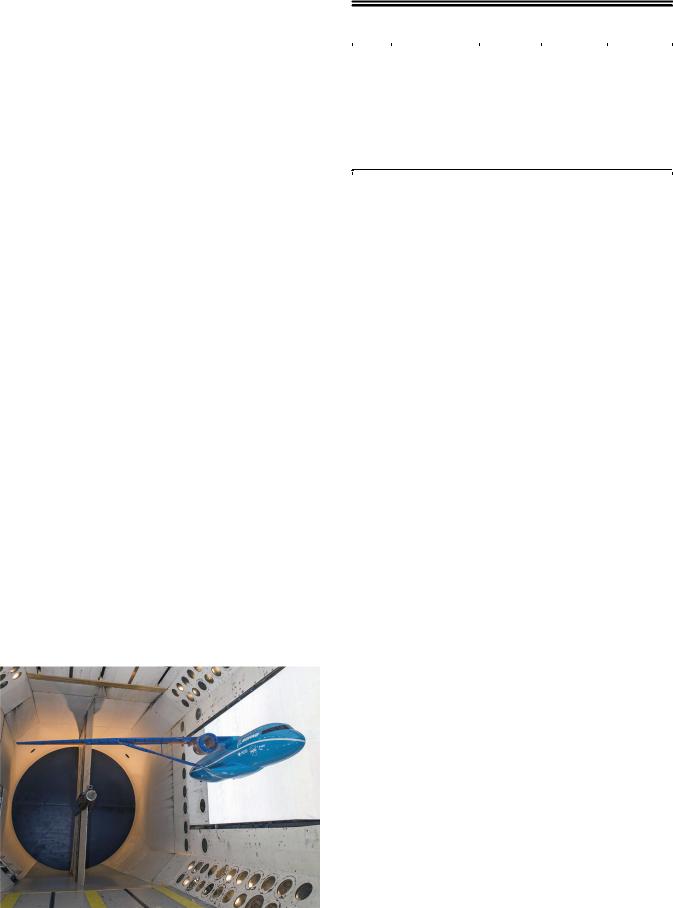
A photo of the SUGAR model in the TDT is shown in Fig. 1. The development of the Boeing SUGAR TBW 15% semispan side- wall-mounted wind-tunnel model is described elsewhere [1]. The model includes main and jury struts, pylon and annular nacelle, wing, and fuselage. The scaled fuselage length is 13.4 ft, whereas the mean aerodynamic chord is 16.5 in. The model span from an imaginary vehicle centerline to wing tip is 12.75 ft, with an additional 2.25 in. from vehicle centerline to wall to account for wind-tunnel boundarylayer displacement thickness.
The wing, strut, and jury use a spar-pod design with a flanged aluminum spar for supporting bending and torsion loads. Stiffnesses (bending (EI) and torsion (GJ) distributions) and masses are scaled from the full-scale article for testing in heavy gas. The nacelle and pylon are quite rigid but have the correct mass and inertia. Lead weights are attached to the wing spar in several locations to give the wing the proper scaled mass. The wing aerodynamic shape is provided by graphite epoxy fairings, or pods, mounted to the spars. The fuselage consists of an aluminum internal structure with fiberglass skin panels. Instrumentation for data acquisition included 11 strain gauges and 21 accelerometers. The model was supported by a turntable as shown in Fig. 1, allowing the model AOA to be varied between 3 deg.
Because the model behavior varies with AOA, it is useful to consider the change in modal frequencies with wing loading. The Boeing Company created a finite element model (FEM) based on ground vibration test data that was used in post-test analyses of flutter and LCO onset. Models were created for an aerodynamically loaded model at AOAs of −1 and 1 deg, at which normal modes were
Fig. 1 Photo of the SUGAR model in the Transonic Dynamics Tunnel.
Table 1 Variation of modal frequencies with AOA, unloaded, and 100 psf at Mach 0.75
|
|
Frequency |
Frequency, |
Frequency |
Mode |
|
(unloaded), |
(AOA: |
(AOA: |
number |
Description |
Hz |
1 deg), Hz |
1 deg), Hz |
1 |
First out-of-plane |
5.04 |
5.07 |
5.17 |
|
wing bending |
|
|
|
2 |
First in-plane wing |
5.70 |
5.60 |
5.58 |
|
bending |
|
|
|
3 |
Second out-of- |
8.44 |
8.50 |
8.60 |
|
plane wing bending |
|
|
|
4 |
First wing/nacelle |
11.3 |
11.2 |
11.3 |
|
torsion |
|
|
|
5 |
Third out-of-plane |
18.5 |
18.0 |
18.4 |
|
wing bending |
|
|
|
|
|
|
|
|
|
|
|
|
|
obtained. The FEM frequencies for an unloaded and an aerodynamically loaded model at −1 and 1 deg AOA along with modal descriptions are given in Table 1. At both −1 and 1 deg AOA, the compressive/tensile loading of the strut reduces the frequencies of modes 2 and 5, whereas the frequencies of mode 1 (which is predominantly wing bending) and mode 3 (mixed bending/ torsion) increase at both angles. Mode 4, which is predominantly nacelle torsion, exhibits a slight reduction in frequency at −1 deg AOA. The shapes of the first five modes are shown in Fig. 2. These are the modes that play a dominant role in the onset of flutter and LCO.
III.Overview of Flutter and Limit-Cycle
Oscillation Data
For flutter testing, the goal is to identify the Mach number and dynamic pressure of flutter/LCO onset. At the TDT, Mach number and dynamic pressure are not independent of each other but vary in unison with changes in the rotation frequency of the TDT main fan drive motor. Mach number and dynamic pressure vary along lines parallel to the total pressure (or total head h) as the main drive rotation frequency increases. All SUGAR TBW experimental data under analysis in this paper were acquired in this way using heavy gas with a tunnel total pressure varying between approximately 250 and 450 psf.
Typical flutter testing in the TDT relies on naturally occurring tunnel turbulence to perturb the model. Mach number and dynamic pressure are gradually increased along an h line until a flutter point is observed. Time history data are generally acquired for an h line up to and including the flutter point. The determination of flutter is made visually from digital strip chart observations, modal frequency coalescence, or direct observation of the model. Once a flutter point is observed, Mach number and dynamic pressure are reduced to stabilize the model by rapidly reducing main drive rotation frequency or by opening the tunnel bypass valves if warranted by the severity of the instability. Repeating this process over multiple h lines allows a definition of the flutter/LCO onset boundary. There is a typical h used in passing from one h line to the next. For this reason, at any given Mach number, the test points will likely be somewhat discontinuous as a function of dynamic pressure.
Several hundred usable wind-tunnel test runs were acquired in the course of several months of testing (December 2013–April 2014). By varying the model AOA between −3, −1, 1, and 3 deg, it was discovered that the flutter/LCO onset boundaries are sensitive to AOA [1], a dependence also noted in Coggin et al. [17]. At all AOAs, the mechanism that produced the LCO and hard flutter was a coalescence of the second out-of-plane bending and first torsion modes at a frequency near 10 Hz. Referring back to Fig. 2, it is crucial to note that these two modes are neither pure bending nor pure torsion. On the other hand, the first two modes and the fifth mode, which apparently do not participate in the LCO, are the pure bending modes. Additional isolated phenomena were identified in the test; for instance, it was noted that, at 1 deg, the model also exhibited an exceptional torsional response at Mach numbers near 0.76.

Downloaded by 94.180.100.60 on November 25, 2018 | http://arc.aiaa.org | DOI: 10.2514/1.C034064
BARTELS, FUNK, AND SCOTT |
1607 |
Fig. 2 Leading mode shapes at Mach 0.75, 100 psf.
IV. Analysis of the Limit-Cycle Oscillation Data
A. Database Development
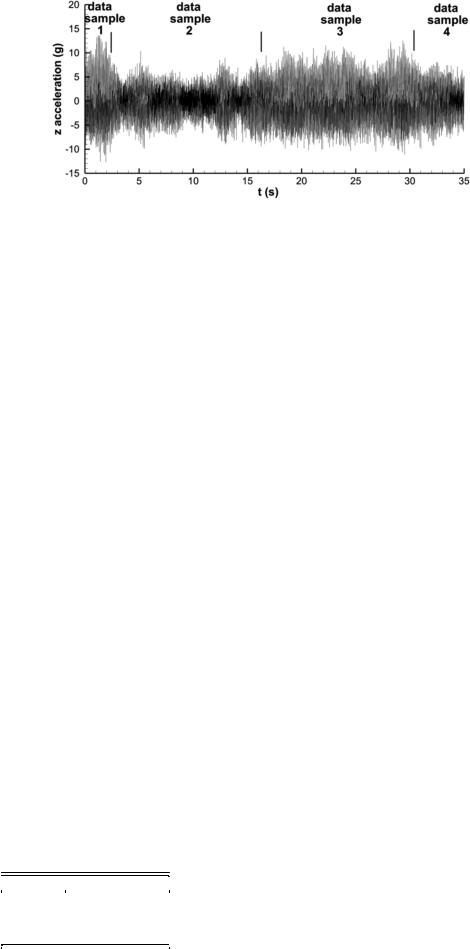
Participation of the second out-of-plane bending mode can be measured by the transverse (vertical) acceleration at the forward wing-tip station, whereas the first torsion mode is best tracked by observing the vertical acceleration of the engine nacelle. Figure 3 shows the locations of the two accelerometers. Typical of most test points, there is a variability in the LCO amplitude, such as that shown
Fig. 3 Locations of accelerometers used in the current study.
in the forward wing-tip acceleration time history in Fig. 4. Such variability in amplitude with small changes in ambient flow condition is consistent with observations made elsewhere [8–10]. Figure 4 also shows the division of that time history into samples. The hundreds of test points have been separated into thousands of short time samples distinguished by Mach number, AOA, dynamic pressure, and level of dynamics. Table 2 indicates the complete number of samples at each AOA.
B. Limit-Cycle Oscillation Frequency
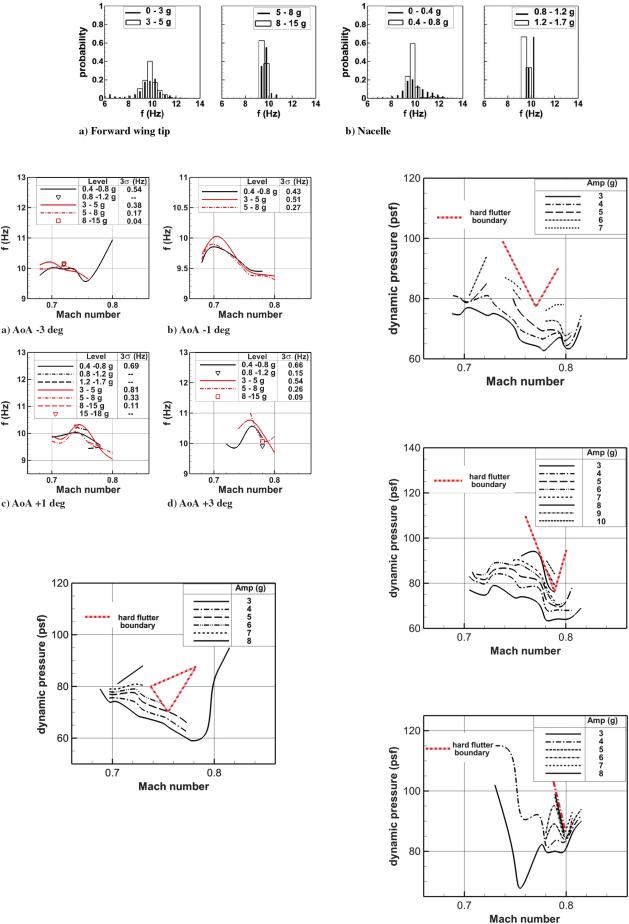
The instrumentation data rate is 500 per second. To each sample, a fast Fourier transform (FFT) is applied with a flat-top window function to reduce scalloping loss [18,19]. The amplitude of the dominant LCO mode is taken to be the largest peak in absolute value of the FFT in the 6–14 Hz frequency range. The end result is a catalog of the LCO amplitudes and frequencies from the forward wing-tip and nacelle accelerometers. Figure 5 shows representative histograms of all sample frequencies within different dynamics ranges for AOA of 1 deg for the wing tip and nacelle. The FFT peaks were distributed over most of the frequency range for the 3g level for wing tip and 0–0.4g level for the nacelle. The broad spectra at these levels are most likely caused by broad-spectrum tunnel turbulence but also by the fact that the two participating modes have not yet coalesced. At higher dynamics levels, a single dominant frequency emerges at all AOAs for both wing tip and nacelle. The fact that the same frequency emerges at higher dynamics levels for both wing tip and nacelle indicates that the LCO is indeed a coalescence of the second out-of-plane bending and first torsion modes rather than two separate oscillating modes [20]. This coalescence is observed at all the AOAs.
The frequency of the LCO averaged over all samples for wing tip and nacelle at different g levels shown in Fig. 6 also indicates this
Downloaded by 94.180.100.60 on November 25, 2018 | http://arc.aiaa.org | DOI: 10.2514/1.C034064
1608 |
BARTELS, FUNK, AND SCOTT |
Fig. 4 Wing-tip accelerometer time history variability.
coalescence, but with a caveat. There generally is a tight clustering of the averaged frequency at all Mach numbers, again confirming the coalescence of the two modes, but with the exception of the lower Mach number range in Figs. 6a and 6b. Given the natural frequencies of the two participating modes, it is unexpected that the wing-tip averaged frequency would be higher than that of the nacelle in these two cases; however, this difference is well within the 3σ deviation of the data.
C. Limit-Cycle Oscillation Amplitude
A compilation of Mach number, dynamic pressure, and dynamic response of the accelerometer time histories enables a contour map of LCO amplitudes for both wing tip and nacelle. The results of mapping LCO amplitudes are the contour plots shown in Figs. 7–10 for the wing tip and Figs. 11–15 for the nacelle. To create plots of contours of LCO amplitudes, enveloping curves were created for each Mach number that encloses the largest LCO amplitude. As discussed previously, wing-tip LCO amplitudes below 3g were removed. Thus, wing-tip LCO onset is defined as the 3g contour and nacelle LCO onset as 0.4g. Finally, for a given Mach number, there are some instances where the LCO amplitude drops off at higher dynamic pressures. This dropoff may be ascribed to the existence of a flutter hump mode; however, because of a sparsity of data, the existence of a hump mode cannot be confirmed. For that reason, the possibility of such a mode can only be observed by LCO amplitude lines that are discontinuous, or broken, across the Mach range.
The boundaries between stable but high-amplitude LCO and explosive flutter are also shown, namely the red V-shape, closed triangle, or slanted line, depending on AOA [3]. In the 3 deg AOA contour plots in Figs. 10 and 14, there is only the lower side of the V- shape boundary because the upper Mach number part of the boundary was not sufficiently explored to characterize it. From all these contour maps, it is clear that high, but manageable, model dynamics occurred at all Mach numbers well before the hard flutter onset.
What has often been termed a “flutter dip” or “flutter bucket” can be seen in the hard flutter onset at all angles of attack in the vicinity of Mach 0.76–0.81. This dip, which is produced by flowfield nonlinearity, transonic compressibility effects, and possibly strong viscous–inviscid interaction, is defined by the lowest dynamic pressure at which flutter occurs and its corresponding transonic Mach number. The wide Mach number range at which it occurs (Mach 0.76 for −3 deg and Mach 0.81 for 3 deg) indicates the strong sensitivity of onset to AOA [3]. It is also clear from these figures that
Table 2 Number of data samples
|
at each AOA |
|
|
|
|
AOA, deg |
Number of samples |
−3 |
1882 |
−1 |
1179 |
1 |
1223 |
3 |
1408 |
|
|
the LCO onset has a bucket or dip as well, which is not always closely tied to the flutter bucket. At AOAs of −3 deg (Fig. 7) and −1 deg (Fig. 8), the Mach number of the wing-tip LCO bucket is much higher than that for hard flutter. However, as the AOA increases, the Mach number of the flutter bucket also increases, and by 3 deg (Fig. 10), the Mach number of the flutter bucket has risen sufficiently that it matches well with the LCO bucket.
The back side of the LCO bucket occurs around Mach 0.79–0.81, where there is a rapid rise in the dynamic pressure of onset. At −3 and −1 deg AOA, the increase in LCO amplitude is gradual for all Mach numbers. At AOAs of 1 and 3 deg (Figs. 9 and 10), there is a rather short dynamic pressure range over which LCO amplitude rapidly escalates to hard flutter. At an AOA of 3 deg in Fig. 10, there appears to be very little model dynamics at any dynamic pressure until Mach 0.77, where model dynamics rises rapidly from 4g. Furthermore, the onset of hard flutter is at a significantly higher dynamic pressure than at lower AOAs.
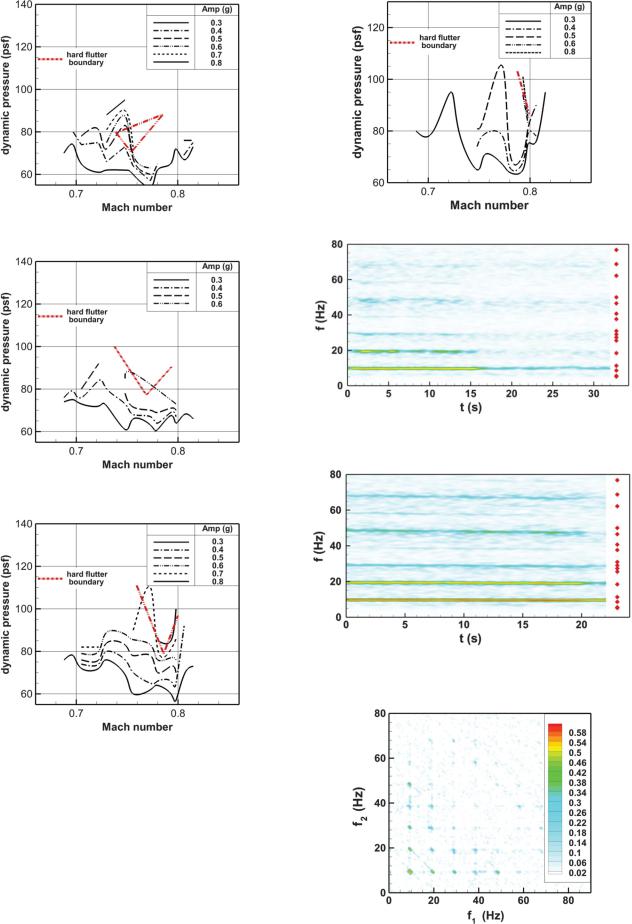
The nacelle LCO contours are shown in Figs. 11–15. The hard flutter onset lines are also plotted in these figures. Because the bypass valves were opened in response to high wing-tip accelerations, the correlation between nacelle LCO contours and hard-flutter onset may be somewhat poor, especially at the lower AOAs. In general, the overall rise in dynamic pressure of the wing-tip LCO onset with increasing AOA is also seen in nacelle LCO onset. However, the nacelle LCO bucket is not as clearly defined. In fact, only at −1 and3 deg are what might be called well-defined nacelle LCO buckets. At an AOA of −3 deg, the nacelle LCO onset contour is rather difficult to characterize.
The nacelle LCO amplitude map at 1 deg is very interesting (Fig. 13). The rise to high-amplitude nacelle LCO amplitude (wing torsion) follows the hard flutter onset somewhat better than other AOAs. Although not shown on this plot, there were individual runs at which peak LCO amplitudes reach 1.6g. Furthermore, there are high nacelle acceleration levels at Mach 0.75–0.76 in the 90–110 psf range. This corresponds very well with the observations made by test engineers that there was a region of high torsional dynamics preceding the hard flutter onset [1].
D. Nonlinear Modal Interaction
Because of its unique configuration in which alternating tension and compressive loads contribute to the sensitivity of flutter/LCO onset to AOA at all Mach numbers, as well as previous analyses indicating the importance of geometric nonlinearity in the aeroelastic behavior of the TBW, it is of interest to assess the nonlinearity of the model dynamics. Previous work by Hajj et al. [5–7] has identified nonlinearity in aeroelastic wind-tunnel as well as flight-test data. In the case of the flexible high-speed civil transport (HSCT), the focus was on the high dynamic response over a very narrow Mach number range from 0.98 to 1.0 [5], for which it can be expected that flowfield nonlinearity dominates. With the TBW model, high levels of dynamics occur in a much broader Mach range. This suggests a search for nonlinearity over wider span of Mach numbers.
BARTELS, FUNK, AND SCOTT |
1609 |
Fig. 5 Histograms of LCO frequency probability with g level for AOA 1 deg.
Downloaded by 94.180.100.60 on November 25, 2018 | http://arc.aiaa.org | DOI: 10.2514/1.C034064
Fig. 6 Average LCO frequency versus Mach number: nacelle (black) and forward wing tip (red).
Fig. 7 Amplitudes of 10 Hz forward wing-tip z acceleration,
AOA −3 deg.
Prior work has also tried to assess the relative contributions of the aerodynamic and structural nonlinearities as well as Mach- number-dependent aerodynamic nonlinearities for the HSCT model [21,22]. In the present case, two runs are considered that have approximately the same dynamic pressure and AOA ( 1 deg), namely runs 2164 and 3212. The first is at Mach 0.72 and the latter is at Mach 0.78. The aerodynamics at the lower Mach number is
Fig. 8 Amplitudes of 10 Hz forward wing-tip z acceleration,
AOA −1 deg.
Fig. 9 Amplitudes of 10 Hz forward wing-tip z acceleration,
AOA 1 deg.
Fig. 10 Amplitudes of 10 Hz forward wing-tip z acceleration,
AOA 3 deg.
1610 |
BARTELS, FUNK, AND SCOTT |
Downloaded by 94.180.100.60 on November 25, 2018 | http://arc.aiaa.org | DOI: 10.2514/1.C034064
Fig. 11 Amplitudes of 10 Hz nacelle z acceleration, AOA −3 deg. |
Fig. 14 Amplitudes of 10 Hz nacelle z acceleration, AOA 3 deg. |
Fig. 12 Amplitudes of 10 Hz nacelle z acceleration, AOA −1 deg.
Fig. 13 Amplitudes of 10 Hz nacelle z acceleration, AOA 1 deg.
typically considered linear, whereas at the higher Mach number, it is considered to be mildly nonlinear.
Figures 15 and 16 present a wavelet analysis over the entire length of the two runs. A Morlet wavelet is used with 2 s window length, a 95% overlap. Also shown are the frequencies of the first 16 natural frequencies of the structure. The dominant LCO frequency around 9–10 Hz is evident in both, although at Mach 0.72, the peak is intermittent. There are also strong higher harmonics around 19, 29, 48, and 58 Hz in both cases, the first several of those corresponding roughly with structural frequencies. In the Mach 0.72 case, the higher-order harmonics are clearly tied to the rise and fall of the dominant LCO peak. It should be noted that the frequencies of the higher harmonics in the wing-tip acceleration at Mach 0.78 decrease
Fig. 15 Frequency spectra for run 2164, Mach 0.72, dynamic pressure 84.5 psf, AOA 1 deg. Red diamonds are natural frequencies of structure.
Fig. 16 Frequency spectra for run 3212, Mach 0.78, dynamic pressure 85.5 psf, AOA 1 deg. Red diamonds are natural frequencies of structure.
Fig. 17 Autobispectrum of wing-tip acceleration for run 2164, Mach 0.72, dynamic pressure 84.5 psf, α 1 deg. Maximum level is 0.68.

Downloaded by 94.180.100.60 on November 25, 2018 | http://arc.aiaa.org | DOI: 10.2514/1.C034064
BARTELS, FUNK, AND SCOTT |
|
|
|
|
|
|
1611 |
b2 |
f |
; f |
|
|
jBxx f1; f2j2 |
|
(1) |
|
EfjX f1 f2j2gEfjX f1 X f2j2g |
||||||
xx |
1 |
|
2 |
|
|||
where |
|
|
|
|
|
|
|
Bxx f1; f2 EfX f1 X f2 X f1 |
f2g |
(2) |
|||||
is the bispectrum. Efg represents ensemble average, X is the fast Fourier transform, and superscript is the complex conjugate. The normalized autotrispectrum is
Fig. 18 Autobispectrum of wing-tip acceleration for run 3212, Mach 0.78, dynamic pressure 85.5 psf, AOA 1 deg. Maximum level is 0.68.
over the duration of the run, with the highest harmonic decreasing from 68 to 66 Hz. Because this coincides with an increase in Mach number of about 0.5%, this frequency decrease is clearly aerodynamically induced. The primary LCO frequency also decreases by 1%. Note that, at Mach 0.72, there is no discernible change in frequencies. Further inquiry into the nature of the nonlinearity is next.
Analysis of the spectral content of a signal, in particular spectra derived from the correlation moments, can be a useful indicator of nonlinear interactions between various modes. The autobispectrum and autotrispectrum can be used to infer the quadratic and cubic nonlinearity of the dynamics. There are several forms of biand trispectrum used, but that frequently cited (e.g., [23,24]) is
t2 |
f |
; f |
; f |
3 |
jTxxxx f1; f2; f3j2 |
xxx |
1 |
2 |
|
EfjX f1 f2 f3j2gEfjX f1 X f2 X f3j2g |
(3)
where
Txxxx f1; f2; f3 EfX f1 X f2 X f3 X f1 f2 f3g (4)
The value of the autobispectrum will be zero if there is no phase relationship between the three frequency components at f1, f2, and f1 f2 [5]. On the other hand, the value of the autobispectrum will be 1 if there is a strong phase relationship between the frequency components, indicating a strong quadratic coupling. Values between zero and 1 indicate a partial quadratic coupling. Likewise, the value of the autotrispectrum will be 1 if there is a strong cubic coupling between the frequencies f1, f2, f3, and f1 f2 f3 and zero if there is none.
The autospectra are composed from the short time FFTs using 2 s windows, 95% overlap with a Gaussian window function. Figures 17 and 18 give the values of the autobispectrum for the two conditions. Peak values of 0.58 indicate a moderately strong quadratic coupling
Fig. 19 Autotrispectrum of wing-tip acceleration for run 2164, Mach 0.72, dynamic pressure 84.5 psf, AOA 1 deg.

1612 |
BARTELS, FUNK, AND SCOTT |
Downloaded by 94.180.100.60 on November 25, 2018 | http://arc.aiaa.org | DOI: 10.2514/1.C034064
Fig. 20 Autotrispectrum of wing-tip acceleration for run 3212, Mach 0.78, dynamic pressure 85.5 psf, AOA 1 deg.
between the clustering of structural modes at 10, 20, and 50 Hz. The fact that the lower Mach number data display quadratic nonlinearity strongly suggests that quadratic structural nonlinearity is involved in the dynamics. Because there are similar peaks in the autotrispectra in Fig. 19 for Mach 0.72 and Fig. 20 for Mach 0.78, moderate cubic nonlinearity is also evident in both the aerodynamics and structure. Because the Mach 0.72 case shows strong peaks at frequencies up to 50 Hz in the autobispectrum and autotrispectrum, some quadratic and cubic structural nonlinearity can be inferred. Strong peaks in the autobispectrum and autotrispectrum for the Mach 0.78 case at frequencies beyond 50 Hz indicate quadratic and cubic nonlinearity also arising from the aerodynamics.
V.Conclusions
The paper presents a detailed analysis of accelerometer data from The Boeing Company Subsonic Ultra-Green Aircraft Research trussbraced wing model test in the NASA Langley Research Center Transonic Dynamics Tunnel. The Subsonic Ultra-Green Aircraft Research truss-braced wing wind-tunnel flutter model experienced both classical flutter as well as limit-cycle oscillation phenomena. The wing-tip and engine nacelle accelerometer time histories provide a window into these various types of model dynamics. The accelerometer data from hundreds of test points were separated into small samples distinguished by ambient conditions and dynamic response of the model. A mapping of the various levels of dynamics, short of hard flutter, suggests that, for the truss-braced wing aeroelastic model, flutter and limit-cycle oscillation onset dynamic pressure and Mach number increase as the angle of attack is increased. This fact indicates that strut tension/compression strongly influences aeroelastic behavior. A limit-cycle oscillation bucket is revealed that, at angles of attack of −3 and −1 deg, does not correspond exactly with the previously published hard flutter bucket. At positive angles of attack, the rise in limit-cycle oscillation
amplitude is closely correlated with hard flutter onset and is more rapid as hard flutter onset is approached. Spectral analyses have also been performed that indicate multiple higher harmonics, suggesting that not only aerodynamic nonlinearity at transonic Mach numbers but also structural dynamic nonlinearity at all Mach numbers is present. This result may inform future efforts at accurately simulating the TBW aeroelastic behavior.
References
[1]Bradley, M. K., Droney, C. K., and Allen, T. J., “Subsonic Ultra Green Aircraft Research: Truss Braced Wing Aeroelastic Test Report,” NASA NNL08AA16B, Boeing Company, CR, June 2014.
[2]Bartels, R. E., Scott, R. C., Funk, C. J., Allen, T. J., and Sexton, B. W., “Computed and Experimental Flutter/LCO Onset for the Boeing TrussBraced Wing Wind-Tunnel Model,” 44th AIAA Fluid Dynamics Conference, AIAA Paper 2014-2446, June 2014.
[3]Allen, T. J., Sexton, B., and Scott, M. J., “SUGAR Truss Braced Wing Full Scale Aeroelastic Analysis and Dynamically Scaled Wind Tunnel Model Development,” 56th AIAA/ASCE/AHS/ASC Structures, Structural Dynamics, and Materials Conference, AIAA Paper 2015-1171, 2015.
[4]Scott, R. C., Bartels, R. E., Funk, C. J., Allen, T. J., Sexton, B. W., Dykman, J. R., and Coulson, D. A., “Aeroservoelastic Test of the Subsonic Ultra-Green Aircraft Research Truss-Braced Wing Model,”
Journal of Guidance, Control, and Dynamics, Vol. 39, No. 8, Aug. 2016, pp. 1820–1833.
doi:10.2514/1.G000265
[5]Hajj, M. R., and Silva, W. A., “Nonlinear Flutter Aspect of the Flexible High-Speed Civil Transport Semispan Model,” Journal of Aircraft, Vol. 41, No. 5, Sept.–Oct. 2004, pp. 1202–1208.
doi:10.2514/1.2225
[6]Hajj, M. R., and Beran, P. S., “Identification of Nonlinearities Responsible for Limit Cycle Oscillations of Fighter Aircraft,” 48th AIAA/ASME/ASCE/AHS/ASC Structures, Structural Dynamics, and Materials Conference, AIAA Paper 2007-1797, April 2007.
Downloaded by 94.180.100.60 on November 25, 2018 | http://arc.aiaa.org | DOI: 10.2514/1.C034064
BARTELS, FUNK, AND SCOTT |
1613 |
[7]Hajj, M. R., Duke, J. C., and Yoo, B., “Material Fatigue Prognosis with Higher-Order Spectral Analysis of Nonlinear Ultrasonic Characteristics,”
46th AIAA/ASME/ASCE/AHS/ASC Structures, Structural Dynamics and Materials Conference, AIAA Paper 2005-2319, April 2005.
[8]Edwards, J. W., Spain, C. V., Keller, D. F., Moses, R. W., and Schuster, D. M., “Transport Wing Flutter Model Transonic Limit Cycle Oscillation Test,” Journal of Aircraft, Vol. 46, No. 4, July–Aug. 2009, pp. 1104–1113.
doi:10.2514/1.30079
[9]Bendiksen, O. O., “High-Altitude Limit Cycle Flutter of TransonicWings,” Journal of Aircraft, Vol. 46, No. 1, Jan.–Feb. 2009, pp. 123–136.
doi:10.2514/1.36413
[10]Dietz, G., Schewe, G., and Mai, H., “Amplification and Amplitude Limitation of Heave/Pitch Limit-Cycle Oscillation Close to the Transonic Dip,” Journal of Fluids and Structures, Vol. 22, No. 4, 2006, pp. 505–527.
doi:10.1016/j.jfluidstructs.2006.01.004
[11]Bendiksen, O. O., “Influence of Shocks on Transonic Flutter of Flexible Wings,” 50th AIAA/ASME/ASCE/AHS/ASC Structures, Structural Dynamics, and Materials Conference, AIAA Paper 2009-2313, May 2009.
[12]Denegri, C. M., “Limit Cycle Oscillation Flight Test Results of a Fighter with External Stores,” Journal of Aircraft, Vol. 37, No. 5, Sept.– Oct. 2000, pp. 761–769.
doi:10.2514/2.2696
[13]Nguyen, N., Ting, E., and Lebofsky, S., “Aeroelasticity of Axially Loaded Aerodynamic Structures for Truss-Braced Wing Aircraft,” 56th AIAA/ASCE/AHS/ASC Structures, Structural Dynamics, and Materials Conference, AIAA Paper 2015-1840, Jan. 2015.
[14]Schewe, G., Mai, H., and Dietz, G., “Nonlinear Effects in Transonic Flutter with Emphasis on Manifestations of Limit Cycle Oscillations,”
Journal of Fluid and Structures, Vol. 18, No. 1, 2003, pp. 3–22. doi:10.1016/S0889-9746(03)00085-9
[15]Cunningham, A. M., and Meijer, J. J., “Semi-Empirical Unsteady Aerodynamic for Modeling Aircraft Limit Cycle Oscillation and Other Non-Linear Aeroelastic Problems,” Proceedings of the International Forum on Aeroelasticity and Structural Dynamics, Vol. 2, Royal Aeronautical Soc., London, 1995, pp. 74.1–74.14.
[16]Meijer, J. J., and Cunningham, A. M., “Semi-Empirical Unsteady Nonlinear Aerodynamic Model to Predict Transonic LCO Characteristics of Fighter Aircraft,” 36th AIAA/ASME/ASCE/AHS/ASC Structures, Structural Dynamics, and Materials Conference, AIAA Paper 1995-1340, April 1995.
[17]Coggin, J. M., Kapania, R. K., Zhao, W., Schetz, J. A., HodigereSiddaramaiah, V., Allen, T. J., and Sexton, B. W., “Nonlinear Aeroelastic Analysis of a Truss Braced Wing Wind Tunnel Model,” 55th AIAA/ASME/ASCE/AHS/SC Structures, Structural Dynamics, and Materials Conference, AIAA Paper 2014-0335, Jan. 2014.
[18]Lyons, L., “Reducing FFT Scalloping Loss Errors Without Multiplication,” IEEE Signal Processing Magazine, Vol. 28, No. 2, March 2011, pp. 112–116.
[19]“Signal Processing Toolbox: Flattopwin,” Mathworks, 2015, http://www.mathworks.com/help/signal/ref/flattopwin.html [retrieved Feb. 2015].
[20]Bendiksen, O. O., “Nonlinear Mode Interactions and Period-Tripling Flutter in Transonic Flow,” Journal of Fluids and Structures, Vol. 19, No. 5, 2004, pp. 591–606.
doi:10.1016/j.jfluidstructs.2004.01.005
[21]Chabalko, C. C., and Hajj, M. R., “Time/Frequency Analysis of the Flutter of the Flexible HSCT Semispan Model,” 45th AIAA/ASME/ ASCE/AHS/ASC Structures, Structural Dynamics and Materials Conference, AIAA Paper 2004-1856, April 2004.
[22]Chabalko, C. C., Hajj, M. R., and Silva, W. A., “Nonlinear Response Characteristics of the Flexible HSCT Semispan Model over Different Flight Regimes,” 49th AIAA/ASME/ASCE/AHS/ASC Structures, Structural Dynamics and Materials Conference, AIAA Paper 20082019, April 2008.
[23]Kim, Y. C., and Powers, E. J., “Digital Bispectral Analysis and Its Applications to Nonlinear Wave Interactions,” IEE Transactions on Plasma Science, Vol. 7, No. 2, June 1979, pp. 120–131. doi:10.1109/TPS.1979.4317207
[24]He, H., and Thomson, D. J., “The Canonical Bicoherence—Part 1: Definition, Multitaper Estimation, and Statistics,” IEEE Transactions on Signal Processing, Vol. 57, No. 4, April 2009, pp. 1273–1284. doi:10.1109/TSP.2009.2012598