

Laboratory work #9 study of external photoelectric effect
Purpose: To study the emission of electrons from a metal surface irradiated with light.
The Photoelectric Effect
A phenomenon that gives insight into the nature of light is the photoelectric effect, in which a material emits electrons from its surface when illuminated. (Fig. 9.1). The emitted electrons are called photoelectrons. To escape from the surface, an electron must absorb enough energy from the incident light to overcome the attraction of positive ions in the material. These attractions constitute a potential-energy barrier; the light supplies the “kick” that enables the electron to escape.
The photoelectric effect has a number of applications. Digital cameras and night-vision scopes use it to convert light energy into an electric signal that is reconstructed into an image. On the moon, sunlight striking the surface causes surface dust to eject electrons, leaving the dust particles with a positive charge. The mutual electric repulsion of these charged dust particles causes them to rise above the moon’s surface, a phenomenon that was observed from lunar orbit by the Apollo astronauts.
|
|
|
|
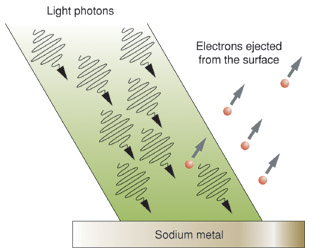
9.1 The photoelectric effect
1.1 Threshold Frequency and Stopping Potential
We explored the wave model of light, which Maxwell formulated two decades before the photoelectric effect was observed. Is the photoelectric effect consistent with this model? Figure 9.2 shows a modern version of one of the experiments that explored this question. Two conducting electrodes are enclosed in an evacuated glass tube and connected by a battery, and the cathode is illuminated. Depending on the potential difference VAC between the two electrodes, electrons emitted by the illuminated cathode (called photoelectrons) may travel across to the anode, producing a photocurrent in the external circuit. (The tube is evacuated to a pressure of 0.01 Pa or less to minimize collisions between the electrons and gas molecules.)
Figure 9.2 An experiment testing whether the photoelectric effect is consistent with the wave model of light. |
|
 Figure
9.3
Figure
9.3
The
illuminated cathode emits photoelectrons with various kinetic
energies. If the electric field points toward the cathode, as in
Fig. 9.3a, all the electrons are accelerated toward the anode and
contribute to the photocurrent. But by reversing the field and
adjusting its strength as in Fig. 9.3b, we can prevent the less
energetic electrons from reaching the anode. In fact, we can
determine the maximum kinetic energy Kmax
of the emitted electrons by making the potential of the anode
relative to the cathode, VAC
just negative enough so that the current stops. This occurs for VAC
= –V0
where V0
is called the stopping
potential.
As an electron moves from the cathode to the anode, the potential
decreases by V0
and negative work –eV0
is done on the (negatively charged) electron. The most energetic
electron leaves the cathode with kinetic energy Kmax
=
 m
m and
has zero kinetic energy at the anode. Using the work – energy
theorem, we have (maximum kinetic energy of photoelectrons)
and
has zero kinetic energy at the anode. Using the work – energy
theorem, we have (maximum kinetic energy of photoelectrons)
Wtot = –eV0 = ΔK = 0 – Kmax
Kmax = m = eV0 (9.1)
Hence by measuring the stopping potential we can determine the maximum kinetic energy with which electrons leave the cathode. (We are ignoring any effects due to differences in the materials of the cathode and anode.) In this experiment, how do we expect the photocurrent to depend on the voltage across the electrodes and on the frequency and intensity of the light? Based on Maxwell’s picture of light as an electromagnetic wave, here is what we would expect:
Wave-Model Prediction 1: The intensity of an electromagnetic wave depends on its amplitude but not on its frequency. So the photoelectric effect should occur for light of any frequency, and the magnitude of the photocurrent should not depend on the frequency of the light.
Wave-Model Prediction 2: It takes a certain minimum amount of energy, called the work function, to eject a single electron from a particular surface (see Fig. 9.1). If the light falling on the surface is very faint, some time may elapse before the total energy absorbed by the surface equals the work function. Hence, for faint illumination, we expect a time delay between when we switch on the light and when photoelectrons appear.
Wave-Model Prediction 3: Because the energy delivered to the cathode surface depends on the intensity of illumination, we expect the stopping potential to increase with increasing light intensity. Since intensity does not depend on frequency, we further expect that the stopping potential should not depend on the frequency of the light.
The experimental results proved to be very different from these predictions. Here is what was found in the years between 1877 and 1905:
Experimental Result 1: The photocurrent depends on the light frequency. For a given material, monochromatic light with a frequency below a minimum threshold frequency produces no photocurrent, regardless of intensity. For most metals the threshold frequency is in the ultraviolet (corresponding to wavelengths between 200 and 300 nm), but for other materials like potassium oxide and cesium oxide it is in the visible spectrum ( between 380 and 750 nm).
Experimental Result 2: There is no measurable time delay between when the light is turned on and when the cathode emits photoelectrons (assuming the frequency of the light exceeds the threshold frequency). This is true no matter how faint the light is.
Figure 9.4 Photocurrent I for a constant light frequency ƒ as a function of the potential VAC of the anode with respect to the cathode. |
Figure 9.5 Stopping potential as a function of frequency for a particular cathode material. |
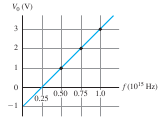
Experimental Result 3: The stopping potential does not depend on intensity, but does depend on frequency. Figure 9.4 shows graphs of photocurrent as a function of potential difference VAC for light of a given frequency and three different intensities. The reverse potential difference –V0 needed to reduce the current to zero is the same for all intensities. The only effect of increasing the intensity is to increase the number of electrons per second and hence the photocurrent I. (The curves level off when VAC is large and positive because at that point all the emitted electrons are being collected by the anode.) If the intensity is held constant but the frequency is increased, the stopping potential also increases. In other words, the greater the light frequency, the higher the energy of the ejected photoelectrons.
These results directly contradict Maxwell’s description of light as an electromagnetic wave. A solution to this dilemma was provided by Albert Einstein in 1905. His proposal involved nothing less than a new picture of the nature of light.