

Unit five. Structuring maps
Vocabulary notes :
to structure - составлять (карту)
feature - пространственный объект
scaled-down - уменьшенный в масштабе
regular attribute - обычный характерный признак
land parcel - земельный участок
plotter - графопостроитель
unwieldy - громоздкий, неуклюжий
ASCII - Американский стандартный код для обмена
информацией
Ex. 1 Read and translate the text.
Maps have at least two dimensions; in the earth’s space they have latitude and longitude and in the map’s space they have the left-right (x) and the up-down (y) directions. They are also scaled-down representations of features, features that can be points, lines, areas, or even volumes. Point features are very simple to deal with, and you could easily argue that you don’t really even need a GIS for point features other than to draw them. This is because x and y can be stored just as regular attributes in a standard database. Line and area features are more complicated because they can be different shapes and sizes. A stream and a road would be captured with different numbers of points, and these would not fit easily into the attribute database.
Vector data structures were the first to be used for computer cartography and GIS because they were simply derived from digitizing tablets, because they are more exact in representing complex features such as land parcels, and because they are easily drawn on pen-type output devices such as plotters. Surprisingly, few people in the early days thought of standardizing how digitizing was to take place, and since there were different technologies, many different formats evolved. The earliest included ASCII files of (x, y) coordinates, but these soon became very unwieldy in size, so binary files rapidly took over.
The first generation of vector files were simply lines, with arbitrary starting and ending points, which duplicated the way a cartographer would draw a map. Obviously the pen would be lifted from the paper to start a new line, but it could be lifted anywhere else. The file could consist of a few long lines, many short lines, or even a mix of the two. Typically, the files were written in binary or ASCII and used a flag or code coordinate to signify the end of a line.
Ex. 2 Answer the questions using the information from the text.
1. How many dimensions does a map have ?
2. What structures were the fist to be used in computer cartography ?
3. What did the first generation of vector files consist of ?
Ex. 3 Read and translate key terms and their definitions .
vector: A map data structure using the point or node and the connecting segment as the basic building block for representing geographic features.
grid cell: A single cell in a rectangular grid.
line: A one-dimensional (length) map feature represented by a string of connected coordinates.
point: A zero-dimensional map feature, such as a single elevation mark as specified by at least two coordinates.
volume: A three-dimensional (volume) feature represented by a set of areas enclosing part of a surface, in GIS usually the top only.
area: A two-dimensional (area) feature represented by a line that closes on itself to form a boundary.
ASCII: The American Standard Code for Information Interchange. A standard that maps commonly used characters such as the alphabet onto one-byte-long sequences of bits.
Autocad: A leading CAD programme by Autodesk, often interfaced with GIS packages and used for digitizing, especially floor plans and engineering graphics.
DLG: A vector format used by the USGS for encoding lines on large-scale digital maps.
double digitized: The same feature captured by digitizing twice.
DXF: Autocad’s digital file exchange format, a vector mode industry-standard format for graphic file exchange.
GBF: Geographic Base File. A database of DIME records.
PostScript: Adobe Corp.’s page definition language. An interpreted language for page layout designed for printers but also an industry standard for vector graphics.
TIGER: A map data format based on zero-, one-, and two-cells, used by the U.S. Census Bureau in the street-level mapping of the United States.
HPGL: Hewlett Packard Graphics Language. A device-specific but industry-standard language for defining vector graphics in page coordinates.
USGS: The United States Geological Survey, part of the Department of the Interior and a major provider of digital map data for the United States.
VPF: Vector product format, a data transfer standard within DIGEST for vector data zero/one/two cell: TIGER terminology for point, line, and area, respectively.
Ex. 4 Match the words on the left with their meaning on the right. Use these terms to render the text into Russian.
1. polygon а. кривая линия
2. arc b. отдельный элемент
3. entry c. замкнутая линия
4. evolve d. эффективный, действенный
5. efficient e. действенный, имеющий силу
6. valid f. развивать, разрабатывать
-
1
2
3
4
5
6
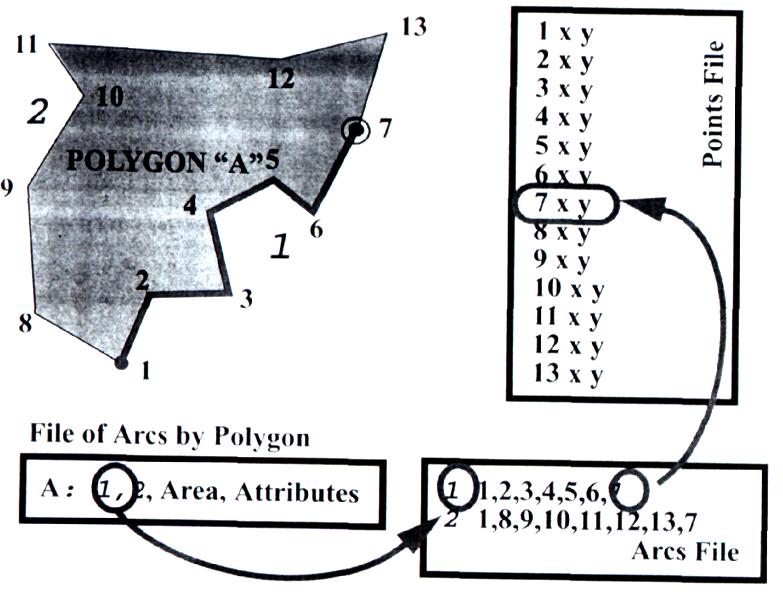
Figure 2 : Arc/node map data structure with files.
At the least, we need a file containing the attributes for the polygon, a file listing the arcs within the polygon and finally a file of coordinates that, are referenced by the arc file. Figure 2 shows that we need to store in each of these files a set of references between the files. For example, an entry in the arcs files states that to get the points for arc 2 from the points file they begin at the first coordinate point in the file, followed by the eighth, the ninth, and so on.
During the early days of GIS, several systems evolved different versions of this structure. Obviously, to save space we could write the files in binary. There are few ways, however, to store point, line, and area data that are as efficient. As long as the data are valid, this is a very powerful way to store data for map features. When the system breaks down, however, is when data contain errors, which is virtually always.
The formats of the data are documented formally, and the files are ASCII. They use the ground coordinates in UTM, truncated to the nearest 10 meters to reflect their locational precision and to save space. Features are handled in separate files—for example, hydrology, hypsography (contours and topographic features), transportation, and political. Many GIS packages will import these files, but often some extra data manipulation is necessary, such as making the records of some fixed line length in bytes.
Ex. 5 Read the text. Put questions to the words or phrases in italics. Use the
answers to the questions to give a brief summary of the text.
RASTER DATA STRUCTURES
Raster or grid data structures have formed the basis for many GIS packages. The grid is a surprisingly versatile way of storing data. The data form an array or matrix of rows and columns. Each pixel or grid cell contains either a data value for an attribute, or an index number that points to reference in the attribute database. So a pixel containing the number 42, for example, could correspond with the number 42 or ‘deciduous forest’ in the Anderson Level II system, or just the 42nd record in the attribute file.
To write the numbers to a file, we can just start the file with any necessary attribute codes, perhaps the number of rows and columns and the maximum size of one value, and then write the data into the file in binary across all columns for all rows, one long stream of data with a start and an end, like an unraveled sweater. When reading the data back in, we just place the data back into a raster grid of the correct dimensions.
Ex. 6 Fill in the gaps with the prepositions from the box.
-
from for (2) by (2) with (2) of (3)
WHY TOPOLOGY MATTERS
When topological data structures became widespread in GIS, some significant benefits resulted, enough that today the vector arc/node data structure (1)___ topology probably is the most widespread (2)___ GIS data. Typically, a GIS maintains the arc as the basic unit, storing (3)___ it the polygon left and right, the forward and reverse arc linkages, and the arc end nodes (4)___ testing. This means that each line is stored only once and that the only duplication is the endpoints. The disadvantage is that whenever areas or polygons are to be used, some recomputing is necessary. Most programmes save the result, however, such as the computed polygon areas, so that recalculation is unnecessary.
Topology allowed GIS for the first time to do error detection. If a set (5)___ polygons is fully connected, and there are no gaps at nodes or breaks in the lines defining the areas, the set (6)___ areas is called topologically clean. When maps are first digitized, however, this is rarely the case. The topology can be used to check the polygons. Polygon interiors are usually identified (7)___ digitizing a point inside a polygon, a label point, and (8)___ keeping track of the arcs as they are entered. A polygon gets the label from the label point when the point is found to be inside the polygon. A GIS will have the ability to build the topology (10)___ the unconnected arcs. First, each endpoint is examined to see if it is ‘close’ to another. If it is, the points are ‘snapped’ together; that is, their (x. y) coordinates are averaged and each is replaced with exactly the same values (Figure 3).
Ex.7 Before examining Figure 3 accompanying the above given text find the
meaning of the following terms as well as some other useful word combinations:
1. sliver ___________________________
2. spike ___________________________
3. unsnapped node ___________________________
4. erroneous coordinate ___________________________
5. unended line ___________________________
6. ark linkage ___________________________
7. topology matter ___________________________
8. duplication ___________________________
9. computed polygon areas ___________________________
10. the same values ___________________________
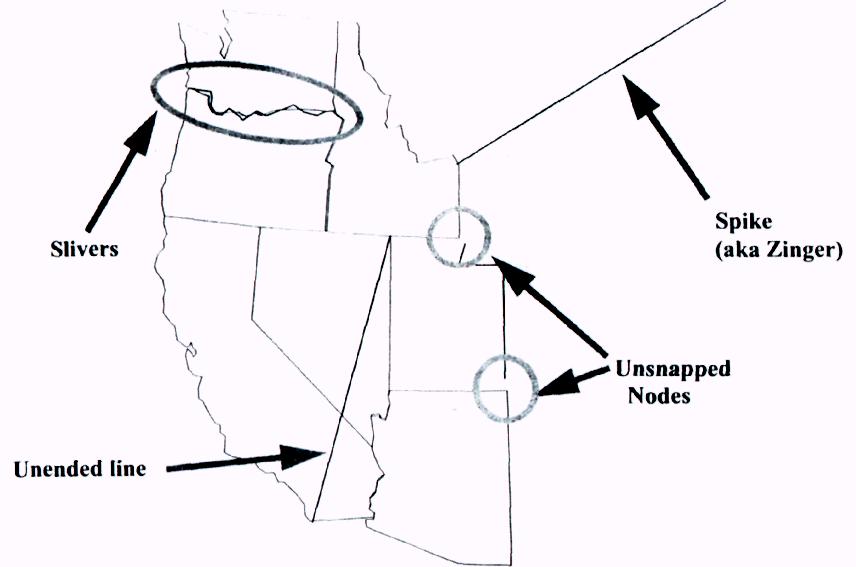
FIGURE 3: Example of slivers (unmatched nodes along two lines), unsnapped nodes (endpoints of two lines that should be the same point), spikes (erroneous coordinates), and unended lines.
Ex.8 Look up the following words in your dictionary and find their meaning.
1. consistent ____________________ 4. county ________________
2. overlain ___________________ 5. generalized ________________
3. node ____________________ 6. retrieval ________________
Ex. 9 Now use these words to read and understand the passage. Figure 3 will be of help to you.
The primary advantage of having a topologically consistent map is that when two or more maps must he overlain, much of the initial preparation work has been done. What still has to be established are where new points must be added along lines to become nodes, and how to deal with any small or sliver polygons that are created (Figure 3). The latter can be a real problem. Many borders between regions, states, counties and so on match along lines such as rivers, which are generalized differently at different map scales. Although the line should be the same, in fact it is not. Some packages allow the extraction of a line from one map to be ‘frozen’ for use on another. This seemingly small difference can be very significant, especially if areas or densities are being calculated.
Ex.10 Discuss whether the statements to the above given passage are true (T) or false (F).
1. The Test Point is wholly inside the bounding rectangle. ( )
2. (x, y ) data are continuously used in many operations of retrieval
and analysis. ( )
3. (x, y ) values are saved without topological information in the arcs file. ( )