

2А. Сборка принципиальной электрической схемы схемы
Загрузим Simulink Library Browser (кнопка на панели инструментов MATLAB). Создадим новую модель (File à New à Model). Для моделирования нашей схемы будем использовать SymPowerSystem.
В качестве элементов цепи используем комбинацию Series RLC Branch (последовательно соединенные сопротивление, индуктивность и емкость) из библиотеки Elements (рис. 4.1).

After dragging the icons of the element in the window Edition created model will change its parameters:
- Inductance L at 0
- Capacitance C for
Inf (infinity)
- Resistance R at the required me-us resistance (in ohms).
После перетаски-вания “иконки” элемен-та в окно редактиро-вания созданной модели изменим его параметры:
- Inductance L на 0
- Capacitance C на
Inf (бесконечность)
- Resistance R на требуе-мое нам сопротивление (в Ом).
Next, create a source of EMF. To do this, libraries Electrical Sources (Figure 4.1) select the element AC Voltage Source.
Amplitude change the setting to the desired value of the EMF (100 volts) and define the frequency of the AC emf by changing the parameter Frequency at 6000 Hz.
To measure the current in the circuit and the voltage on R, C, and L is chosen from the library Mea-surements elements Current Measurement, and Voltage Measurement, respectively (Fig. 4.2).
Далее создадим источник ЭДС. Для этого в библиотеки Electrical Sources (рис. 4.1) выбираем элемент AC Voltage Source.

Изменим параметр Amplitude на требуемое значение ЭДС (100 Вольт) и зададим частоту источника переменной ЭДС, изменив параметр Frequency на 6000 Герц.
Для измерения тока в цепи и напряжений на R, C и L выбираем из библиотеки Mea-surements элементы Current Measurement и Voltage Measurement соответственно (рис. 4.2).

This element has one input terminal («+») and two output terminals ("- " and «i»). Clips "+"and "-" is used to include an item in the chain, and from time «i» is a signal with a value of current strength, which should apply to the display (Item Display, located in the library adjoint Simulink à Sinks) or an oscilloscope (Scope ) (Fig. 4.3).
To measure the values of variables stresses choose Powergui-Continuous block of the Series RLC Branch. After starting the simulation in it displays the values of currents in the branches (Open Powergui-Continuous àchoose the Steady State Voltage and Currents).
Put it all started (selected) elements in accordance with a given scheme, we obtain a consistent model of the RLC-circuit (Fig. 4.4).
Эти элемент имеет один входной зажим («+») и два выходных зажима («-» и «i»). Зажимы «+» и «-» служат для включения элемента в цепь, а от зажима «i» идет сигнал со значением силы тока, который следует подать на дисплей (элемент Display, располо-женный в библиотеке Simulink à Sinks) или осциллограф (Scope) (рис. 4.3).
Для измерения значений переменных напряжений выбираем блок Powergui-Continuous из Series RLC Branch. После запуска симуляции в нем отобразятся значения токов в ветвях (Открываем Powergui-Continuous à выбираем Steady State Voltage and Currents).
Соединив все созданные (выбранные) элементы в соответствии с заданной схемой, получим модель исследуемой последовательной RLC-цепи (рис. 4.4).
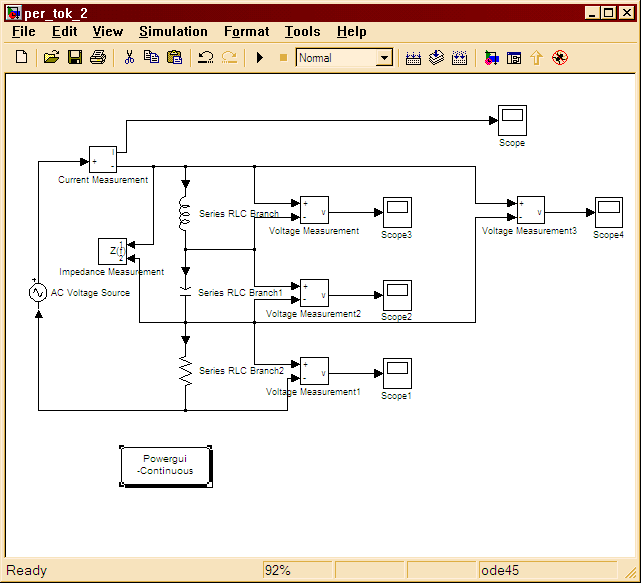
Рис. 4.4. Модель исследуемой последовательной RLC-цепи
Thus, the window model has the form shown in Fig. 4.5. Parameters of elements of the principal electric circuit are installed in accordance with your vari-Antu baseline data (Appendix A4) and tabulated in the report.
3A. Research
After studying the theory and build a study design of the resonant phenomena in the sequence RLC-circuit is carried out as follows.
1. Making measurements of the circuit parameters as a function of frequency sinusoidal-voltage:
- The current in the electrical circuit;
- Stress on all elements of the circuit;
- The total voltage (UL+UC), which is zero
one of the indicators to achieve resonance in the circuit;
- Phase shift between the voltage (UL+UC) and the current in the circuit,
while the nominal values of L and C must be chosen under the terms of a resonance at a frequency corresponding to approximately the middle of the set interval.
2. Tabular presentation of the results of the experiment.
3. A graphical representation of simulation results.
4. Experimental evaluation of resonant frequency and coefficient of resonance.
5. Comparison of experimental estimates of wо and Q with the theoretical values.
6. Formulation of the conclusions of the study.
Таким образом, окно моделирования имеет вид, приведенный на рис. 4.5. Параметры элементов принципиальной электрической схемы устанавливаются согласно Вашему варианту исходных данных (Приложение П4) и их табличным представлением в отчёте.