

#12. Simple Regression Model (srm)
This is the situation where Y depends on var. X
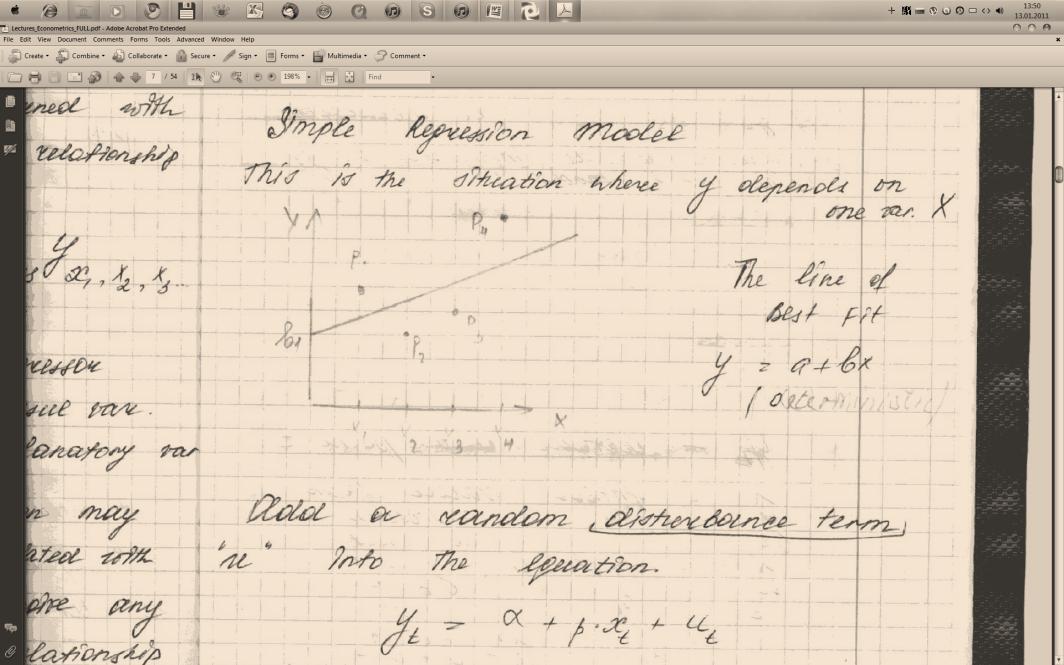
The line of best fit: y=a+bx (deterministic)
Add
a random disturbance term “u” into the equation

t – number of observations
The
slope provides an estimate of the slope coefficients β, which is
denoted


Where
 - fitted value of Y corresponding to X
The disturbance term can capture a number of features.
There may be errors in the measurement of Yt that cannot be modified.
Random. outside influences on Yt which cannot model.
BUT!!! The disturbance should be minimized! Вы ВСЕ обязаны!


# 13. Simple Linear Model (slm)
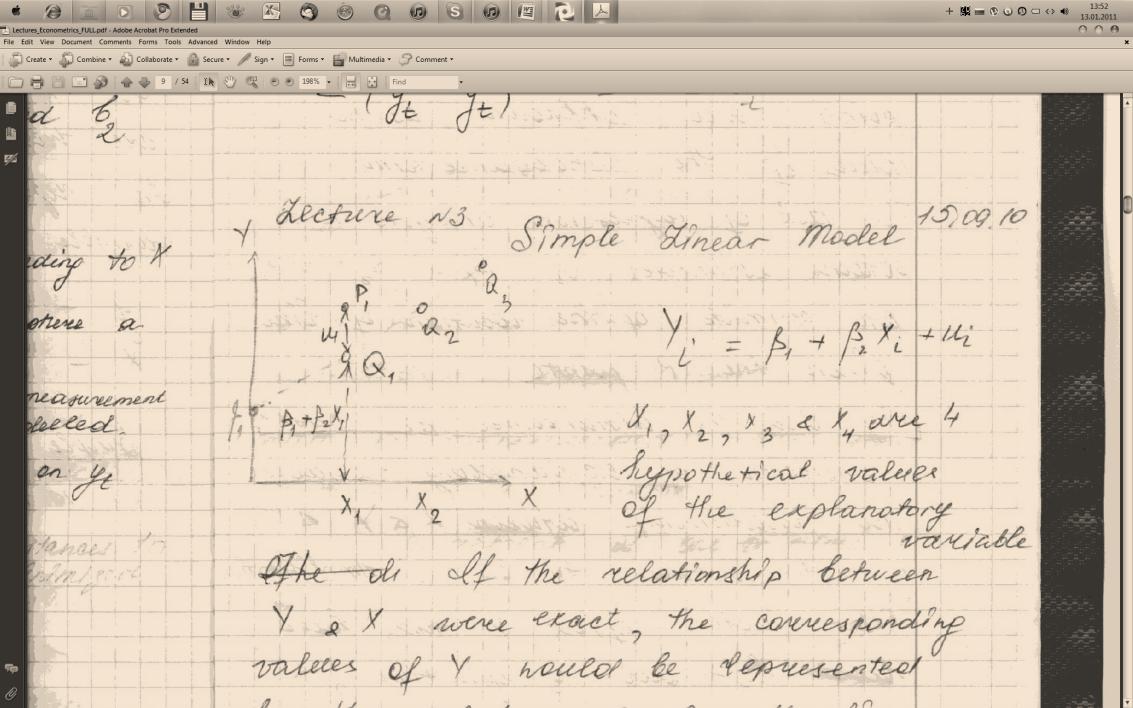

X1, X2, X3, X4 – four hypothetical values of the explanatory variable.
If
the relationship between Y and X were exact, the corresponding value
of Y would be represented by the point Q1…Q4 of the line. {{The
disturbance term causes the actual value of Y to be different. In
the diagram the Disturbance Term has been assumed to be positive in
the first and fourth observations and negative in the other two,
with the result that if one plots the actual value of Y against the
value of X, one obtains the pints P1…P4. P1 and P2 => the
location of Q points are unknown, as the value of the Dist.Term.}}
The task of regression analysis is to obtain estimates of
 =>
an estimate of the location of line given the P positive.
=>
an estimate of the location of line given the P positive.
# 14. What is the disturbance term?
The Dist.Term is appended to the model in order to allow for the analyst's inability to literally capture all factors that might conceivably determine Y in the real world. In other words, ϵ incorporates factors such as unforeseen events that affect Y and factors that determine Y that were inadvertently omitted from the deterministic part of the specification or that simply was not measured or was not measurable. + {part of question #13}
# 15. Why does the disturbance term exist? (5 reasons)
Why does it fucking exist?
Omission of explanatory variable.
The relationship between X and Y is almost certain to be an implification (такого слова НЕТ!!!). Other factors affects Y that have been left out of the equation, and their influence will cause the points to lie off the line. There are var. which you would like to include in the regression equation but can’t (!), because unable to measure them. (Shame on a Nigga!).
Aggregation of variables.
In many cases the relationship is an attempt to summarize a number of microeconomic relations.
Model misspecification.
The model may be misspecified (такого слова НЕТ!!!) in terms of its structure.
Functional misspecification.
The functional relationship between Y and X may be misspecified, бля, mathematically.
Measurement error.
If the measurement of one or more of the variables in the relationship is subject to error, the deserved value won’t appear to conform to an exact relationship, and the discrepancy contributes to the Dist.Term.
#16. The Fitted Line.
OpenSub

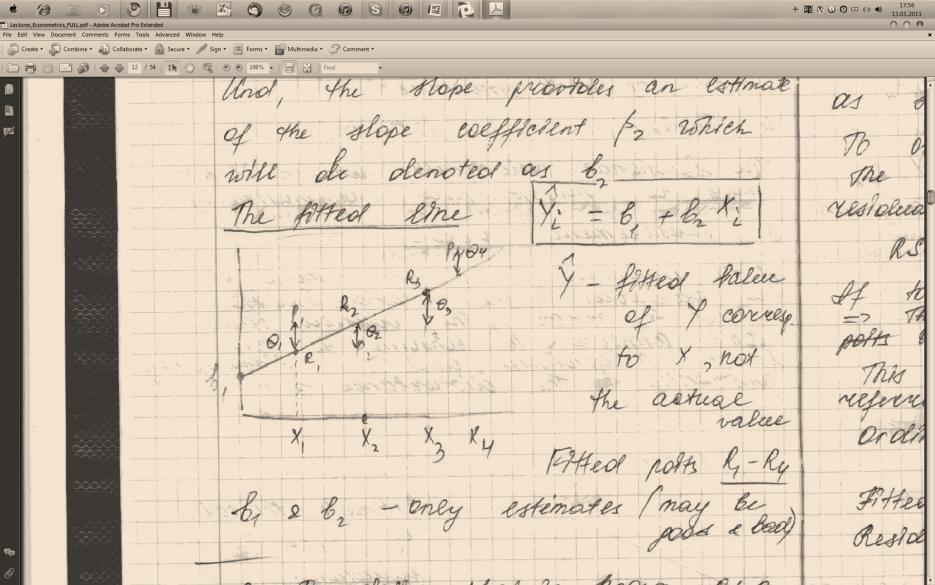

Fitted points R1…R4
B1 and B2 – only estimates (may be good and bad)
#17. What is a residual for each observation? (included in #16)
To
define what is known as a residual for each observation. This is the
difference in an observation
 it is denoted as
 .
The residual value depends on our choice of B1 and B2. We wish to
choose B1 and B2 in a such way that to make the residuals as small
as possible. To override the problem – minimize the sum of the
squares of the residuals in RSS.
.
The residual value depends on our choice of B1 and B2. We wish to
choose B1 and B2 in a such way that to make the residuals as small
as possible. To override the problem – minimize the sum of the
squares of the residuals in RSS.
 ;
if to reduce RSS to 0 => all residuals = 0. This form used here
is usually reffered to as ordinary least squares (dS). Fitted line
is approximation line. Residual for each observation – disturbance
between the profit and error.
;
if to reduce RSS to 0 => all residuals = 0. This form used here
is usually reffered to as ordinary least squares (dS). Fitted line
is approximation line. Residual for each observation – disturbance
between the profit and error.
EndSub