

Analyst’s forecasts22
According to Value Line analysis dividends annual growth rate over the next 5 years equals 16%.
Thus g3=16%. So eventually, we have all data to calculate price of the stock.
Table 15 Stock Price Data
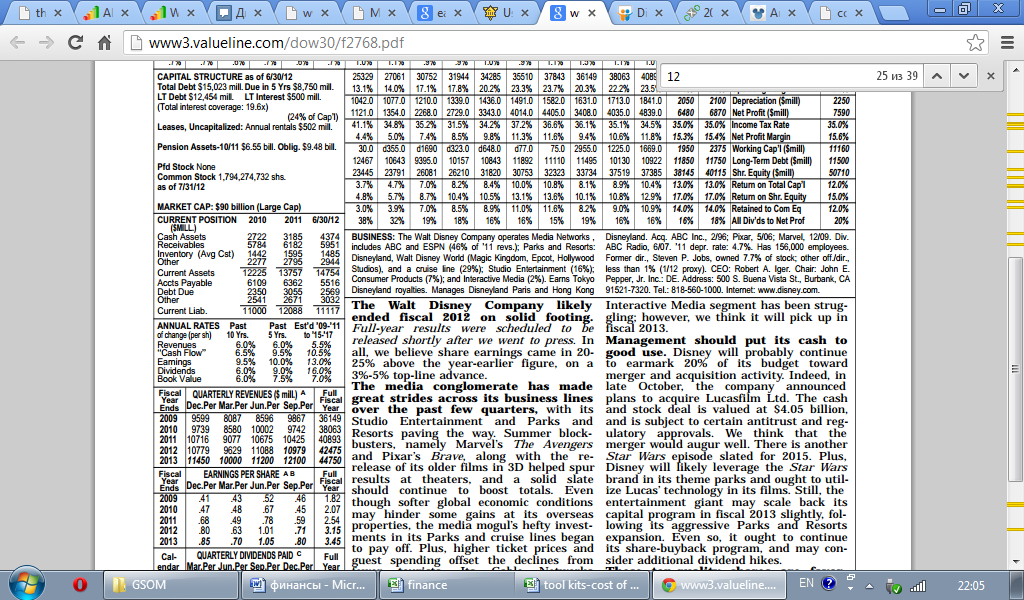
Current stock price, $ |
48,67 |
g1 |
11.88% |
g2 |
16.12% |
g3 |
16% |
The results are as following:
Table 16 Stock's Growth Rate
Price of the stock |
|
with g1 |
13,26% |
with g2 |
17,55% |
with g3 |
17,43% |
From our point of view, g3 is the best choice for further calculations, it’s almost the same as g3.
There is no significant difference in g2 and g3. However studies have shown that analysts’ forecasts usually represent the best source of growth rate data for DCF cost of capital model23. Moreover analysts, probably, take into account more factors than other models, which are mostly based on mathematics, but not on the logic itself.
3. Over-own-bond-yield-plus-judgmental-risk-premium approach
The third method of the cost of equity estimation is quite subjective, as we just add a judgmental resk premium of 3% to 5% to the interest rate on the firm’s long-term debt. We choose 3%, as Disney is stable company with low-interest rate debt (See Part Bonds).
In this approach: Rs=Company’s own bond yield +Judgmental risk premium.
Rs=1, 83%+3%= 4, 83%.
As the risk premium is a judgmental estimate, the estimated value of Rs is also judgmental.
Comparison of the models:
CAPM: Rs=8,12%
DCF: Rs=17,43%
Over-own-bond-yield-plus-judgmental-risk-premium approach: Rs=4, 83%
The overall average of these three methods= 16, 08%
All three models provide widely varied estimates. Over-own-bond-yield-plus-judgmental-risk-premium approach is not applicable for Disney at all, as it’s used for companies that are not publicly traded. So we should choose between CAPM and DCF. As survey indicates CAPM model is logically right and widely used we could use its result for further estimations. However DCF model shows the highest cost of equity, there could be difficulties in its use, as Disney’s dividend growth rate is not constant, while CAPM model is adjusted for systematic risk, Moreover, Disney is mature company with stable performance. That’s why we can rely on the past in our predictions. So the fact that CAPM model has a disadvantage of relying on historical indicators is not the most pivotal factor to consider in this case. Furthermore, many analysts believe in validity of this model.
The cost of capital
The eventual formula for weighted average cost of capital (WACC) will be:
WACC = wdrd(1-T) + wsrs,
where wd – target weight of debt,
ws – target weight of common equity,
rd – interest rate on the firm’s new debt,
rs – component cost of common equity.
As it was mentioned above the preferable approach to estimate the cost of common equity is CAPM model, we take the rate 8,12%.
Now we estimate the weighted average cost of capital:
WACC = 12,91%*1,83%+87,09%*8,12% = 7,31%.
7,34% is the cost the company would incur to raise marginal dollar of capital.
The WACC is the rate of return that the firm must expect to earn on its average-risk investments. Our weighted cost of capital is relatively low which means low risk. Low risk in its turn leads to high enterprise value.
Also we could use another method. We could estimate three WACC using all the three approaches regarding to the cost of common equity. Afterwards, we could find the average of three WACC. In this case the average weighted average cost of capital would be 8,9%.
The WACC is the rate of return that the firm must expect to earn on its average-risk investments. Our weighted cost of capital (7,31%) is relatively low which means low risk. Low risk in its turn leads to high enterprise value.