6.5. Control charts for proportions
Now let us consider situations, where individual product items will be checked to have conformed or not to have conformed to specifications. Again, a sequence of samples is taken over time to control product quality. Our interest is the proportion of nonconforming, or defective, items in each sample. It is clear that, it is desirable that this proportion be as small as possible, and any increasing trend over time should cause concern.
The
![]() chart is used to monitor the proportion of defective items. One
important difference between
chart and charts of previous section is that here much larger sizes
are necessary. Any competently engineered production process is not
going to generate a large proportion of nonconforming items.
Therefore, to get a reasonable result, a relatively large sample size
is necessary.
chart is used to monitor the proportion of defective items. One
important difference between
chart and charts of previous section is that here much larger sizes
are necessary. Any competently engineered production process is not
going to generate a large proportion of nonconforming items.
Therefore, to get a reasonable result, a relatively large sample size
is necessary.
Suppose that a sequence of K samples, each of n observations, is taken from production process. The proportions of sample members not conforming to conforming can be determined as
![]()
![]()
where
![]() number
of not
conforming items;
number
of not
conforming items;
![]() sample
size
sample
size
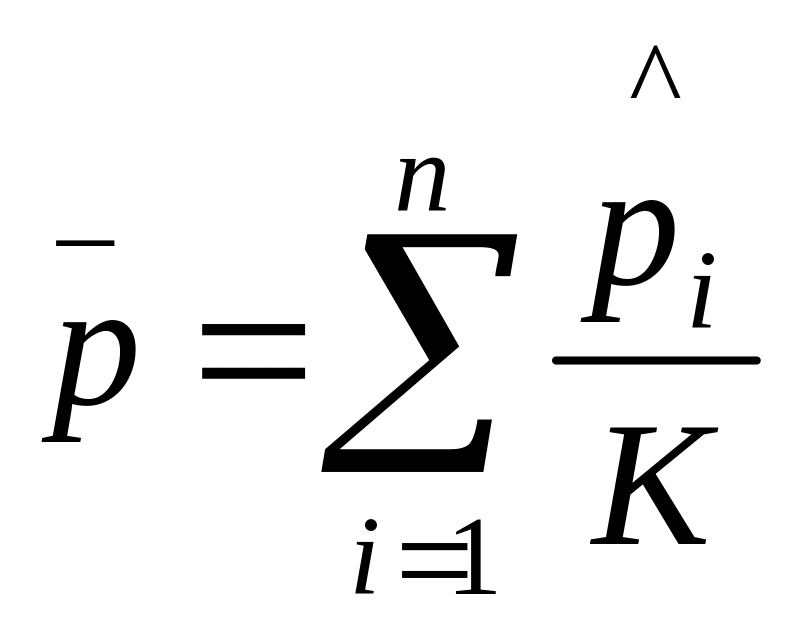
If the samples are the same size, the average of the sample proportions is the overall proportion of nonconforming items. This is

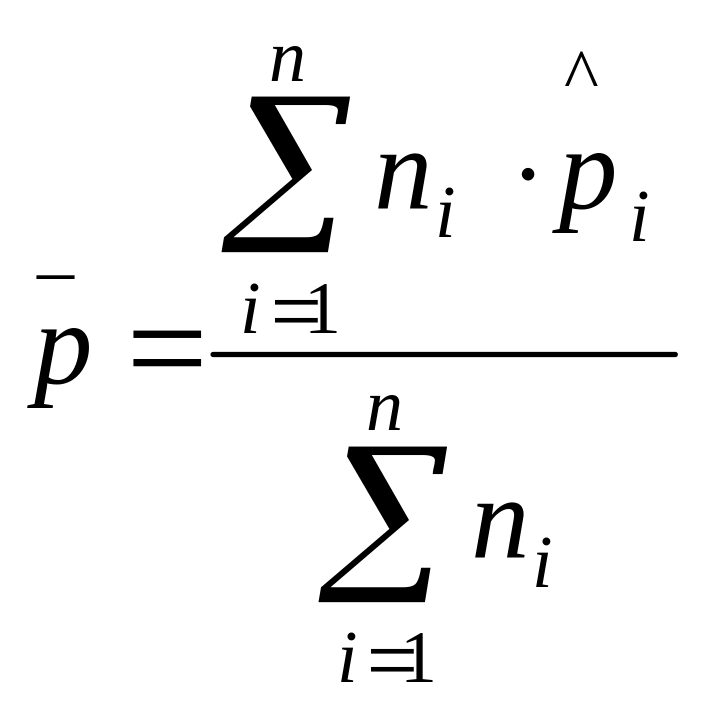
If sample sizes are not equal, then overall proportion of nonconforming items is defined as

We
know that individual sample proportions
![]() have
sampling distribution with mean estimated by
have
sampling distribution with mean estimated by
![]() and
standard deviation (standard error) given by
and
standard deviation (standard error) given by
![]()
Similar to the chart and chart, three-standard error limits will be used for chart.
Control chart for proportions
The chart is a time plot of the sequence of sample proportions of nonconforming items.
The central line is
![]()
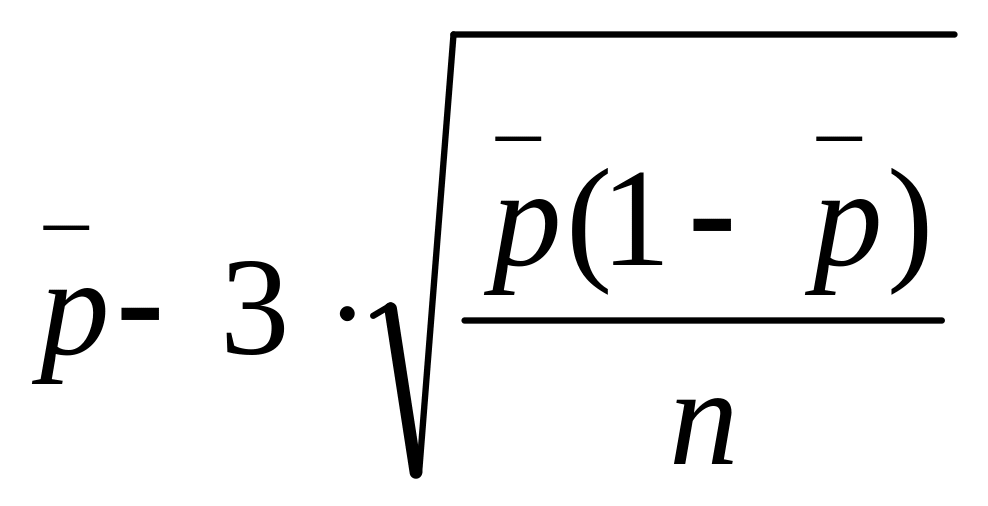
The lower control limit is
![]()

The upper control limit is
![]()

Remark1:
If the lower control limit gets a negative value, which is impossible, we set the lower control limit at zero.
Remark2:
Interpretation of chart is similar to the interpretation of chart and chart.
Remark3:
To use MINITAB menu follow the following instructions:
1. Select Stat>Control charts>Select P
2. Enter variable location (for example, C1)
3. Enter subgroup size (200, 300 etc.). If sample sizes vary, corresponding sample sizes should be in column (for example, C2)
4. Click OK.
Exercises
1. In the study of production process, 25 samples, each of 300 observations were taken. The average of the sample proportions of nonconforming items was 0.064. Find the center line and upper and lower control limits for p-chart.
2. Data were collected from a process in which the factor of interest was whether the finished item contained a particular attribute. A total of 30 samples were selected. The common sample size was 100 items. The total number of nonconforming items was 270. Based on these data, compute the central line, the upper and lower control limits for p-chart.
3. Samples of bowling balls are selected and screened to see whether there are any defects on their surfaces. The number of defective balls recorded for each sample is given here
-
Sample
Size
Number of defective balls
1
2
3
4
5
6
7
8
200
200
200
200
200
200
200
200
10
8
9
32
15
35
38
10
a) Find the center line and upper and lower control limits for p-chart.
b) Draw the p-chart and discuss its features.
4. Baseball caps are manufactured and checked to see whether the logos are properly printed on them. The number of defective logos per sample is shown below
-
Sample
Size
Number of defective balls
1
2
3
4
5
6
100
100
100
100
100
100
8
6
5
27
9
10
a) Find the center line and upper and lower control limits for p-chart.
b) Draw the p-chart and discuss its features.
5. Proportions of nonconforming items in a sequence of 12 samples, each 400 observations, are given below
-
Sample

Sample
1
2
3
4
5
6
0.061
0.060
0.043
0.051
0.037
0.042
7
8
9
10
11
12
0.068
0.036
0.064
0.056
0.046
0.039
a) Find the center line and upper and lower control limits for p-chart.
b) Draw the p-chart and discuss its features.
Answers
1.![]() ;
;![]() ;
;![]() ;2.
;2.![]() ;
;![]() ;
;![]() ;3.a)
;3.a)![]() ;
;![]() ;
;
![]() ;4.
a)
;4.
a)
![]() ;
;![]() ;
;
![]() ;
;
5.
a)![]() ;
;![]() ;
;
![]() ;
;
