

Consumer’s optimization
Figure 21-9
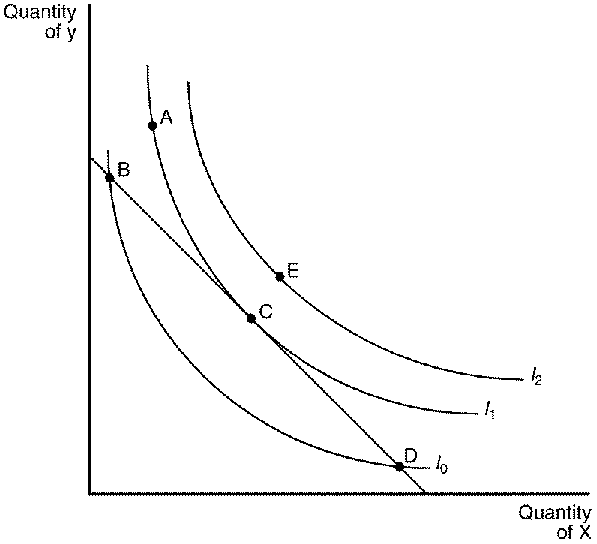
125. Refer to Figure 21-9. Given the budget constraint depicted in the graph, the consumer will choose bundle
-
a.
B.
b.
C.
c.
D.
d.
E.
ANS: B DIF: 1 REF: 21-3 NAT: Analytic
LOC: Utility and consumer choice TOP: Optimization
MSC: Analytical
126. Refer to Figure 21-9. It would be possible for the consumer to reach I2 if
-
a.
the price of Y decreases.
b.
the price of X decreases.
c.
income increases.
d.
All of the above would be correct.
ANS: D DIF: 2 REF: 21-3 NAT: Analytic
LOC: Utility and consumer choice TOP: Optimization
MSC: Analytical
127. Refer to Figure 21-9. Bundle B represents a point where
-
a.
MRSxy > Py/Px.
b.
MRSxy = Px/Py.
c.
MRSxy < Px/Py.
d.
MRSxy > Px/Py.
ANS: D
128. Refer to Figure 21-9. Bundle C represents a point where
-
a.
MRSxy > Py/Px.
b.
MRSxy = Px/Py.
c.
MRSxy < Px/Py.
d.
MRSxy > Px/Py.
ANS: B
129. Refer to Figure 21-9. Bundle D represents a point where
-
a.
MRSxy > Py/Px.
b.
MRSxy = Px/Py.
c.
MRSxy < Px/Py.
d.
MRSxy < Py/Px.
ANS: C
130. The consumer's optimum is where
-
a.
MUx/MUy = Py/Px.
b.
MUx/Py = MUy/Px.
c.
Px/MUx = Py/MUy.
d.
MUx/MUy = Px/Py.
ANS: D
Figure 21-10
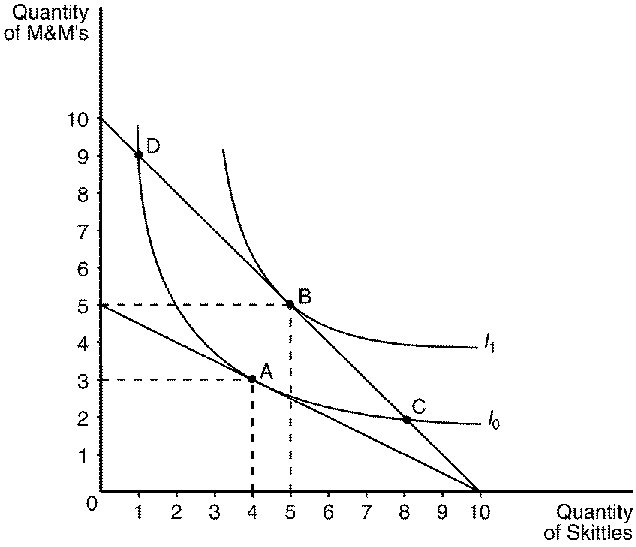
131. Refer to Figure 21-10. Assume that the consumer depicted in the figure has an income of $20. The price of Skittles is $2 and the price of M&M's is $4. This consumer will choose a consumption bundle where the marginal rate of substitution is
-
a.
2.
b.
2/3.
c.
1/2.
d.
1/3.
132. Refer to Figure 21-10. Assume that the consumer depicted in the figure has an income of $20. The price of Skittles is $2 and the price of M&M's is $4. This consumer will choose consumption bundle
-
a.
A.
b.
B.
c.
C.
d.
D.
133. Refer to Figure 21-10. Assume that the consumer depicted in the figure has an income of $50. The price of Skittles is $5 and the price of M&M's is $5. This consumer will choose a consumption bundle where the marginal rate of substitution is
-
b.
5.
134. Refer to Figure 21-10. Assume that the consumer depicted in the figure has an income of $20. The price of Skittles is $2 and the price of M&M's is $2. This consumer will choose to optimize by purchasing bundle
-
b.
B.
135. Refer to Figure 21-10. Assume that the consumer depicted in the figure faces prices and income such that she optimizes at point B. According to the graph, which of the following would cause the consumer to move to point A?
-
d.
an increase in the price of M&M's
Figure 21-11
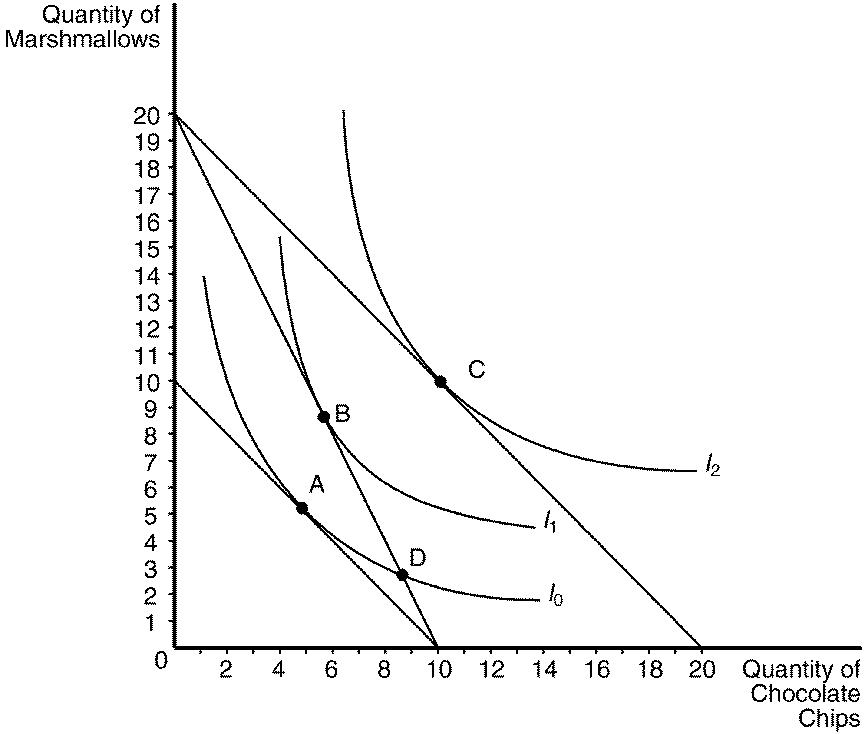
136. Refer to Figure 21-11. Assume that the consumer depicted in the figure has an income of $40, the price of a bag of marshmallows is $2, and the price of a bag of chocolate chips is $2. The optimizing consumer will choose to purchase which bundle of marshmallows and chocolate chips?
-
c.
C
137. Refer to Figure 21-11. Assume that the consumer depicted in the figure has an income of $100 and currently optimizes at bundle A. When the price of marshmallows decreases to $5, which bundle will the optimizing consumer choose?
-
c.
C
138. Refer to Figure 21-11. Assume that the consumer depicted in the figure has an income of $40. If the price of chocolate chips is $4 and the price of marshmallows is $4, the optimizing consumer would choose to purchase
-
c.
5 marshmallows and 5 chocolate chips.
139. Refer to Figure 21-11. Assume that the consumer depicted in the figure has an income of $80. If the price of chocolate chips is $4 and the price of marshmallows is $4, the optimizing consumer would choose to purchase
-
b.
10 marshmallows and 10 chocolate chips.
140. Refer to Figure 21-11. Assume that the consumer depicted in the figure has an income of $40. Based on the information available in the graph, which of the following price-quantity combinations would be on her demand curve for marshmallows if the price of chocolate chips is $4?
-
d.
P=$4, Q=9
141. Refer to Figure 21-11. Assume that the consumer depicted the figure has an income of $50. Based on the information available in the graph, which of the following price-quantity combinations would be on her demand curve for marshmallows if the price of chocolate chips is $2.50?
-
b.
P=$2.50, Q=10
142. Which of the following represents a consumer's optimum?
-
a.
MUx/MUy = Py/Px
143. A consumer has preferences over two goods, X and Y. Suppose we graph this consumer's preferences (which satisfy the usual properties of indifference curves) and budget constraint on a diagram with X on the horizontal axis and Y on the vertical axis. At the consumer's current consumption bundle, the consumer is spending all available income, and the marginal rate of substitution is greater than the slope of the budget constraint. We can conclude that the consumer
-
a.
is currently maximizing satisfaction.
b.
could increase satisfaction by consuming more X and less Y.
c.
could increase satisfaction by consuming less X and more Y.
d.
could purchase more X and more Y and increase total satisfaction.