Figure No.5
A = – 0.58, B = – 2.75
Q38 Of the following statements, which are considered to be the determinants of price elasticity of demand?
1. The number of substitute goods available.
2. The percentage of consumer’s income spent on the good.
3. The market clearing price
4. The closeness of definition.
5. Whether the product is habit forming.
All but 3
Q39 The demand for petrol driven cars would shift LEFT if which of the following were to happen?
1. The price of these types of cars increased
2. The price and availability of viable substitutes to petrol driven cars fell 3. Price and availability of complements (e.g. car insurance) fell 4. A rise in consumers' real incomes
5. Consumers believe a sales tax on cars is likely to be abolished in the near
future
6. Consumers in general believe the selling price of all cars is likely to fall in the near future.
2, 3, and 4
Q40 If a decrease in consumer income increases the demand for a good, then the good is a
inferior good
The Firm: Output, Prices and Profits
For Questions 41, 42, and 43 please refer to figure No. 6
Q41 Figure No.6 shows the weekly costs and revenues for a given firm. Normal profits of £50 are included in total fixed costs. Given the shape of these costs and revenue ‘curves’, this firm would be described as which of the following?
Figure No.6
Price maker with Diminishing Marginal Returns
Q42 At what output (Q) will this firm (shown in figure No.6) make maximum profits and what price (P) would it charge?
(Q) = 400, (P) = £3.60
Q43 In figure No.6, at the profit maximising output what type of profit would this firm earning?
Super- normal
QFigure No.7
44 Figure No. 7 shows the Total
Revenue
c urve
for firm A, which of the following statements is correct?
urve
for firm A, which of the following statements is correct?
Firm A is a price taker; the market price for the product is £12.
Q45 When a firm is a price taker,
its marginal costs will always be equal to its marginal revenue.
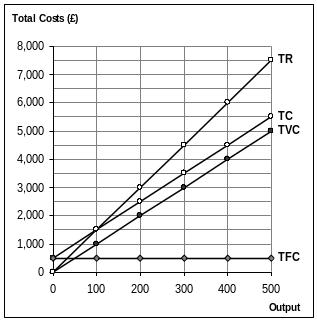
QFigure No.8
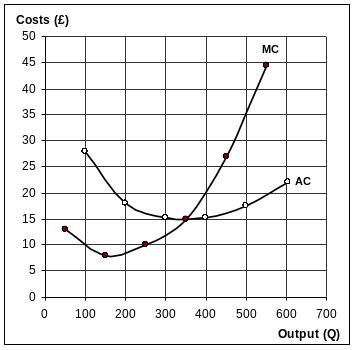
46 The plot below shows the weekly costs for a price-taker, if the market price of the product is £20 and assuming their business objectives are to maximise profits how many units should they aim to produce a week?
The firm will produce at 400 units (per week), earning supernormal profits .
Q47 A manager of a manufacturing firm treats normal profits as a fixed cost of production (i.e. they are treating the owners’ expected return on capital employed as a cost). To break even, ensuring at least a normal profit, the manager should set price and output where;
MC = MR
Q48 In terms of normal profits which of the following statements are FALSE?
A firm making less than a normal profit but covering its explicit costs is by definition still making a profit.
Q49 The diagrams below show the weekly total cost structures for two firms, producing similar products. In this example neither firm is experiencing diminishing marginal returns. The firms are run by managers and normal profits are included in total fixed costs (TFC). Both firms sell their product for £15 (thus TR = Total Revenue)