

vk.com/id446425943
Russia
Energy: Integrated Oil & Gas
21 December 2018
Equities
Change of Recommendation
Russian Oil and Gas
Go after the oil price
The drop in oil prices (Brent has lost 35% since its October peak) has led to a tangible downward move in the futures curve. This, coupled with the relatively stable RUB rate, is to hit Russian oils’ profitability as early as in 4Q18, we believe. Having incorporated the up-to-date oil futures curve and the recent OPEC+ crude output cuts, we have downgraded the Russian oil sector to Sell and revised our 12-month Target Prices down 13-36%. Gazprom Neft, Surgut ords, Tatneft ords are Sells. Gazprom ords and Surgut prefs (on the stock performance, as they are up against peers since November) and Tatneft prefs are downgraded to Hold. Lukoil is kept on Hold thanks to the ongoing buyback and existing dividend policy.
Shift down in oil futures curve is now in our models. We incorporate the up-to-date Brent futures curve (as reported by Bloomberg) and the respective RUB rates into our oil company models (Figure 1), as well as the OPEC+ production cut. As a result, we are downgrading Gazprom, Surgut prefs and Tatneft prefs to Hold from Buy (with new TPs of USD 2.30, USD 0.55 and USD 8.20, respectively), as well as Gazprom Neft and Surgut ords to Sell from Hold (USD 4.70 and USD 0.36), and reiterating our Sell for Tatneft ords (USD 7.00). Although we are cutting our TP for Lukoil 16% to USD 71, the ongoing buyback as well as the existing dividend policy (which implies growing DPS in RUB terms despite the decrease in the EPS) is set to provide good support for the stock, we think. Therefore, we rank Lukoil and Surgut prefs (due to the implied 17% DY) as better than the others.
Oil down 35%, but RTS O&G just 12%. We think the market might underestimate Russian oil names’ sensitivity to oil prices from their much increased exposure to numerous tax-breaks (see our Russian Oils Upstream - The Metamorphoses. Rise of Titans, of 5 October). Also, the OPEC+ agreement is likely to be destructive for select names (Tatneft’s TPs are down more than peers’ due to the much greater downward revision to crude production vs. the company’s guidance – see our Oil Sector – Update on the production cut renewal, of 12 December). The conversion of negative floating excise from subsidy into additional tax (see our Russian Oils Downstream - Merry Floating and a Happy New Year, of 19 December) is to be painful for companies with domestic market exposure. The surprising resilience of the local currency (at least partially motivated by the recent apparent lightening of sanctions pressures) is onerous for all exporters. All these negative factors combined make us to believe that the entire Russian O&G sector is vulnerable to downward repricing, unless oil prices recover back to USD 6570/bbl. This is the key risk to our investment case for the sector.
Dmitry Loukashov, CFA, Equities Analyst
+7 495 663 46 34 // dmitry.loukashov@vtbcapital.com
Ekaterina Rodina, Equities Analyst
+7 495 663 47 33 // ekaterina.rodina@vtbcapital.com
Alexander Donskoy, Equities Analyst
+7 495 660 67 88 // alexander.donskoy@vtbcapital.com
Artur Muradyants, Equity analyst
+7 495 663 46 38 // artur.muradyants@vtbcapital.com
Aydar Safin, Equities Analyst
+7 495 663 46 32 // aydar.safin@vtbcapital.com
Prices cited in the body of this report are as of the last close before, or the close on, 19 Dec 2018 (except where indicated otherwise). VTB Capital analysts update their recommendations periodically as required. This research report was prepared by the analyst(s) named above who is(are) associated with JSC VTB Capital and is distributed by JSC VTB Capital and VTB Capital PLC and their non-U.S. affiliates outside the United States. This VTB Capital research report is distributed to investors located within United States by Xtellus Capital Partners, Inc. (“Xtellus”) as a “third-party research report” as defined in Rule 2241(a)(14) and Rule 2242(a)(17) of the U.S. Financial Industry Regulatory Authority. Please refer to the Disclosures section of this report for other important disclosures, including the analyst certification and information required by regulation.

vk.com/id446425943 |
Russian Oil and Gas |
|
|
|
|
|
||
|
Russia |
|
|
|
|
|
|
|
|
Energy: Integrated Oil & Gas |
|
|
|
|
|
|
|
|
Companies Stocks mentioned |
|
|
|
|
|
|
|
|
Stock |
Rec. |
Rec. (previous) |
12mo Target |
Last |
ETR |
Upside |
DY, next |
|
|
|
|
Price |
Price |
|
|
12mo |
|
Tatneft DRs |
Sell |
Hold |
42.00 |
62.66 |
-28% |
-33% |
5% |
|
(ATAD LI,USD) |
(13 Nov 2018, 06:11 UTC) |
(19 Feb 2018, 05:02 UTC) |
|
|
|
|
|
|
Gazprom Neft DRs |
Sell |
Hold |
23.50 |
25.50 |
0% |
-8% |
8% |
|
(GAZ LI,USD) |
(from Hold) |
(13 Nov 2018, 06:11 UTC ) |
|
|
|
|
|
|
Gazprom ords |
Hold |
Buy |
2.30 |
2.27 |
8% |
1% |
7% |
|
(GAZP RX,USD) |
(from Buy) |
(19 Feb 2018, 05:02 UTC ) |
|
|
|
|
|
|
Lukoil DRs |
Hold |
Buy |
71.00 |
72.16 |
3% |
-2% |
5% |
|
(LKOD LI,USD) |
(13 Nov 2018, 06:11 UTC) |
(12 Jan 2018, 13:01 UTC) |
|
|
|
|
|
|
Lukoil ords |
Hold |
Buy |
71.00 |
72.82 |
2% |
-2% |
5% |
|
(LKOH RX,USD) |
(13 Nov 2018, 06:11 UTC) |
(12 Jan 2018, 13:01 UTC) |
|
|
|
|
|
|
Gazprom DRs |
Hold |
Buy |
4.60 |
4.49 |
9% |
3% |
7% |
|
(OGZD LI,USD) |
(from Buy) |
(19 Feb 2018, 05:02 UTC ) |
|
|
|
|
|
|
Gazprom Neft ords |
Sell |
Hold |
4.70 |
5.20 |
-2% |
-10% |
8% |
|
(SIBN RX,USD) |
(from Hold) |
(13 Nov 2018, 06:11 UTC ) |
|
|
|
|
|
|
Surgutneftegas ords |
Sell |
Hold |
0.36 |
0.41 |
-11% |
-13% |
2% |
|
(SNGS RX,USD) |
(from Hold) |
(8 Oct 2018, 06:10 UTC ) |
|
|
|
|
|
|
Surgutneftegas prefs |
Hold |
Buy |
0.55 |
0.58 |
11% |
-5% |
17% |
|
(SNGSP RX,USD) |
(from Buy) |
(23 Mar 2017, 12:03 UTC ) |
|
|
|
|
|
|
Tatneft ords |
Sell |
Hold |
7.00 |
10.59 |
-29% |
-34% |
5% |
|
(TATN RX,USD) |
(13 Nov 2018, 06:11 UTC) |
(19 Feb 2018, 05:02 UTC) |
|
|
|
|
|
|
Tatneft prefs |
Hold |
Buy |
8.20 |
7.42 |
18% |
11% |
7% |
|
(TATNP RX,USD) |
(from Buy) |
(30 Mar 2018, 06:03 UTC ) |
|
|
|
|
|
Source: Company data, Bloomberg, VTB Capital Research
Figure 1: Brent Futures Curve
USD/bbl
73
71
69
67
65
63
61
59
57
55
Feb-19 Apr-19 Jun-19 Aug-19 Oct-19 Dec-19 Feb-20 Apr-20 Jun-20 Aug-20 Oct-20 Dec-20 |
Feb-21 Apr-21 Jun-21 Aug-21 Oct-21 Dec-21 Feb-22 Apr-22 Jun-22 Aug-22 Oct-22 Dec-22 Feb-23 |
Brent Futures Curve (18 December) |
Brent Futures Curve (8 Nov) |
Source: Bloomberg, VTB Capital Research
21 December 2018 |
2 |
vk.com/id446425943
Russia
Energy: Integrated Oil & Gas
VTB Capital Facts & Forecasts
Russia
Energy / Integrated Oil & Gas
Gazprom
Prices as of: 19 December 2018
Ticker |
CCY |
Current |
12mo TP |
Rating |
GAZP RX |
USD |
2.27 |
2.30 |
Hold |
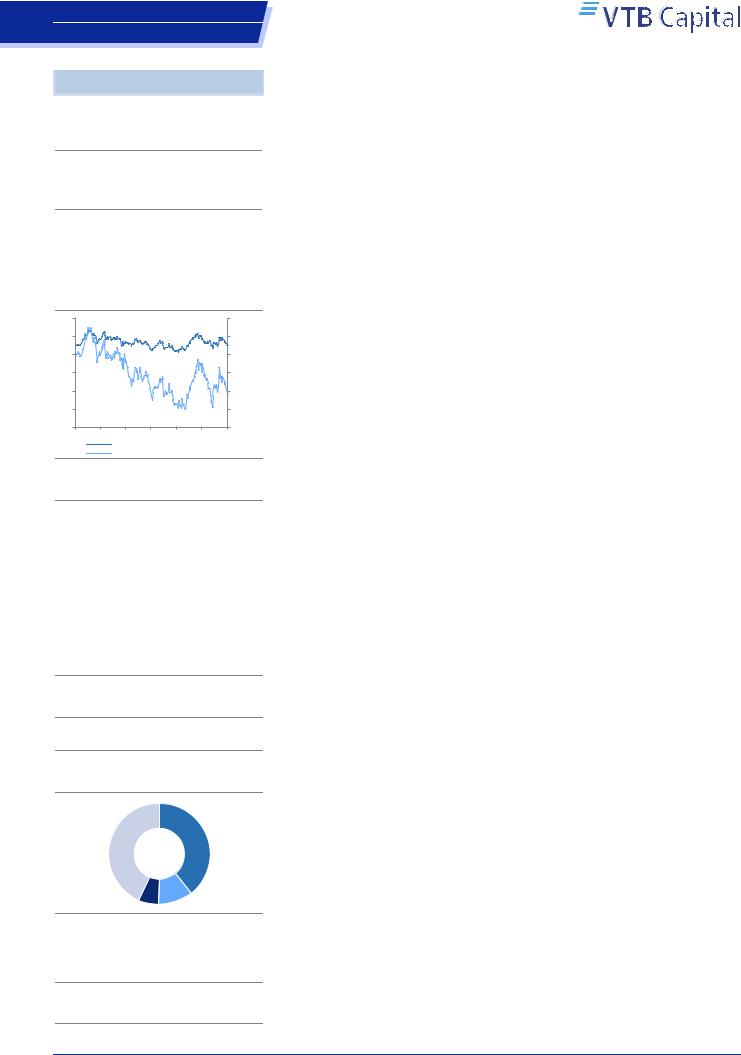
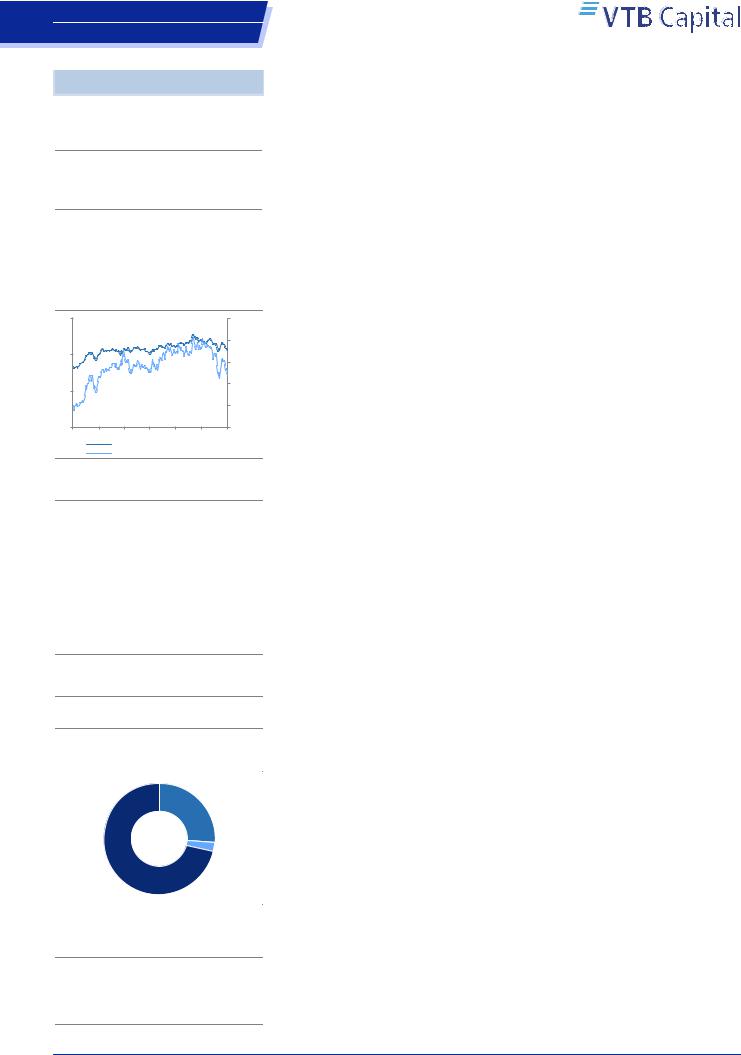
Share price performance, 12-mo
3 |
10% |
2.5 |
5% |
2 |
0% |
1.5 |
-5% |
1 |
-10% |
0.5 |
-15% |
0 |
-20% |
Dec Feb Apr Jun Aug Oct Dec
GAZP RX, USD, lhs
Relative to MOEX Index, %, rhs
Company description
Gazprom, Russia's largest gas producer, is controlled by the Russian state. The company accounts for 17% of the world's gas reserves and 72% of Russian gas reserves, producing 12% of all gas worldwide and 68% of that in Russia. In addition, it operates the world's largest gas transmission system. In 2017, the company exported 55% of its gas to Europe and FSU countries, with the other 45% being sold domestically. Apart from the gas business, Gazprom owns 95.7% of Gazprom Neft, one of the largest integrated oil companies in Russia. By the end of the 2000s, it had also gained control over a number of electricity and heat generating companies (Mosenergo, TGK 1 and OGK 2).
Company website
http://www.gazprom.com/
Shareholder structure
Other/Free |
Federal |
|
Agency for |
||
float |
State Property |
|
43% |
Management |
|
|
39% |
|
Treasury |
Rosneftegaz |
|
11% |
||
shares |
||
7% |
|
Source: Company data, VTB Capital Research
Research team
Ekaterina Rodina / +7 495 663 47 33
Aydar Safin / +7 495 663 46 32
Artur Muradyants / +7 495 663 46 38
Russian Oil and Gas
Last model update on: 21 December 2018
|
IFRS |
2016 |
2017 |
2018F |
2019F |
2020F |
|
2021F |
||
|
Company data |
|
|
|
|
|
|
|
|
|
|
Weighted avg # shares, mn |
|
23,674 |
23,674 |
23,674 |
23,674 |
23,674 |
|
23,674 |
|
|
Avg market cap, USD mn |
48,645 |
48,893 |
52,137 |
52,137 |
52,137 |
52,137 |
|
||
|
EV, USD mn |
80,265 |
89,927 |
91,250 |
90,039 |
82,809 |
80,341 |
|
||
|
Ratios & analysis |
|
|
|
|
|
|
|
|
|
|
P/E, x |
|
3.6x |
4.3x |
2.5x |
2.6x |
2.4x |
|
2.5x |
|
|
EV/EBITDA, x |
4.3x |
3.7x |
2.4x |
2.7x |
2.2x |
|
2.3x |
||
|
P/B, x |
|
0.3x |
0.3x |
0.3x |
0.2x |
0.2x |
|
0.2x |
|
|
FCF yield, % |
5.9% |
-7.2% |
8.9% |
7.9% |
21.2% |
15.2% |
|
||
|
Dividend yield (ords), % |
6.4% |
5.8% |
6.1% |
8.3% |
11.3% |
10.6% |
|
||
|
Dividend yield (prefs), % |
|
|
|
|
|
|
|
|
|
|
EPS(ords), USD |
0.60 |
0.52 |
0.92 |
0.88 |
0.96 |
0.90 |
|
||
|
CFPS, USD |
0.99 |
0.86 |
1.52 |
1.41 |
1.52 |
1.50 |
|
||
|
Free CFPS, USD |
0.13 |
(0.16) |
0.20 |
0.18 |
0.48 |
0.34 |
|
||
|
DPS (ords), USD |
0.14 |
0.13 |
0.14 |
0.19 |
0.26 |
0.24 |
|
||
|
Payout ratio (ords), % |
22.0% |
23.2% |
14.1% |
20.0% |
25.0% |
25.0% |
|
||
|
BPS(ords), USD |
7.97 |
8.81 |
8.82 |
9.63 |
10.47 |
11.17 |
|
||
|
Revenues growth, % |
|
-9% |
23% |
16% |
-7% |
4% |
|
0% |
|
|
EBITDA, chg |
|
-32% |
31% |
51% |
-11% |
11% |
|
-4% |
|
|
EPS growth, % |
|
10% |
-14% |
77% |
-4% |
9% |
|
-7% |
|
|
EBIT margin, % |
12% |
13% |
22% |
20% |
20% |
19% |
|
||
|
EBITDA margin, % |
21.2% |
22.7% |
29.5% |
28.3% |
30.3% |
28.8% |
|
||
|
Net margin, % |
15.6% |
10.9% |
16.6% |
17.2% |
18.1% |
16.8% |
|
||
|
ROE, % |
7.8% |
6.1% |
10.8% |
9.5% |
9.6% |
8.4% |
|
||
|
ROIC, % |
2.7% |
3.8% |
8.4% |
6.4% |
6.7% |
5.8% |
|
||
|
Capex/Revenues, % |
22% |
21% |
24% |
24% |
20% |
22% |
|
||
|
Capex/Depreciation, x |
2.4x |
2.3x |
3.1x |
2.7x |
2.0x |
|
2.1x |
||
|
Net debt/Equity, % |
17% |
20% |
19% |
17% |
12% |
11% |
|
||
|
Net debt/EBITDA, x |
1.6x |
1.6x |
1.0x |
1.1x |
0.8x |
|
0.8x |
||
|
Net interest cover, x |
10.1x |
16.3x |
36.2x |
32.4x |
35.3x |
|
32.1x |
||
|
Income statement summary, USD mn |
|
|
|
|
|
|
|
|
|
|
Revenues |
91,122 |
112,183 |
130,344 |
120,968 |
125,901 |
126,464 |
|
||
|
Cost of sales |
(71,780) |
(86,755) |
(91,934) |
(86,687) |
(87,808) |
(90,073) |
|
||
|
SG&A and other opexp. |
|
|
|
|
|
|
|
|
|
|
EBITDA |
19,342 |
25,428 |
38,410 |
34,281 |
38,093 |
36,391 |
|
||
|
Depreciation & amortization |
|
(8,523) |
(10,508) |
(10,128) |
(10,630) |
(12,344) |
|
(12,989) |
|
|
Operating profit |
10,819 |
14,920 |
28,282 |
23,651 |
25,749 |
23,402 |
|
||
|
Non-operating gains /(exp.) |
|
6,781 |
(170) |
(3,907) |
(348) |
0 |
|
0 |
|
|
EBIT |
10,819 |
14,920 |
28,282 |
23,651 |
25,749 |
23,402 |
|
||
|
Net interest income/(exp.) |
327 |
521 |
331 |
310 |
367 |
695 |
|
||
|
Profit before tax |
19,163 |
17,446 |
27,956 |
26,862 |
29,366 |
27,347 |
|
||
|
Income tax |
(4,295) |
(4,304) |
(5,170) |
(4,968) |
(5,431) |
(5,057) |
|
||
|
Minority interests |
(678) |
(901) |
(1,088) |
(1,046) |
(1,143) |
(1,064) |
|
||
|
Net income |
14,190 |
12,241 |
21,698 |
20,849 |
22,792 |
21,225 |
|
||
|
Cash flow statement summary, USD mn |
|
|
|
|
|
|
|
|
|
|
Cash flow from operations |
23,430 |
20,342 |
36,041 |
33,349 |
36,003 |
35,600 |
|
||
|
Working capital changes |
2,725 |
(697) |
- |
477 |
(276) |
321 |
|
||
|
Capex |
(20,414) |
(24,091) |
(31,245) |
(29,088) |
(24,603) |
(27,434) |
|
||
|
Other investing activities |
(2,352) |
1,042 |
(439) |
- |
- |
- |
|
||
|
Free cash flow |
3,016 |
(3,749) |
4,797 |
4,261 |
11,399 |
8,166 |
|
||
|
Dividends paid |
(2,778) |
(3,288) |
(2,842) |
(3,050) |
(4,170) |
(5,698) |
|
||
|
Net change in borrowings |
303 |
7,138 |
(1,574) |
- |
- |
- |
|
||
|
Other financing cash flow |
(4,391) |
(1,280) |
22 |
- |
- |
- |
|
||
|
Movement in cash |
|
(6,894) |
(475) |
1,469 |
1,211 |
7,230 |
|
2,468 |
|
|
Balance sheet summary, USD mn |
|
|
|
|
|
|
|
|
|
|
Cash and equivalents |
14,841 |
15,138 |
13,482 |
14,693 |
21,923 |
24,391 |
|
||
|
PP&E |
189,636 |
217,796 |
213,114 |
231,572 |
243,831 |
258,276 |
|
||
|
Goodwill |
1,736 |
1,831 |
1,639 |
1,639 |
1,639 |
1,639 |
|
||
|
Investments |
12,227 |
15,599 |
16,456 |
16,456 |
16,456 |
16,456 |
|
||
|
Other assets |
|
60,488 |
66,280 |
67,688 |
65,635 |
66,405 |
|
66,889 |
|
|
Total assets |
|
278,928 |
316,644 |
312,378 |
329,995 |
350,253 |
|
367,650 |
|
|
Interest bearing debt |
|
46,650 |
56,710 |
53,549 |
53,549 |
53,549 |
|
53,549 |
|
|
Other liabilities |
43,647 |
51,333 |
50,035 |
48,459 |
48,952 |
49,757 |
|
||
|
Total liabilities |
90,296 |
108,043 |
103,584 |
102,008 |
102,501 |
103,307 |
|
||
|
Total shareholder's equity |
182,906 |
201,893 |
201,617 |
219,764 |
238,386 |
253,913 |
|
||
|
Minority interest |
5,726 |
6,708 |
7,177 |
8,223 |
9,366 |
10,430 |
|
||
|
Net working capital |
9,878 |
8,973 |
7,195 |
6,619 |
7,077 |
6,932 |
|
||
|
Net Debt |
31,620 |
41,033 |
39,113 |
37,902 |
30,672 |
28,204 |
|
||
|
Capital |
229,556 |
258,603 |
255,166 |
273,313 |
291,935 |
307,462 |
|
||
|
|
|
|
|
|
|
|
|
|
|
21 December 2018 |
3 |
vk.com/id446425943
Russia
Energy: Integrated Oil & Gas
VTB Capital Facts & Forecasts
Russia
Energy / Integrated Oil & Gas
Gazprom Neft
Prices as of: 19 December 2018
Ticker |
CCY |
Current |
12mo TP |
Rating |
SIBN RX |
USD |
5.20 |
4.70 |
Sell |
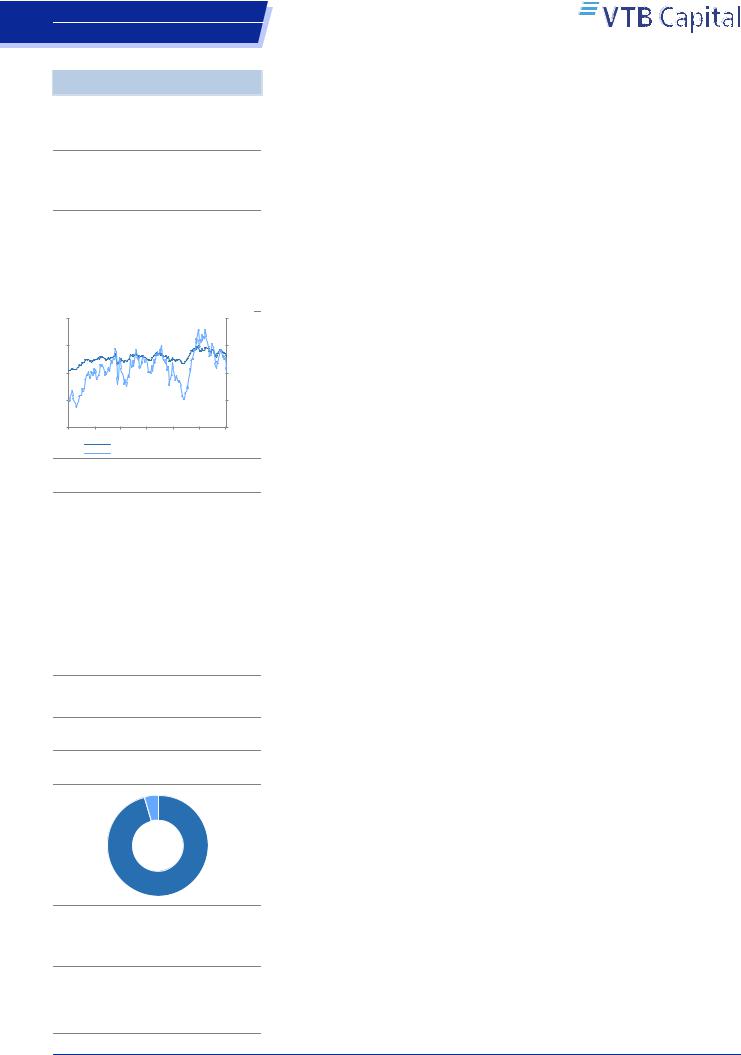
Share price performance, 12-mo
8 |
30% |
6 |
20% |
4 |
10% |
2 |
0% |
0 |
-10% |
Dec Feb Apr Jun Aug Oct Dec
SIBN RX, USD, lhs
Relative to MOEX Index, %, rhs
Company description
Gazprom Neft is the fourth largest oil producer in Russia. The company's proved oil reserves, according to SPE-PRMS standards, stand at 2.78bn toe, which implies almost 14 years of crude production (R/P ratio), well above global oil majors. The main upstream assets are located in Western Siberia. In 2017, the company (excluding joint ventures) produced 49.65mmt of liquids, a YoY increase of 4.1% even within the framework of the OPEC+ limitations. The main drivers of the continuing production ramp up were the Novoportovskoye and Prirazlomnoye greenfields, which together produced 8.6mmt of liquids last year, up 69% YoY. The company's main oil processing asset, the 21.6mmt/a Omsk Oil Refinery, is one of the most advanced oil refineries in Russia. In 2017, Gazprom Neft refined 40.1mmt of crude oil, down 4.2% on the year before.
Company website
http://www.gazprom-neft.com/
Shareholder structure
Free float 4%
Gazprom
96%
Source: Company data, VTB Capital Research
Research team
Dmitry Loukashov, CFA / +7 495 663 46 34
Ekaterina Rodina / +7 495 663 47 33
Alexander Donskoy / +7 495 660 67 88
Aydar Safin / +7 495 663 46 32
Artur Muradyants / +7 495 663 46 38
Russian Oil and Gas
Last model update on: 21 December 2018
|
IFRS |
2016 |
2017 |
2018F |
2019F |
2020F |
|
2021F |
||
|
Company data |
|
|
|
|
|
|
|
|
|
|
Weighted avg # shares, mn |
4,718 |
4,718 |
4,718 |
4,718 |
4,718 |
4,718 |
|
||
|
Avg market cap, USD mn |
11,847 |
17,587 |
24,660 |
24,660 |
24,660 |
24,660 |
|
||
|
EV, USD mn |
21,750 |
27,646 |
33,089 |
33,025 |
31,664 |
30,053 |
|
||
|
Ratios & analysis |
|
|
|
|
|
|
|
|
|
|
P/E, x |
4.0x |
4.1x |
4.1x |
4.2x |
3.5x |
|
3.3x |
||
|
EV/EBITDA, x |
4.0x |
3.6x |
3.3x |
3.6x |
3.1x |
|
2.8x |
||
|
P/B, x |
0.5x |
0.6x |
0.7x |
0.6x |
0.5x |
|
0.5x |
||
|
FCF yield, % |
-7.9% |
6.5% |
11.2% |
8.2% |
13.7% |
16.5% |
|
||
|
Dividend yield (ords), % |
7.3% |
6.4% |
8.0% |
8.2% |
9.9% |
10.4% |
|
||
|
Dividend yield (prefs), % |
|
|
|
|
|
|
|
|
|
|
EPS(ords), USD |
0.63 |
0.92 |
1.27 |
1.22 |
1.48 |
1.56 |
|
||
|
CFPS, USD |
1.02 |
1.53 |
1.71 |
1.57 |
1.78 |
1.83 |
|
||
|
Free CFPS, USD |
|
(0.20) |
0.24 |
0.58 |
0.43 |
0.72 |
|
0.86 |
|
|
DPS (ords), USD |
|
0.18 |
0.24 |
0.41 |
0.43 |
0.52 |
|
0.54 |
|
|
Payout ratio (ords), % |
|
28.9% |
26.0% |
32.6% |
34.8% |
34.8% |
|
34.8% |
|
|
BPS(ords), USD |
|
5.05 |
6.11 |
7.58 |
8.73 |
10.09 |
|
11.40 |
|
|
Revenues growth, % |
|
-7% |
36% |
19% |
-11% |
5% |
|
3% |
|
|
EBITDA, chg |
9% |
38% |
31% |
-9% |
13% |
3% |
|
||
|
EPS growth, % |
66% |
45% |
38% |
-4% |
21% |
5% |
|
||
|
EBIT margin, % |
14% |
15% |
18% |
17% |
20% |
21% |
|
||
|
EBITDA margin, % |
21.7% |
22.1% |
24.4% |
24.8% |
26.7% |
26.7% |
|
||
|
Net margin, % |
11.8% |
12.6% |
14.7% |
15.8% |
18.3% |
18.7% |
|
||
|
ROE, % |
13.3% |
16.1% |
17.9% |
15.0% |
15.7% |
14.6% |
|
||
|
ROIC, % |
7.1% |
9.0% |
10.8% |
8.5% |
10.2% |
10.1% |
|
||
|
Capex/Revenues, % |
23% |
18% |
13% |
15% |
13% |
12% |
|
||
|
Capex/Depreciation, x |
3.0x |
2.5x |
1.9x |
1.9x |
2.0x |
|
1.9x |
||
|
Net debt/Equity, % |
|
42% |
35% |
24% |
20% |
15% |
|
10% |
|
|
Net debt/EBITDA, x |
1.8x |
1.3x |
0.8x |
0.9x |
0.7x |
|
0.5x |
||
|
Net interest cover, x |
|
|
|
|
|
|
|
|
|
|
Income statement summary, USD mn |
|
|
|
|
|
|
|
|
|
|
Revenues |
25,286 |
34,336 |
40,843 |
36,467 |
38,211 |
39,425 |
|
||
|
Cost of sales |
(18,153) |
(24,891) |
(28,983) |
(25,637) |
(26,145) |
(26,971) |
|
||
|
SG&A and other opexp. |
|
(1,643) |
(1,844) |
(1,896) |
(1,792) |
(1,859) |
|
(1,910) |
|
|
EBITDA |
5,490 |
7,601 |
9,964 |
9,038 |
10,207 |
10,544 |
|
||
|
Depreciation & amortization |
(1,936) |
(2,416) |
(2,801) |
(2,904) |
(2,572) |
(2,418) |
|
||
|
Operating profit |
3,554 |
5,184 |
7,163 |
6,134 |
7,635 |
8,126 |
|
||
|
Non-operating gains /(exp.) |
154 |
(134) |
(603) |
(178) |
(201) |
(201) |
|
||
|
EBIT |
3,554 |
5,184 |
7,163 |
6,134 |
7,635 |
8,126 |
|
||
|
Net interest income/(exp.) |
(346) |
(258) |
(230) |
(108) |
(196) |
(196) |
|
||
|
Profit before tax |
3,870 |
5,573 |
7,883 |
7,401 |
8,791 |
9,282 |
|
||
|
Income tax |
(743) |
(951) |
(1,507) |
(1,248) |
(1,334) |
(1,448) |
|
||
|
Minority interests |
(142) |
(281) |
(388) |
(374) |
(454) |
(477) |
|
||
|
Net income |
|
2,985 |
4,340 |
5,988 |
5,778 |
7,003 |
|
7,357 |
|
|
Cash flow statement summary, USD mn |
|
|
|
|
|
|
|
|
|
|
Cash flow from operations |
4,791 |
7,227 |
8,069 |
7,416 |
8,419 |
8,619 |
|
||
|
Working capital changes |
227 |
905 |
- |
- |
- |
- |
|
||
|
Capex |
(5,738) |
(6,120) |
(5,310) |
(5,397) |
(5,046) |
(4,569) |
|
||
|
Other investing activities |
924 |
854 |
- |
- |
- |
- |
|
||
|
Free cash flow |
|
(932) |
1,145 |
2,759 |
2,019 |
3,373 |
|
4,050 |
|
|
Dividends paid |
|
(57) |
(907) |
(1,131) |
(1,954) |
(2,012) |
|
(2,439) |
|
|
Net change in borrowings |
|
(953) |
61 |
|
|
|
|
|
|
|
Other financing cash flow |
|
(10) |
(20) |
|
|
|
|
|
|
|
Movement in cash |
|
(1,201) |
977 |
1,629 |
64 |
1,361 |
|
1,611 |
|
|
Balance sheet summary, USD mn |
|
|
|
|
|
|
|
|
|
|
Cash and equivalents |
|
554 |
1,573 |
3,202 |
3,266 |
4,627 |
|
6,238 |
|
|
PP&E |
|
28,461 |
35,630 |
40,940 |
46,337 |
51,383 |
|
55,952 |
|
|
Goodwill |
|
1,157 |
1,288 |
1,288 |
1,288 |
1,288 |
|
1,288 |
|
|
Investments |
694 |
181 |
181 |
181 |
181 |
181 |
|
||
|
Other assets |
11,154 |
12,196 |
12,196 |
12,196 |
12,196 |
12,196 |
|
||
|
Total assets |
42,020 |
50,868 |
57,807 |
63,268 |
69,675 |
75,855 |
|
||
|
Interest bearing debt |
11,151 |
11,813 |
11,812 |
11,812 |
11,812 |
11,812 |
|
||
|
Other liabilities |
7,060 |
10,251 |
10,252 |
10,252 |
10,252 |
10,252 |
|
||
|
Total liabilities |
18,211 |
22,064 |
22,064 |
22,064 |
22,064 |
22,064 |
|
||
|
Total shareholder's equity |
22,424 |
26,966 |
33,517 |
38,604 |
44,557 |
50,260 |
|
||
|
Minority interest |
1,385 |
1,838 |
2,226 |
2,600 |
3,054 |
3,531 |
|
||
|
Net working capital |
1,989 |
454 |
453 |
453 |
453 |
453 |
|
||
|
Net Debt |
9,903 |
10,058 |
8,429 |
8,365 |
7,004 |
5,393 |
|
||
|
Capital |
33,575 |
38,779 |
45,329 |
50,416 |
56,369 |
62,072 |
|
||
|
|
|
|
|
|
|
|
|
|
|
21 December 2018 |
4 |
vk.com/id446425943
Russia
Energy: Integrated Oil & Gas
VTB Capital Facts & Forecasts
Russia
Energy / Integrated Oil & Gas
Lukoil
Prices as of: 19 December 2018
Ticker |
CCY |
Current |
12mo TP |
Rating |
LKOH RX |
USD |
72.82 |
71.00 |
Hold |
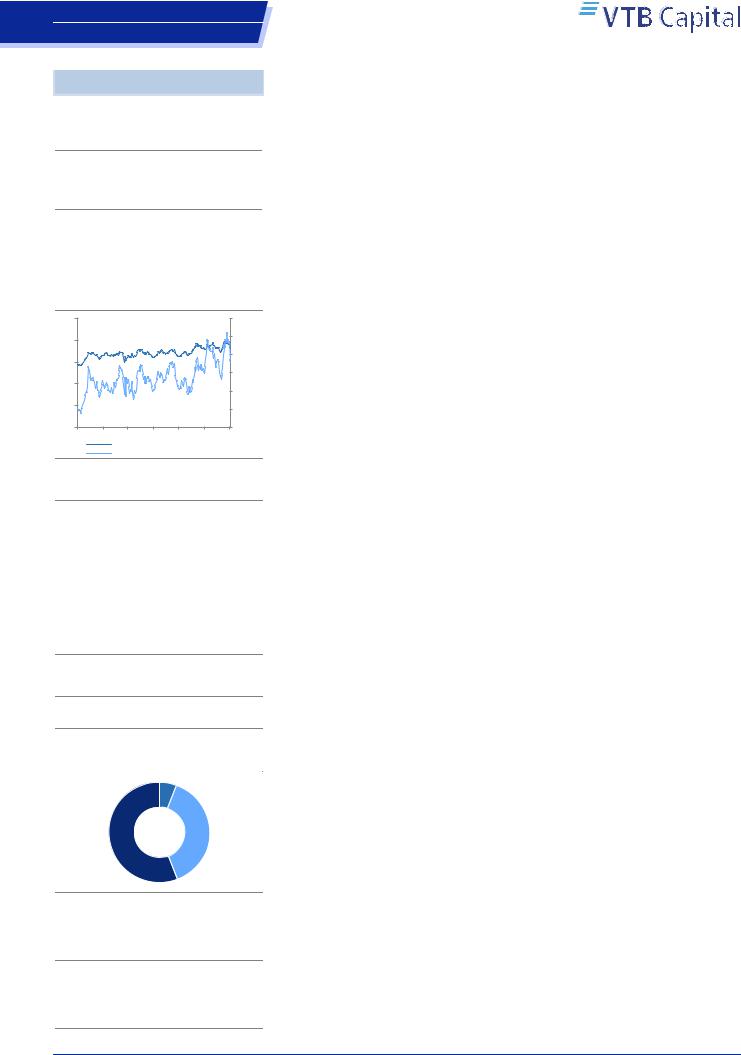
Share price performance, 12-mo
100 |
25% |
80 |
20% |
|
|
60 |
15% |
|
|
|
10% |
40 |
5% |
|
|
20 |
0% |
|
|
0 |
-5% |
Dec Feb Apr Jun Aug Oct Dec
LKOH RX, USD, lhs
Relative to MOEX Index, %, rhs
Company description
Lukoil is Russia's largest non-state-owned integrated oil and gas company. In 2017, it produced 84.8mmt (down 5% YoY) of crude oil (including oil produced within international projects) which makes it the second largest oil producer in Russia. Refining occurs in Russia (in the Central region and Timano-Pechora) and abroad (Romania, Bulgaria, Italy and the Netherlands). The company's total proved reserves of crude amounted to 12bn bbl according to SEC standards as of the end of 2017, thus representing a robust 19 years of liquids reserves life. Total refining in 2017 was 73.8mmt (up 11% YoY).
Company website
http://www.lukoil.com/
Shareholder structure
Treasury shares 5%
Management of the company 39%
Other/Free float 56%
Source: Company data, VTB Capital Research
Research team
Dmitry Loukashov, CFA / +7 495 663 46 34
Ekaterina Rodina / +7 495 663 47 33
Alexander Donskoy / +7 495 660 67 88
Aydar Safin / +7 495 663 46 32
Artur Muradyants / +7 495 663 46 38
Russian Oil and Gas
Last model update on: 21 December 2018
|
IFRS |
2016 |
2017 |
2018F |
2019F |
2020F |
|
2021F |
||
|
Company data |
|
|
|
|
|
|
|
|
|
|
Weighted avg # shares, mn |
|
850.6 |
850.6 |
750.6 |
750.6 |
750.6 |
|
750.6 |
|
|
Avg market cap, USD mn |
30,536 |
37,177 |
51,675 |
51,675 |
51,675 |
51,675 |
|
||
|
EV, USD mn |
37,465 |
41,802 |
52,883 |
52,284 |
50,552 |
48,885 |
|
||
|
Ratios & analysis |
|
|
|
|
|
|
|
|
|
|
P/E, x |
|
11.8x |
6.2x |
5.5x |
8.7x |
7.3x |
|
7.0x |
|
|
EV/EBITDA, x |
4.0x |
3.4x |
3.1x |
4.1x |
3.6x |
|
3.4x |
||
|
P/B, x |
|
0.7x |
0.7x |
0.8x |
0.7x |
0.6x |
|
0.5x |
|
|
FCF yield, % |
10.5% |
9.6% |
12.6% |
6.8% |
8.5% |
8.6% |
|
||
|
Dividend yield (ords), % |
7.8% |
6.6% |
4.6% |
4.8% |
5.0% |
5.2% |
|
||
|
Dividend yield (prefs), % |
|
|
|
|
|
|
|
|
|
|
EPS(ords), USD |
3.63 |
8.44 |
13.36 |
8.39 |
9.96 |
10.38 |
|
||
|
CFPS, USD |
13.19 |
15.28 |
20.16 |
15.60 |
16.90 |
17.40 |
|
||
|
Free CFPS, USD |
4.51 |
5.01 |
9.21 |
4.93 |
6.19 |
6.25 |
|
||
|
DPS (ords), USD |
3.34 |
3.43 |
3.37 |
3.50 |
3.65 |
3.80 |
|
||
|
Payout ratio (ords), % |
77.3% |
34.0% |
23.8% |
39.5% |
34.7% |
34.6% |
|
||
|
BPS(ords), USD |
62.56 |
71.24 |
96.25 |
107.7 |
120.7 |
134.1 |
|
||
|
Revenues growth, % |
|
-17% |
31% |
26% |
-19% |
2% |
|
3% |
|
|
EBITDA, chg |
|
-19% |
31% |
27% |
-25% |
8% |
|
4% |
|
|
EPS growth, % |
|
-35% |
133% |
58% |
-37% |
19% |
|
4% |
|
|
EBIT margin, % |
8% |
9% |
10% |
8% |
9% |
9% |
|
||
|
EBITDA margin, % |
14.0% |
14.0% |
14.1% |
13.1% |
13.9% |
14.1% |
|
||
|
Net margin, % |
4.0% |
7.1% |
7.8% |
6.1% |
7.1% |
7.2% |
|
||
|
ROE, % |
5.8% |
11.9% |
13.9% |
7.8% |
8.3% |
7.8% |
|
||
|
ROIC, % |
7.0% |
8.5% |
10.8% |
6.6% |
6.9% |
6.7% |
|
||
|
Capex/Revenues, % |
10% |
9% |
6% |
8% |
8% |
8% |
|
||
|
Capex/Depreciation, x |
1.6x |
1.6x |
1.5x |
1.5x |
1.5x |
|
1.6x |
||
|
Net debt/Equity, % |
13% |
8% |
2% |
1% |
-1% |
-3% |
|
||
|
Net debt/EBITDA, x |
0.6x |
0.3x |
0.1x |
0.0x |
(0.1x) |
|
(0.2x) |
||
|
Net interest cover, x |
8.9x |
18.5x |
22.1x |
14.5x |
32.9x |
|
34.8x |
||
|
Income statement summary, USD mn |
|
|
|
|
|
|
|
|
|
|
Revenues |
77,941 |
101,739 |
128,406 |
103,393 |
105,711 |
108,671 |
|
||
|
Cost of sales |
(64,120) |
(84,655) |
(107,611) |
(87,222) |
(88,313) |
(90,532) |
|
||
|
SG&A and other opexp. |
(2,925) |
(2,833) |
(2,660) |
(2,616) |
(2,707) |
(2,841) |
|
||
|
EBITDA |
10,896 |
14,251 |
18,135 |
13,555 |
14,691 |
15,298 |
|
||
|
Depreciation & amortization |
|
(4,646) |
(5,571) |
(5,487) |
(5,211) |
(5,271) |
|
(5,333) |
|
|
Operating profit |
6,250 |
8,680 |
12,648 |
8,344 |
9,420 |
9,965 |
|
||
|
Non-operating gains /(exp.) |
|
(1,824) |
223 |
223 |
(306) |
(333) |
|
(333) |
|
|
EBIT |
6,250 |
8,680 |
12,648 |
8,344 |
9,420 |
9,965 |
|
||
|
Net interest income/(exp.) |
(481) |
(209) |
(278) |
(170) |
177 |
177 |
|
||
|
Profit before tax |
4,063 |
8,983 |
12,966 |
8,217 |
9,613 |
10,158 |
|
||
|
Income tax |
(967) |
(1,778) |
(2,899) |
(1,897) |
(2,111) |
(2,339) |
|
||
|
Minority interests |
(13) |
(28) |
(39) |
(24) |
(29) |
(30) |
|
||
|
Net income |
3,084 |
7,177 |
10,028 |
6,295 |
7,473 |
7,789 |
|
||
|
Cash flow statement summary, USD mn |
|
|
|
|
|
|
|
|
|
|
Cash flow from operations |
11,217 |
12,998 |
15,134 |
11,707 |
12,682 |
13,060 |
|
||
|
Working capital changes |
749 |
(428) |
|
|
|
|
|
|
|
|
Capex |
(7,413) |
(8,766) |
(8,224) |
(8,003) |
(8,034) |
(8,365) |
|
||
|
Other investing activities |
(299) |
(112) |
- |
- |
- |
- |
|
||
|
Free cash flow |
3,835 |
4,261 |
6,910 |
3,704 |
4,648 |
4,695 |
|
||
|
Share issue (reacquisition) |
|
(162) |
|
|
|
|
|
|
|
|
Dividends paid |
(1,949) |
(2,425) |
(2,921) |
(2,528) |
(2,630) |
(2,742) |
|
||
|
Net change in borrowings |
(175) |
(987) |
|
|
|
|
|
|
|
|
Other financing cash flow |
|
(755) |
(665) |
(571) |
(576) |
(286) |
|
(286) |
|
|
Movement in cash |
|
61 |
1,183 |
3,417 |
599 |
1,732 |
|
1,667 |
|
|
Balance sheet summary, USD mn |
|
|
|
|
|
|
|
|
|
|
Cash and equivalents |
4,309 |
5,736 |
9,153 |
9,753 |
11,484 |
13,151 |
|
||
|
PP&E |
55,911 |
62,069 |
70,293 |
78,296 |
86,330 |
94,695 |
|
||
|
Goodwill |
711 |
717 |
717 |
717 |
717 |
717 |
|
||
|
Investments |
|
2,957 |
3,192 |
3,192 |
3,192 |
3,192 |
|
3,192 |
|
|
Other assets |
|
18,785 |
19,019 |
19,019 |
19,019 |
19,019 |
|
19,019 |
|
|
Total assets |
|
82,673 |
90,733 |
102,374 |
110,977 |
120,742 |
|
130,774 |
|
|
Interest bearing debt |
11,517 |
10,701 |
10,701 |
10,701 |
10,701 |
10,701 |
|
||
|
Other liabilities |
17,944 |
19,435 |
19,435 |
19,435 |
19,435 |
19,435 |
|
||
|
Total liabilities |
29,461 |
30,136 |
30,136 |
30,136 |
30,136 |
30,136 |
|
||
|
Total shareholder's equity |
53,100 |
60,468 |
72,070 |
80,648 |
90,386 |
100,387 |
|
||
|
Minority interest |
112 |
129 |
168 |
192 |
221 |
251 |
|
||
|
Net working capital |
3,543 |
4,453 |
4,453 |
4,453 |
4,453 |
4,453 |
|
||
|
Net Debt |
6,929 |
4,625 |
1,208 |
608 |
(1,123) |
(2,790) |
|
||
|
Capital |
64,617 |
71,168 |
82,771 |
91,349 |
101,087 |
111,088 |
|
||
|
|
|
|
|
|
|
|
|
|
|
21 December 2018 |
5 |
vk.com/id446425943
Russia
Energy: Integrated Oil & Gas
VTB Capital Facts & Forecasts
Russia
Energy / Integrated Oil & Gas
Surgutneftegas
Prices as of: 19 December 2018
Ticker |
CCY |
Current |
12mo TP |
Rating |
SNGS RX |
USD |
0.41 |
0.36 |
Sell |
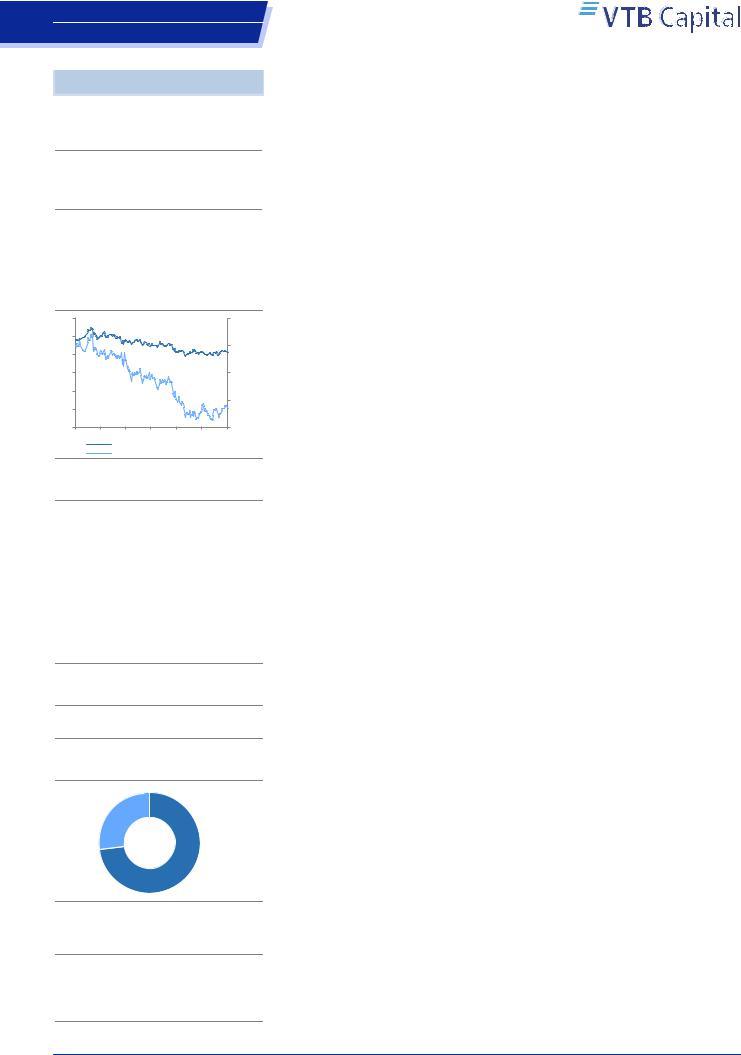
Share price performance, 12-mo
0.6 |
10% |
|
0.5 |
0% |
|
0.4 |
||
|
||
0.3 |
-10% |
|
0.2 |
-20% |
|
0.1 |
||
|
||
0 |
-30% |
Dec Feb Apr Jun Aug Oct Dec
SNGS RX, USD, lhs
Relative to MOEX Index, %, rhs
Company description
Surgutneftegas is the third largest publicly traded oil company in Russia in terms of consolidated production, with 60.5mnt crude output in 2017. It concentrates on developing conventional oil reserves in Western Siberia, which accounts for 85% of the company's total oil production. The decline in oil production at matured fields (2% annually on average) is compensated for by increasing production at the Talakanskoye group of greenfields (around 9mmt of oil this year, we estimate). As a result, Surgutneftegas' actual oil production CAGR has been close to zero since 2008, when Talakanskoye was launched, with average output of 1.2mmbd. Surgutneftegas also owns the Kirishi Oil Refinery, located in northwest Russia, which has total installed capacity of 20mmt per year.
Company website
http://www.surgutneftegas.ru/en/main/
Shareholder structure
Free float |
NCPs |
|
27% |
||
incorporated by |
||
|
||
|
Surgutneftegas |
|
|
73% |
Source: Company data, VTB Capital Research
Research team
Dmitry Loukashov, CFA / +7 495 663 46 34
Ekaterina Rodina / +7 495 663 47 33
Alexander Donskoy / +7 495 660 67 88
Aydar Safin / +7 495 663 46 32
Artur Muradyants / +7 495 663 46 38
Russian Oil and Gas
Last model update on: 21 December 2018
|
IFRS |
2016 |
2017 |
2018F |
2019F |
2020F |
|
2021F |
||
|
Company data |
|
|
|
|
|
|
|
|
|
|
Weighted avg # shares, mn |
|
43,428 |
43,428 |
43,428 |
43,428 |
43,428 |
|
43,428 |
|
|
Avg market cap, USD mn |
21,940 |
21,539 |
19,240 |
19,240 |
19,240 |
19,240 |
|
||
|
EV, USD mn |
13,653 |
6,230 |
2,412 |
2,150 |
1,309 |
193.0 |
|
||
|
Ratios & analysis |
|
|
|
|
|
|
|
|
|
|
P/E, x |
|
neg |
6.4x |
1.5x |
3.3x |
3.0x |
|
2.8x |
|
|
EV/EBITDA, x |
2.6x |
1.0x |
0.1x |
0.2x |
0.0x |
|
neg |
||
|
P/B, x |
|
0.4x |
0.3x |
0.3x |
0.3x |
0.2x |
|
0.2x |
|
|
FCF yield, % |
5.7% |
15.8% |
11.5% |
7.5% |
8.3% |
10.1% |
|
||
|
Dividend yield (ords), % |
2.1% |
2.1% |
2.3% |
2.2% |
2.2% |
2.2% |
|
||
|
Dividend yield (prefs), % |
1.9% |
4.2% |
16.8% |
7.6% |
8.4% |
9.0% |
|
||
|
EPS(ords), USD |
(0.021) |
0.077 |
0.28 |
0.13 |
0.14 |
0.15 |
|
||
|
CFPS, USD |
0.090 |
0.14 |
0.12 |
0.10 |
0.10 |
0.11 |
|
||
|
Free CFPS, USD |
0.028 |
0.078 |
0.047 |
0.031 |
0.035 |
0.042 |
|
||
|
DPS (ords), USD |
0.010 |
0.010 |
0.0096 |
0.0089 |
0.0089 |
0.0089 |
|
||
|
DPS (prefs) |
0.010 |
0.022 |
0.097 |
0.044 |
0.049 |
0.052 |
|
||
|
Payout ratio (ords), % |
n/a |
11.1% |
2.9% |
5.9% |
5.3% |
5.0% |
|
||
|
Payout ratio (prefs), % |
|
n/a |
5.1% |
6.3% |
6.2% |
6.3% |
|
6.3% |
|
|
BPS(ords), USD |
|
1.31 |
1.44 |
1.56 |
1.63 |
1.72 |
|
1.81 |
|
|
Revenues growth, % |
|
-7% |
32% |
25% |
-19% |
6% |
|
6% |
|
|
EBITDA, chg |
-2% |
15% |
39% |
-29% |
3% |
2% |
|
||
|
EPS growth, % |
-107% |
-460% |
259% |
-55% |
10% |
6% |
|
||
|
EBIT margin, % |
26% |
23% |
28% |
23% |
23% |
22% |
|
||
|
EBITDA margin, % |
33.1% |
28.8% |
32.2% |
28.3% |
27.5% |
26.5% |
|
||
|
Net margin, % |
neg |
16.6% |
47.7% |
26.8% |
27.8% |
27.6% |
|
||
|
ROE, % |
n/m |
5.3% |
17.7% |
7.7% |
8.0% |
8.0% |
|
||
|
ROIC, % |
15.5% |
13.2% |
13.6% |
10.0% |
9.2% |
8.6% |
|
||
|
Capex/Revenues, % |
18% |
14% |
13% |
16% |
14% |
12% |
|
||
|
Capex/Depreciation, x |
2.3x |
2.4x |
3.1x |
3.1x |
2.8x |
|
2.5x |
||
|
Net debt/Equity, % |
-15% |
-24% |
-25% |
-24% |
-24% |
-24% |
|
||
|
Net debt/EBITDA, x |
(1.6x) |
(2.6x) |
(2.1x) |
(3.0x) |
(3.0x) |
|
(3.1x) |
||
|
Net interest cover, x |
|
(29.5x) |
(17.0x) |
(35.5x) |
(23.7x) |
(24.5x) |
|
(25.0x) |
|
|
Income statement summary, USD mn |
|
|
|
|
|
|
|
|
|
|
Revenues |
15,222 |
20,137 |
25,088 |
20,261 |
21,534 |
22,930 |
|
||
|
Cost of sales |
(8,780) |
(12,709) |
(15,429) |
(12,993) |
(13,969) |
(15,204) |
|
||
|
SG&A and other opexp. |
|
(1,407) |
(1,624) |
(1,576) |
(1,544) |
(1,646) |
|
(1,661) |
|
|
EBITDA |
5,035 |
5,804 |
8,083 |
5,724 |
5,919 |
6,065 |
|
||
|
Depreciation & amortization |
|
(1,150) |
(1,136) |
(1,063) |
(1,027) |
(1,072) |
|
(1,117) |
|
|
Operating profit |
3,885 |
4,668 |
7,020 |
4,697 |
4,847 |
4,948 |
|
||
|
Non-operating gains /(exp.) |
(6,570) |
(2,104) |
5,911 |
274 |
19 |
19 |
|
||
|
EBIT |
3,885 |
4,668 |
7,020 |
4,697 |
4,847 |
4,948 |
|
||
|
Net interest income/(exp.) |
1,610 |
1,659 |
1,717 |
1,669 |
2,476 |
2,807 |
|
||
|
Profit before tax |
(1,077) |
4,223 |
14,648 |
6,640 |
7,342 |
7,774 |
|
||
|
Income tax |
152 |
(886) |
(2,677) |
(1,202) |
(1,359) |
(1,433) |
|
||
|
Minority interests |
(1) |
(1) |
(4) |
(2) |
(2) |
(2) |
|
||
|
Net income |
(926) |
3,336 |
11,967 |
5,436 |
5,981 |
6,339 |
|
||
|
Cash flow statement summary, USD mn |
|
|
|
|
|
|
|
|
|
|
Cash flow from operations |
3,913 |
6,102 |
5,383 |
4,501 |
4,539 |
4,611 |
|
||
|
Working capital changes |
(164) |
294 |
(19) |
(19) |
(19) |
(19) |
|
||
|
Capex |
(2,696) |
(2,745) |
(3,324) |
(3,148) |
(3,040) |
(2,799) |
|
||
|
Other investing activities |
(306) |
(2,238) |
- |
- |
- |
- |
|
||
|
Free cash flow |
1,222 |
3,366 |
2,059 |
1,353 |
1,499 |
1,812 |
|
||
|
Dividends paid |
(1,107) |
(447) |
(541) |
(1,091) |
(658) |
(697) |
|
||
|
Net change in borrowings |
|
372 |
1,406 |
- |
- |
- |
|
- |
|
|
Other financing cash flow |
|
(103) |
(205) |
- |
- |
- |
|
- |
|
|
Movement in cash |
|
26 |
1,886 |
1,519 |
262 |
841 |
|
1,116 |
|
|
Balance sheet summary, USD mn |
|
|
|
|
|
|
|
|
|
|
Cash and equivalents |
1,787 |
3,812 |
5,330 |
5,592 |
6,433 |
7,549 |
|
||
|
PP&E |
21,953 |
24,839 |
28,163 |
31,311 |
34,351 |
37,150 |
|
||
|
Goodwill |
|
3 |
0 |
- |
- |
- |
|
- |
|
|
Investments |
|
36,904 |
41,219 |
41,219 |
41,219 |
41,219 |
|
41,219 |
|
|
Other assets |
|
4,005 |
3,735 |
3,736 |
3,736 |
3,736 |
|
3,736 |
|
|
Total assets |
64,652 |
73,605 |
78,448 |
81,858 |
85,739 |
89,654 |
|
||
|
Interest bearing debt |
1,480 |
3,202 |
3,202 |
3,202 |
3,202 |
3,202 |
|
||
|
Other liabilities |
6,371 |
7,674 |
7,674 |
7,674 |
7,674 |
7,674 |
|
||
|
Total liabilities |
7,850 |
10,877 |
10,876 |
10,876 |
10,876 |
10,876 |
|
||
|
Total shareholder's equity |
56,798 |
62,724 |
67,567 |
70,977 |
74,858 |
78,773 |
|
||
|
Minority interest |
4 |
5 |
9 |
11 |
13 |
15 |
|
||
|
Net working capital |
2,029 |
2,168 |
2,168 |
2,168 |
2,168 |
2,168 |
|
||
|
Net Debt |
(8,287) |
(15,309) |
(16,828) |
(17,090) |
(17,931) |
(19,047) |
|
||
|
Capital |
58,277 |
65,926 |
70,769 |
74,179 |
78,060 |
81,975 |
|
||
21 December 2018 |
6 |
vk.com/id446425943
Russia
Energy: Integrated Oil & Gas
VTB Capital Facts & Forecasts
Russia
Energy / Integrated Oil & Gas
Tatneft
Prices as of: 19 December 2018
Ticker |
CCY |
Current |
12mo TP |
Rating |
TATN RX |
USD |
10.59 |
7.00 |
Sell |
Share price performance, 12-mo
15 |
40% |
|
30% |
10 |
20% |
|
|
5 |
10% |
|
|
|
0% |
0 |
-10% |
Dec Feb Apr Jun Aug Oct Dec
TATN RX, USD, lhs
Relative to MOEX Index, %, rhs
Company description
Tatneft is the fifth largest oil producer in Russia, with 29mmt output in 2017. The majority of its operations are located in the Volga-Urals, with the Romashkinskoye field being the company's core producing asset (in 2017, it accounted for 52% of its total production volumes). Tatneft is also developing the Ashalchinskoye natural bitumen field, where 1.2mnt of high viscous crude oil was produced in 2017. At the end of 2011, Tatneft constructed the first line of its oil refinery (TANECO) in Nizhnekamsk. TANECO is a greenfield refinery and petrochemical complex with a current throughput capacity of 8.7mmt per annum.
Company website
http://www.tatneft.ru/
Shareholder structure
Svyazinvestneftekhim
26%
Quasi-
Treasury
3%
Other/Free
float
71%
Source: Company data, VTB Capital Research
Research team
Dmitry Loukashov, CFA / +7 495 663 46 34
Ekaterina Rodina / +7 495 663 47 33
Alexander Donskoy / +7 495 660 67 88
Aydar Safin / +7 495 663 46 32
Artur Muradyants / +7 495 663 46 38
Russian Oil and Gas
Last model update on: 21 December 2018
|
IFRS |
2016 |
2017 |
2018F |
2019F |
2020F |
|
2021F |
||
|
Company data |
|
|
|
|
|
|
|
|
|
|
Weighted avg # shares, mn |
|
2,257 |
2,251 |
2,251 |
2,251 |
2,251 |
|
2,251 |
|
|
Avg market cap, USD mn |
11,183 |
15,146 |
23,436 |
23,436 |
23,436 |
23,436 |
|
||
|
EV, USD mn |
9,849 |
14,019 |
21,662 |
20,357 |
20,206 |
19,641 |
|
||
|
Ratios & analysis |
|
|
|
|
|
|
|
|
|
|
P/E, x |
|
7.2x |
7.3x |
6.4x |
9.7x |
8.9x |
|
7.8x |
|
|
EV/EBITDA, x |
4.1x |
4.5x |
4.5x |
5.8x |
5.2x |
|
4.5x |
||
|
P/B, x |
|
1.0x |
1.2x |
1.6x |
1.3x |
1.2x |
|
1.0x |
|
|
FCF yield, % |
6.0% |
11.9% |
8.9% |
3.7% |
4.5% |
3.3% |
|
||
|
Dividend yield (ords), % |
7.7% |
9.3% |
8.9% |
5.0% |
5.5% |
6.2% |
|
||
|
Dividend yield (prefs), % |
13.8% |
13.7% |
12.7% |
7.1% |
7.8% |
8.9% |
|
||
|
EPS(ords), USD |
0.71 |
0.94 |
1.65 |
1.09 |
1.20 |
1.36 |
|
||
|
CFPS, USD |
0.93 |
1.45 |
1.81 |
1.30 |
1.43 |
1.61 |
|
||
|
Free CFPS, USD |
0.31 |
0.81 |
0.95 |
0.39 |
0.48 |
0.35 |
|
||
|
DPS (ords), USD |
0.39 |
0.64 |
0.94 |
0.53 |
0.58 |
0.66 |
|
||
|
DPS (prefs) |
0.39 |
0.64 |
0.94 |
0.53 |
0.58 |
0.66 |
|
||
|
Payout ratio (ords), % |
51.5% |
63.6% |
53.3% |
45.4% |
45.2% |
45.2% |
|
||
|
Payout ratio (prefs), % |
|
3.6% |
4.5% |
3.7% |
3.2% |
3.2% |
|
3.2% |
|
|
BPS(ords), USD |
|
5.18 |
5.54 |
6.69 |
8.18 |
9.20 |
|
10.71 |
|
|
Revenues growth, % |
|
-8% |
34% |
22% |
-20% |
8% |
|
10% |
|
|
EBITDA, chg |
-3% |
29% |
54% |
-27% |
11% |
13% |
|
||
|
EPS growth, % |
-1% |
32% |
76% |
-34% |
10% |
14% |
|
||
|
EBIT margin, % |
22% |
21% |
28% |
24% |
25% |
26% |
|
||
|
EBITDA margin, % |
25.1% |
24.2% |
30.4% |
27.5% |
28.3% |
28.9% |
|
||
|
Net margin, % |
16.1% |
15.9% |
22.8% |
18.8% |
19.1% |
19.7% |
|
||
|
ROE, % |
13.8% |
17.1% |
24.8% |
13.4% |
13.1% |
12.8% |
|
||
|
ROIC, % |
11.0% |
13.0% |
19.4% |
11.9% |
11.9% |
12.1% |
|
||
|
Capex/Revenues, % |
14% |
11% |
12% |
16% |
15% |
18% |
|
||
|
Capex/Depreciation, x |
4.4x |
3.4x |
4.4x |
4.8x |
4.8x |
|
6.1x |
||
|
Net debt/Equity, % |
-11% |
-9% |
-12% |
-17% |
-16% |
-16% |
|
||
|
Net debt/EBITDA, x |
(0.5x) |
(0.4x) |
(0.4x) |
(0.9x) |
(0.8x) |
|
(0.8x) |
||
|
Net interest cover, x |
|
37.0x |
52.5x |
91.9x |
64.5x |
72.2x |
|
82.2x |
|
|
Income statement summary, USD mn |
|
|
|
|
|
|
|
|
|
|
Revenues |
9,917 |
13,292 |
16,230 |
13,060 |
14,085 |
15,560 |
|
||
|
Cost of sales |
(6,603) |
(8,917) |
(10,495) |
(8,687) |
(9,242) |
(10,110) |
|
||
|
SG&A and other opexp. |
|
(829) |
(1,162) |
|
|
|
|
|
|
|
EBITDA |
2,485 |
3,213 |
4,936 |
3,585 |
3,982 |
4,496 |
|
||
|
Depreciation & amortization |
|
(322) |
(426) |
(438) |
(426) |
(448) |
|
(471) |
|
|
Operating profit |
2,162 |
2,786 |
4,498 |
3,159 |
3,534 |
4,025 |
|
||
|
Non-operating gains /(exp.) |
(28) |
(14) |
123 |
6 |
- |
- |
|
||
|
EBIT |
2,162 |
2,786 |
4,498 |
3,159 |
3,534 |
4,025 |
|
||
|
Net interest income/(exp.) |
23 |
58 |
39 |
38 |
38 |
38 |
|
||
|
Profit before tax |
2,102 |
2,803 |
4,660 |
3,203 |
3,572 |
4,063 |
|
||
|
Income tax |
(520) |
(679) |
(958) |
(748) |
(878) |
(983) |
|
||
|
Minority interests |
19 |
(13) |
1 |
(3) |
(3) |
(19) |
|
||
|
Net income |
1,601 |
2,110 |
3,704 |
2,452 |
2,691 |
3,061 |
|
||
|
Cash flow statement summary, USD mn |
|
|
|
|
|
|
|
|
|
|
Cash flow from operations |
2,108 |
3,261 |
4,073 |
2,927 |
3,209 |
3,631 |
|
||
|
Working capital changes |
184 |
(113) |
|
|
|
|
|
|
|
|
Capex |
(1,427) |
(1,456) |
(1,941) |
(2,049) |
(2,129) |
(2,851) |
|
||
|
Other investing activities |
(396) |
(69) |
- |
- |
- |
- |
|
||
|
Free cash flow |
696 |
1,834 |
2,132 |
878 |
1,080 |
780 |
|
||
|
Share issue (reacquisition) |
- |
- |
|
|
|
|
|
|
|
|
Dividends paid |
|
(369) |
(1,859) |
(1,484) |
(2,183) |
(1,232) |
|
(1,345) |
|
|
Net change in borrowings |
|
(120) |
(60) |
|
|
|
|
|
|
|
Other financing cash flow |
|
- |
0 |
|
|
|
|
|
|
|
Movement in cash |
890 |
(588) |
647 |
(1,305) |
(151) |
(565) |
|
||
|
Balance sheet summary, USD mn |
|
|
|
|
|
|
|
|
|
|
Cash and equivalents |
1,271 |
743 |
1,390 |
1,390 |
1,390 |
1,390 |
|
||
|
PP&E |
|
9,622 |
11,310 |
13,251 |
15,300 |
17,429 |
|
20,280 |
|
|
Goodwill |
|
- |
26 |
26 |
26 |
26 |
|
26 |
|
|
Investments |
|
1,687 |
2,106 |
2,106 |
2,106 |
2,106 |
|
2,106 |
|
|
Other assets |
5,466 |
5,042 |
5,042 |
5,042 |
5,042 |
5,042 |
|
||
|
Total assets |
18,046 |
19,227 |
21,815 |
23,864 |
25,993 |
28,844 |
|
||
|
Interest bearing debt |
892 |
813 |
813 |
(492) |
(643) |
(1,208) |
|
||
|
Other liabilities |
5,466 |
5,936 |
5,936 |
5,936 |
5,936 |
5,936 |
|
||
|
Total liabilities |
6,359 |
6,749 |
6,749 |
5,444 |
5,293 |
4,728 |
|
||
|
Total shareholder's equity |
11,598 |
12,359 |
14,948 |
18,299 |
20,576 |
23,973 |
|
||
|
Minority interest |
89 |
119 |
118 |
121 |
124 |
143 |
|
||
|
Net working capital |
852 |
926 |
926 |
926 |
926 |
926 |
|
||
|
Net Debt |
(1,334) |
(1,127) |
(1,774) |
(3,079) |
(3,230) |
(3,795) |
|
||
|
Capital |
|
12,491 |
13,171 |
15,761 |
17,807 |
19,933 |
|
22,765 |
|
|
|
|
|
|
|
|
|
|
|
|
21 December 2018 |
7 |

vk.com/id446425943 |
Russian Oil and Gas |
Russia |
|
Energy: Integrated Oil & Gas |
|
Disclosures
Production and Distribution of VTB Capital Research Reports outside the United States
The information and opinions contained within VTB Capital research reports are prepared by research analysts associated with JSC VTB Capital, VTB Capital PLC and their non-U.S. affiliates (each such entity, a “VTB Group entity,” and all such entities collectively, the “VTB Group”), as indicated on the front page of this VTB Capital research report. Research reports produced by VTB Group entities are distributed under the VTB Capital logo (each such research report, a “VTB Capital research report”). This VTB Capital research report is distributed outside the United States by VTB Group entities.
Distribution of VTB Capital Research Reports to Investors within the United States
This VTB Capital research report is distributed to investors located within the United States by Xtellus Capital Partners Inc. (“Xtellus”), a broker-dealer registered with the U.S. Securities and Exchange Commission (the “SEC”) and a member of the Financial Industry Regulatory Authority (“FINRA”). Xtellus had no involvement in the preparation of this VTB Capital research report, and is distributing this VTB Capital research report to investors located within the United States as a “third-party research report” as defined in Rule 2241(a)(14). Xtellus has accepted responsibility for the content of this VTB Capital research report to the extent required by SEC guidance under Rule 15a-6.6 under the U.S. Securities Exchange Act of 1934 (the “Exchange Act”). Transactions in securities discussed in this VTB Capital research report must be effected by VTB Group entities with U.S. investors through Xtellus in accordance with Rule 15a-6. If you are an investor located within the United States, you should contact Xtellus if you wish to communicate with the VTB Capital research analysts who wrote this report, or you wish to conduct any transactions in securities described in this report.
Relationship between VTB and Xtellus
Xtellus is the successor entity of VTB Capital Inc, which was an SEC-registered broker dealer and affiliate of the VTB Group. The VTB Group sold its interest in VTB Capital Inc. with effect from August 31st 2018 to a newly formed holding company, Khepri Capital, LLC, an entity established and owned by certain VTB Capital Inc. personnel. In connection with the sale, VTB Capital Inc. was re-named Xtellus. While the VTB Group no longer has any ownership interest in Xtellus, Xtellus continues to provide certain services to VTB Group entities. Specifically, Xtellus (i) acts as agent for VTB Group entities pursuant to Rule 15a-6 under the Exchange Act in connection with securities transactions effected by VTB Group entities with U.S. investors, and (ii) is the exclusive distributor of VTB Capital research reports into the United States. Xtellus receives fees for research and Rule 15a-6 intermediation services it provides to VTB Capital Group entities, including fees for the right to distribute Xtellus research reports outside the United States. While the VTB Group no longer has any ownership interest in Xtellus, in light of the research and Rule 15a-6 service arrangements between the VTB Group and Xtellus, this VTB Capital research report includes disclosures pursuant to FINRA Rule 2241(h)(4) and FINRA Rule 2242(g)(3) applicable to VTB Group entities as if such VTB Group entities were affiliates of Xtellus. The inclusion of these affiliate disclosures should not be construed as implying that any VTB Group entity is affiliated with Xtellus for any other purpose.
Conflict of Interest Disclosures.
VTB Group entities do and seek to do business with companies covered in their research reports. Thus, investors should be aware that the VTB Group may have a conflict of interest that could affect the objectivity of this research report. Investors should consider this research report as only a single factor in making their investment decision. Where an issuer referred to in this report is not included in the disclosure table, the issuer is either considered not to be covered by VTB Capital Research, or the reference is considered to be incidental and therefore the issuer is not a subject company within this report.
Certain disclosures on the companies covered by this VTB Capital research report are set forth below. Additional disclosures on the companies covered by this report can be obtained by accessing the following webpages:
Research disclosures webpage - http://research.vtbcapital.com/ServicePages/Disclosures.aspx.
Investment Recommendations disclosures webpage – https://www.vtbcapital.com/about/information-disclosure/investment- recommendations/
Additional disclosures on the companies covered by this report can be obtained by writing to the offices listed on the back page. In order to receive i) a summary of any basis of the valuation or methodology and the underlying assumptions used to either evaluate a financial instrument or an issuer, or to set a price target for a financial instrument, as well as an indication and a summary of any changes in the valuation, methodology or underlying assumptions; ii) detailed information about the valuation or methodology and the underlying assumptions in any non-proprietary models; or iii) material information about the proprietary models used; please consult the VTB Capital Research web-site at https://research.vtbcapital.com or contact the authors of this document.
21 December 2018 |
8 |

vk.com/id446425943 |
Russian Oil and Gas |
|
|
|
|
Russia |
|
|
|
|
Energy: Integrated Oil & Gas |
|
|
|
|
Issuer Specific Disclosures |
|
|
|
|
Disclosure checklist |
|
|
|
|
Company |
Ticker |
Recent price |
Disclosure |
|
Gazprom |
GAZP RX |
153.0 (RUB) |
4a, 5a, 6a, 9a, 12a |
|
Gazprom Neft |
SIBN RX |
350.7 (RUB) |
4a, 5a, 6a, 9a |
|
Lukoil |
LKOH RX |
4,910 (RUB) |
4a |
|
Surgutneftegas |
SNGS RX |
27.89 (RUB) |
4a |
|
Tatneft |
TATN RX |
714.3 (RUB) |
4a |
4a. VTB Capital or an affiliated company is a provider of liquidity and/or a market maker in the securities of the relevant issuer at the time this research report was published. VTB Capital or an affiliated company will buy and sell securities of the relevant issuer on a principal basis.
5a. VTB Capital or an affiliated company has been lead manager or co-lead manager over the previous 12 months of a public offering of securities of the relevant issuer.
6a. VTB Capital or an affiliated company is party to an agreement that has been in effect during the previous 12 months, or has received compensation during the previous 12 months, from the relevant issuer relating to the provision of investment banking services.
9a. VTB Capital or an affiliated company expects to receive or intends to seek investment banking related compensation from the relevant issuer within the next 3 months.
12a. VTB Capital or an affiliated company has a long shareholding position exceeding 0.5% of the total issued share capital in the relevant issuer.
Analysts Certification
The research analyst(s) whose name(s) appear on this VTB Capital research report certify pursuant to SEC Regulation AC that: i) all of the views expressed in this research report accurately reflect their personal views about the subject security or issuer, and ii) no part of the research analysts’ compensation was, is, or will be directly or indirectly related to the specific recommendations or views expressed by the research analysts in this VTB Capital research report.
The research analysts whose names appear on VTB Capital research reports received compensation that is based upon various factors including VTB Capital Group’s total revenues, a portion of which are generated by VTB Capital Group’s investment banking activities.
Investment Ratings
VTB Capital uses a three-tiered Investment Rating system for stocks under coverage: Buy, Hold, or Sell.
The three main ratings correspond to the next 12-month Expected Total Return (ETR), defined as the difference between the Target Price and the Last Price as indicated by Bloomberg divided by that Last Price plus the expected Dividend Yield over the next 12 months. Under this Investment Ratings system, Buy, Hold, and Sell have the following meanings: (as of the publishing date):
BUY: ETR exceeds plus 20% or more HOLD: ETR is between zero and plus 20% SELL: ETR is less than zero
VTB Capital Research confirms that published Buy, Hold or Sell ratings conform to these definitions at the time a Target Price is established or an Investment Rating is revised. Between such revisions, day-to-day movements in the prices of financial instruments could result in a temporary discrepancy between the Investment Rating and the aforementioned definition. Analysts address such discrepancies based on their scale and duration.
UNDER REVIEW: In the event that significant information about an issuer is due to be announced or is expected to become public in the foreseeable future, or the analyst needs time to evaluate such information, which was announced recently, s/he might choose to place that issuer Under Review. This means that the analyst is suspending the previously published financial forecasts, Target Price and investment rating in order to review them while waiting for the impending information. As such, they are no longer valid and should not be relied upon.
RESTRICTED: In certain circumstances, VTB Capital is not able to communicate issuer ratings due to internal policy and/or law and regulations. In this case, any revision of the financial forecasts, Target Prices and Investment Ratings will be carried out only after the Restricted status is removed.
Notwithstanding the above, VTB Capital may from time to time issue investment recommendations predicated on a different time horizon (such as short-term trading recommendations) to that which is described above. Where VTB Capital issues such an investment recommendation, the use of an alternative time horizon for the purpose of formulating such investment recommendation might result in differences between such investment recommendation and any investment rating published in accordance with the Investment Rating system described above. In addition, short-term trading recommendations may result in short-term price movements contrary to the recommendations in this research report.
21 December 2018 |
9 |

vk.com/id446425943 |
Russian Oil and Gas |
Russia |
|
Energy: Integrated Oil & Gas |
|
The below table details the distribution of VTB Capital’s Investment Ratings on the basis of the three-tier recommendation system described above.
VTB Capital Ratings Distribution
Investment Rating Distribution
Buy |
64 |
56% |
Hold |
34 |
30% |
Sell |
9 |
8% |
Restricted |
0 |
0% |
Not Rated |
0 |
0% |
Under Review |
7 |
6% |
|
114 |
|
Source: VTB Capital Research as at 30 November 2018
Ratings Distribution for Investment Banking Relationships
Buy |
10 |
62% |
Hold |
3 |
19% |
Sell |
0 |
0% |
Restricted |
0 |
0% |
Not Rated |
0 |
0% |
Under Review |
3 |
19% |
|
16 |
|
The VTB Capital Ratings Distribution tables above account for the recommendations on all instruments covered, rather than the number of companies covered. In instances where we provide a recommendation for more than one instrument issued by a company, these are counted separately. A list of those companies for which we cover more than one instrument can be found at DoubleRecPLC20181130.pdf.
12-month Target Prices
VTB Capital research analysts employ a variety of methods for estimating the fair value of financial instruments covered by them. These may include, but are not limited to, a Discount Cash Flow (DCF) model, a Dividend Discount Model (DDM), Net Asset Value (NAV) valuation, financial or asset-based multiples of analogous companies and a sum-of-the-parts (SOTP) valuation. The research analyst’s choice of methods used in each particular instance is based on the specifics of the investment case in question. The Target Price reflects the research analyst’s informed opinion on the price which is likely to be attained by the financial instrument in 12 months, subsequent to the date of the Target Price determination. The Target Price is underpinned by the aforementioned fair value estimates, and will belong to the range established by them.
Conflicts Management Arrangements
VTB Capital Research has been published in accordance with our conflict management arrangements, which are available at http://research.vtbcapital.com/ServicePages/Files/CoI+Arrangements+Research.pdf.
21 December 2018 |
10 |
vk.com/id446425943
VTB Capital Research
|
Moscow Research |
London Research |
|
Phone: +7 495 660 4253 |
Phone: +44 (0) 20 3334 8557 |
|
research@vtbcapital.com |
research@vtbcapital.com |
VTB Capital Offices
|
JSC VTB Capital |
VTB Capital plc |
VTB Capital plc |
|
Federation Tower West |
14 Cornhill |
9 Battery Road #27-01 |
|
12, Presnenskaya emb. |
London EC3V 3ND |
Straits Trading Building |
|
Moscow, 123100, Russia |
Phone: +44 (0) 20 3334 8000 |
Singapore 049910 |
|
Phone: +7 495 960 9999 |
Fax: +44 (0) 20 3334 8900 |
Phone: +65 6220 9422 |
|
www.vtbcapital.com |
www.vtbcapital.com |
Fax: +65 6225 0140 |
|
|
|
www.vtbcapital.com |
|
|
|
|
|
VTB Capital Hong Kong Limited |
|
|
|
Unit 2301, 23/F |
|
|
|
Cheung Kong Center |
|
|
|
2 Queen’s Road Central |
|
|
|
Hong Kong |
|
|
|
Phone: +852 3195 3688 |
|
|
|
Fax: +852 3195 3699 |
|
|
|
www.vtbcapital.com |
|
|
Xtellus Capital Partners Inc. (Sales and Research queries for US clients)
Xtellus Capital Partners Inc. Sales
452 Fifth Avenue, 23rd Floor
New York, NY 10018
Phone: +1646 527 6400
Sales@XtellusCapital.com
VTB Group entities do and seek to do business with companies covered in their research reports. Thus, investors should be aware that the VTB Group may have a conflict of interest that could affect the objectivity of this research report. Investors should consider this research report as only a single factor in making their investment decision.
This research report is for information purposes only and does not constitute nor is it intended as an offer or solicitation for the purchase or sale of securities or other financial instruments. Neither the information contained in this research report nor any future information made available with the subject matter contained herein will form the basis of any contract. Information and opinions contained herein have been compiled or arrived at by VTB Group from publicly available information and sources that VTB Group believes to be reliable. Whilst every care has been taken in preparing this research report, no research analyst, director, officer, employee, agent or adviser of any member of the VTB Group gives or makes any representation, warranty or undertaking, whether express or implied, and accepts no responsibility or liability as to the reliability, accuracy or completeness of the information set out in this research report. Any responsibility or liability for any information contained herein is expressly disclaimed. All information contained herein is subject to change at any time without notice. No member of the VTB Group has an obligation to update, modify or amend this research report or to otherwise notify a reader thereof in the event that any matter stated herein, or any opinion, projection, forecast or estimate set forth herein, changes or subsequently becomes inaccurate, or if research on the subject company is withdrawn. Furthermore, past performance is not indicative of future results.
The investments and strategies discussed herein may not be suitable for all investors or any particular class of investor. Investors should make their own investment decisions using their own independent advisors as they believe necessary and based upon their specific financial situations and investment objectives when investing. Investors should consult their independent advisors if they have any doubts as to the applicability to their business or investment objectives of the information and the strategies discussed herein. This research report is being furnished to certain persons as permitted by applicable law, and accordingly may not be reproduced or circulated to any other person without the prior written consent of a member of the VTB Group. This research report may not be relied upon by any retail customers or persons to whom this research report may not be provided by law. Unauthorised use or disclosure of this research report is strictly prohibited. Members of the VTB Group and/or their respective principals, directors, officers and employees (including, but not limited to, persons involved with the preparation or issuance of this research report) may own, have positions or effect transactions in the securities or financial instruments referred to herein or in the investments of any issuers discussed herein, may engage in securities transactions in a manner inconsistent with the research contained in this research report and with respect to securities or financial instruments covered by this research report, may sell to or buy from customers on a principal basis and may serve or act as director, placement agent, advisor or lender, or make a market in, or may have been a manager or a co-manager of the most recent public offering in respect of any investments or issuers of such securities or financial instruments referenced in this research report or may perform any other investment banking or other services for, or solicit investment banking or other business from, any company mentioned in this research report. Disclosures of conflicts of interest, if any, are found at the end of the text of this research report. Members of the VTB Group may have acted upon or used the information or conclusions contained in this research report, or the research or analysis on which they are based, before publication of this research report. Investing in the Russian Federation, its markets and in Russian securities and financial instruments involves a high degree of risk, and many persons, physical and legal, may be restricted from dealing in the securities markets of the Russian Federation. Investors should perform their own due diligence before investing. It is particularly important to note that securities and financial instruments denominated in foreign currencies and ADRs and other investments discussed herein are subject to exchange rate fluctuations that may adversely affect the value of the investment. The value of investments may fall as well as rise and investors may not get back the amount invested. Prices and availability of securities, financial instruments or investments are also subject to change without notice. The views and opinions expressed in this research report accurately reflect the personal views of the authors of this research report about the subject investments, securities and financial instruments and issuers and do not necessarily reflect the views of any member of the VTB Group. No part of the compensation of the authors of this research report was, is or will be directly or indirectly related to the specific recommendations or views contained in the research report. By accepting this research report, you agree to be bound by the foregoing limitations. This material is not intended for the use of private investors.
In Russia, this report is approved and/or communicated by JSC VTB Capital, a professional securities market participant regulated by the Central Bank of Russia.
In the United Kingdom this report is approved and/or communicated by VTB Capital plc London, a member of the London Stock Exchange and authorized by the Prudential Regulation Authority and regulated by the Financial Conduct Authority and the Prudential Regulation Authority. This report is intended for those persons that would be classified as Eligible Counterparties or Professional Clients under the Financial Conduct Authority’s Conduct of Business rules.”
This research report is distributed in Singapore by VTB Capital plc to accredited investors, expert investors or institutional investors only (as defined in the applicable Singapore laws and regulations and is not intended to be distributed directly or indirectly to any other class of person). Recipients of this report in Singapore are to contact VTB Capital plc, Singapore branch in respect of any matters arising from, or in connection with, this report. VTB Capital plc, Singapore branch is regulated by the Monetary Authority of Singapore.
This research report is distributed in Hong Kong by VTB Capital Hong Kong Limited, a licensed corporation (CE Ref: AXF967) licensed by the Hong Kong Securities and Futures Commission to “professional investors” (as defined in the Hong Kong Securities and Futures Ordinance and its subsidiary legislation) only.
For important disclosures and equity rating histories regarding companies that are the subject of this report, please see the VTB Capital Research Website: http://research.vtbcapital.com/ServicePages/Disclosures.aspx, or contact your research representative.
Copyright © 2018 by VTB Capital. All rights reserved. Please cite source when quoting.