

Rusal-050219_(4)_watermark
.pdfvk.com/id446425943
Rusal
Resuming coverage
Rusal has been removed from the Office of Foreign Assets Control's (OFAC) Specially Designated Nationals List. We resume coverage on Rusal with a TP of HKD6.0 and a BUY rating (previously Suspended). We have a positive outlook on the aluminium market, and believe Rusal’s medium-term deleveraging and longer-term dividend yield potential could be positive catalysts.
Deleveraging and dividends driven by attractive FCF yield
We forecast Rusal’s FCF to equity shareholders (FCFE) yield at 25% on average over the next three years, after capex of $700-850mn. Deleveraging the balance sheet is a strategic priority for Rusal and its medium-term dividend policy is to pay up to 15% of EBITDA plus dividends from its investment in Norilsk Nickel (BUY, TP $24.0, CP $20.7). Despite this conservative policy, we calculate supportive dividend yields of 6.5% on average over the next three years. We forecast net debt falling from $7.6bn in FY17, to $4.7bn at the end of FY20, implying comfortable net debt/(EBITDA + Norilsk dividend) of 1.5x.
Favourable cost position and strategy to improve margins
Rusal’s operations are competitively positioned in the first half of the aluminium cost curve. The company’s strategy to enhance margins further include: increasing the share of value-added products to achieve higher sales realisations; expanding sales in Russia and the CIS; achieving self-sufficiency in raw materials to be independent from third-party suppliers; pursuing R&D projects to develop new aluminium alloys and products; introducing innovative technologies to improve operating efficiency; ensuring a secure supply of energy through access to competitive sources; and maintaining secure transport via optimal logistics.
Risks
Our discounted cash flow (DCF) valuation is calculated using a weighted average cost of capital (WACC) of 12.5%, which reflects an equity risk premium of 8%. We employ a higher equity risk premium for Rusal than for other diversified miners under coverage to account for risks and uncertainties that we may not have reflected in our cash-flow forecasts. Key risks to our positive investment stance on Rusal are: 1) lower-than-forecast aluminium, nickel, palladium and copper prices; 2) a stronger- than-forecast rouble; 3) value destruction through low returns on capital expenditure; 4) risks associated with a potential “shoot-out” price auction between Rusal and
Vladimir Potanin’s investment companies for up to 30% of Norilsk Nickel; 5) potential higher taxes or government requirements for increased investment in social infrastructure; 6) the potential for regulation to result in higher electricity tariffs (major input cost) for industrial consumers; and 7) sanctions.
Resumption of coverage
BUY (previously Suspended) TP: HKD6.0 (previously Suspended)
Metals & Mining Russia
Johann Pretorius +27 (11) 750-1450
JPretorius2@rencap.com
Steven Friedman +27 (11) 750-1481
SFriedman@rencap.com
Kabelo Moshesha +27 (11) 750-1472
KMoshesha@rencap.com
Siphelele Mhlongo +27 (11) 750-1420
SMhlongo@rencap.com
Derick Deale
+27 (11) 750-1458 DDeale@rencap.com
Report date: |
|
5 February 2019 |
||
Current price, HKD |
|
|
|
3.3 |
Upside/downside, % |
|
|
|
88.2 |
MktCap, $mn |
|
|
|
6,350.9 |
Average daily volume, $mn |
|
|
3.2 |
|
Free float, $mn |
|
|
|
628.1 |
Bloomberg |
|
|
|
486 HK |
|
|
|
||
Summary valuation and financials |
|
|
||
IFRS |
2017 |
2018E |
2019E |
2020E |
Underlying EPS, $ |
0.08 |
0.13 |
0.09 |
0.12 |
EPS growth, % |
3.6 |
56.9 |
-29.2 |
36.9 |
DPS, $ |
0.02 |
0.03 |
0.02 |
0.03 |
Dividend yield, % |
3.4 |
6.9 |
5.1 |
6.3 |
EBITDA margin, % |
21.3 |
22.1 |
17.4 |
20.7 |
Capex/EBITDA, % |
26 |
24 |
33 |
22 |
FCF yield, % |
10.4 |
12.0 |
15.5 |
18.8 |
RoCE, % |
12.6 |
13.3 |
8.8 |
12.3 |
RoE, % |
32.9 |
39.4 |
23.4 |
26.4 |
Net debt/EBITDA, x |
2.4 |
2.2 |
2.3 |
1.5 |
P/E, x |
7.2 |
3.0 |
4.7 |
3.4 |
EV/EBITDA, x |
6.0 |
3.9 |
4.7 |
3.5 |
BVPS, $ |
0.3 |
0.3 |
0.4 |
0.5 |
Priced at market close on 1 February 2019
Source: Company data, Renaissance Capital estimates
Figure 1: Price performance – 52 weeks, HKD
486 HK
7 |
|
|
|
|
|
|
6 |
|
|
|
|
|
|
5 |
|
|
|
|
|
|
4 |
|
|
|
|
|
|
3 |
|
|
|
|
|
|
2 |
|
|
|
|
|
|
1 |
|
|
|
|
|
|
Jan |
Mar |
May |
Jul |
Sep |
Nov |
Jan |
Source: Bloomberg
Important disclosures are found at the Disclosures Appendix. Communicated by Renaissance Securities (Cyprus) Limited, regulated by the Cyprus Securities & Exchange Commission, which together with non-US affiliates operates outside of the USA under the brand name of Renaissance Capital.

vk.com/id446425943
Miners ranked by potential returns
Renaissance Capital
5 February 2019
Rusal
Figure 2 shows the companies under our coverage ranked by potential 12-month returns, based on our TPs.
Rusal offers a total potential one-year return of 88.2% based on our TP of HKD6.0 and our forecast one-year forward rolling dividend yield of 5.3%.
Figure 2: Summary sector ratings and TPs (ranked by total potential 12M return, including estimated dividends)
|
Unit |
12M TP |
Previous |
Current |
12M target |
12M fwd |
Total 12M |
12M forward |
Rating |
|
12M TP |
price* |
capital return |
dividend yield |
return |
rolling P/E |
|||
|
|
|
|
||||||
Rusal |
HKD |
6.0 |
Susp |
3.3 |
82.9% |
5.3% |
88.2% |
4.5x |
BUY |
Evraz |
GBp |
640.0 |
640.0 |
507.6 |
26.1% |
14.1% |
40.2% |
6.1x |
BUY |
Severstal |
$ |
18.1 |
18.1 |
15.4 |
17.2% |
11.9% |
29.1% |
8.1x |
BUY |
Phosagro |
$ |
16.0 |
16.0 |
13.5 |
18.8% |
7.7% |
26.4% |
6.5x |
BUY |
Norilsk |
$ |
24.0 |
24.0 |
20.8 |
15.6% |
10.4% |
26.0% |
9.8x |
BUY |
NLMK |
$ |
27.0 |
27.0 |
24.0 |
12.5% |
12.9% |
25.4% |
8.4x |
BUY |
MMK |
$ |
10.1 |
10.1 |
8.6 |
17.2% |
6.6% |
23.8% |
12.4x |
BUY |
Alrosa |
RUB |
109.0 |
109.0 |
99.5 |
9.5% |
13.0% |
22.6% |
7.3x |
BUY |
Polyus |
RUB |
6,300.0 |
6,300.0 |
5,521.5 |
14.1% |
6.0% |
20.1% |
7.1x |
BUY |
Rio Tinto |
GBP |
48.0 |
48.0 |
42.3 |
13.5% |
6.3% |
19.7% |
9.6x |
BUY |
Exxaro |
ZAR |
170.0 |
170.0 |
156.5 |
8.6% |
9.8% |
18.4% |
5.8x |
BUY |
ARM |
ZAR |
160.0 |
160.0 |
147.3 |
8.6% |
9.6% |
18.2% |
5.9x |
BUY |
Impala Platinum |
ZAR |
45.0 |
45.0 |
38.8 |
16.1% |
0.0% |
16.1% |
8.1x |
BUY |
ArcelorMittal SA |
ZAR |
4.0 |
4.0 |
3.5 |
15.9% |
0.0% |
15.9% |
-139.9x |
HOLD |
South32 |
ZAR |
37.0 |
37.0 |
33.9 |
9.0% |
6.7% |
15.7% |
11.4x |
HOLD |
BHP |
ZAR |
315.0 |
315.0 |
297.3 |
6.0% |
9.2% |
15.2% |
11.7x |
HOLD |
Fortescue |
AUD |
6.0 |
6.0 |
5.8 |
2.7% |
8.7% |
11.4% |
7.6x |
BUY |
Glencore |
ZAR |
55.0 |
55.0 |
53.1 |
3.7% |
6.7% |
10.3% |
11.6x |
HOLD |
Vale |
$ |
13.6 |
13.6 |
12.6 |
8.2% |
0.0% |
8.2% |
6.3x |
HOLD |
Polymetal |
GBP |
8.6 |
8.6 |
8.6 |
-0.1% |
6.6% |
6.5% |
7.7x |
HOLD |
Acron |
RUB |
4,600.0 |
4,600.0 |
4,670.0 |
-1.5% |
6.9% |
5.4% |
7.8x |
HOLD |
Anglo American |
ZAR |
340.0 |
340.0 |
345.2 |
-1.5% |
6.0% |
4.5% |
8.9x |
HOLD |
Assore |
ZAR |
320.0 |
320.0 |
346.8 |
-7.7% |
8.6% |
0.8% |
6.6x |
HOLD |
Sibanye - Stillwater |
ZAR |
11.1 |
11.1 |
12.1 |
-8.3% |
0.2% |
-8.1% |
5.6x |
HOLD |
Kumba Iron Ore |
ZAR |
270.0 |
270.0 |
340.6 |
-20.7% |
12.3% |
-8.4% |
8.2x |
SELL |
RBPlats |
ZAR |
25.0 |
25.0 |
28.8 |
-13.0% |
0.0% |
-13.0% |
8.2x |
SELL |
Anglo American Platinum |
ZAR |
540.0 |
540.0 |
636.0 |
-15.1% |
1.9% |
-13.2% |
15.7x |
HOLD |
Gold Fields |
ZAR |
43.0 |
43.0 |
53.8 |
-20.0% |
3.2% |
-16.8% |
9.7x |
SELL |
Northam |
ZAR |
40.0 |
40.0 |
48.5 |
-17.5% |
0.0% |
-17.5% |
13.1x |
SELL |
Harmony |
ZAR |
21.0 |
21.0 |
26.9 |
-22.0% |
3.6% |
-18.5% |
4.1x |
SELL |
Lonmin |
ZAR |
7.0 |
7.0 |
9.6 |
-26.8% |
0.0% |
-26.8% |
1.7x |
SELL |
AngloGold |
ZAR |
110.0 |
110.0 |
190.0 |
-42.1% |
1.1% |
-41.0% |
8.4x |
SELL |
Note: Priced at market close on 1 February 2019
Source: Thomson Reuters Datastream, Renaissance Capital estimates
2
vk.com/id446425943
Renaissance Capital
5 February 2019
Rusal
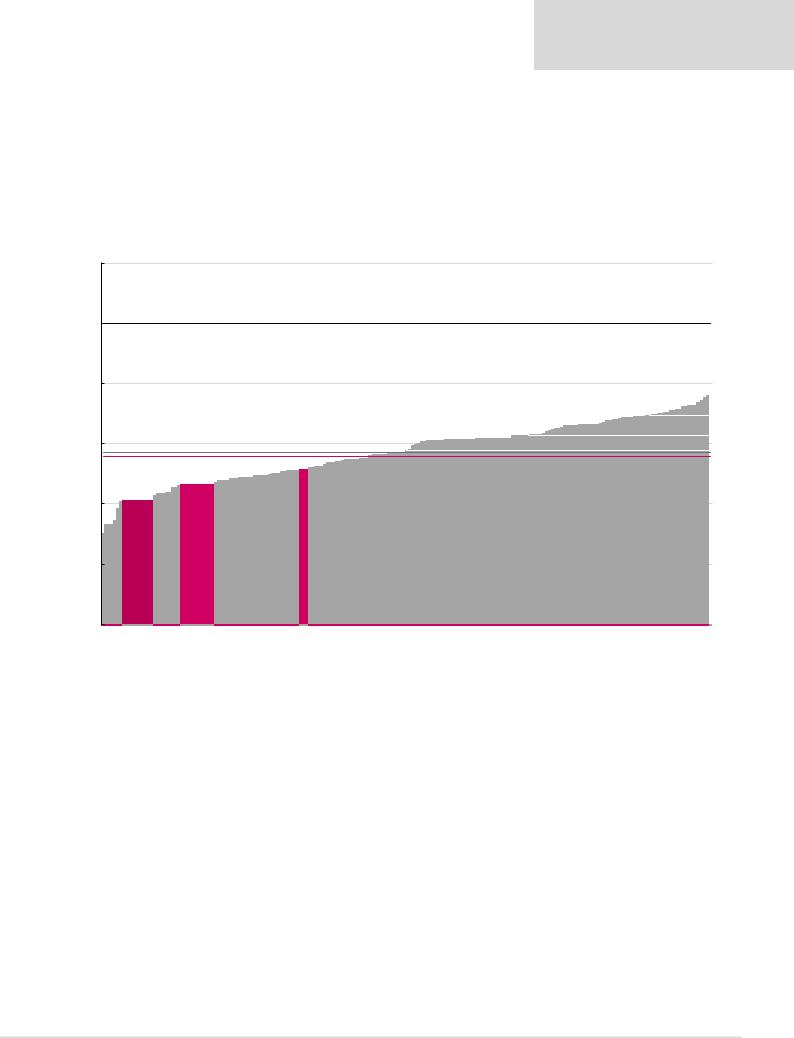
Favourable cost curve position
Rusal’s operations are competitively positioned in the first half of the aluminium cost curve.
Figure 3 shows our calculation of the estimated breakeven price per tonne of aluminium for Rusal in FY18 relative to the aluminium industry.
Figure 3: 2018E aluminium cash costs plus sustaining capex (reflecting 67.5mnt supply), $/t
3,500
3,000 |
Incentive price: $3,000/t |
|
|
|
|
||
2,500 |
|
|
|
|
|
|
90th percentile: $2,231/t |
|
|
|
70th percentile: $2,072/t |
2,000 |
Average cash cost: $1,927/t |
|
|
|
Spot price: $1,892/t* |
50th percentile: $1,939/t |
|
|
South32,1,783 |
||
1,500 |
1,530Tinto, |
1,658Rusal, |
|
|
|
|
|
1,000 |
Rio |
|
|
500
Note: Priced as at 1 February 2019
Source: Bloomberg, CRU, Renaissance Capital estimates
We believe Rusal and Norilsk’s favourable cost-curve positions would allow for positive
FCF generation through the cycle.
3
vk.com/id446425943
Renaissance Capital
5 February 2019
Rusal
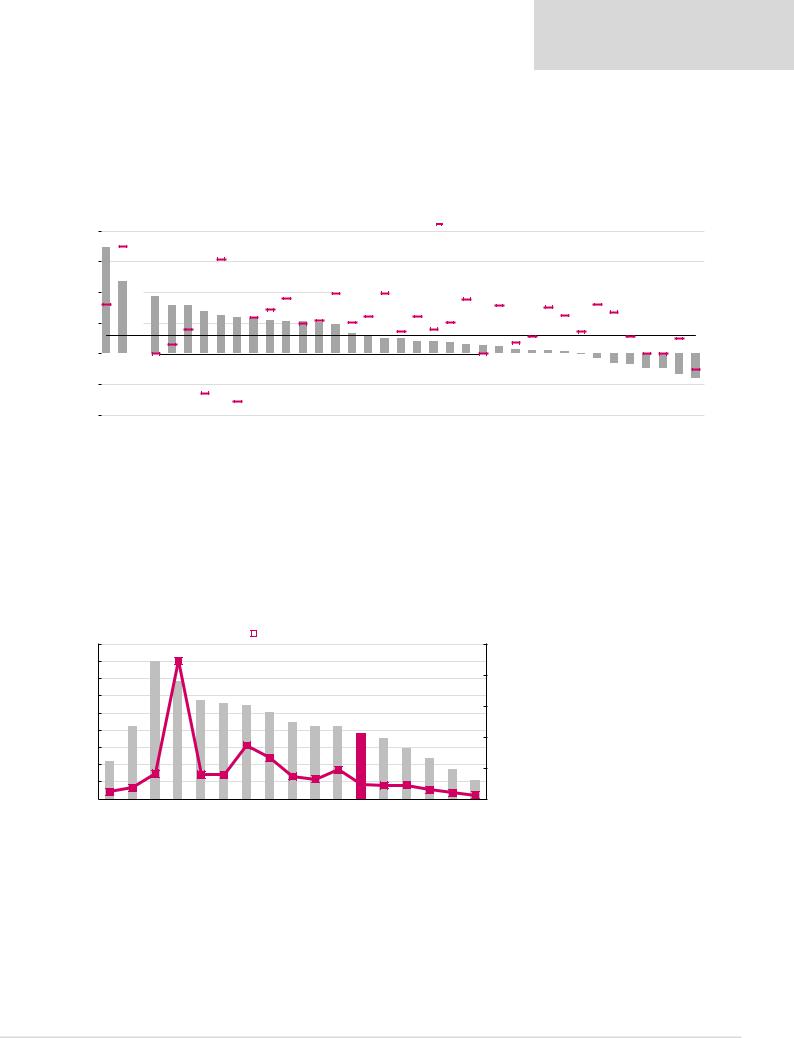
Deleveraging and dividends
We forecast Rusal’s net debt/(EBITDA + Norilsk dividends) at around 2.3x at the end of
FY19E, which is among the highest in our coverage universe. However, this is based on below mid-cycle EBITDA, which in turn is based on our average aluminium price forecast of $1,953/t.
Figure 4: Miners ranked by CY19E net debt/EBITDA compared with their historical averages
4x |
|
3.5x |
|
|
|
|
|
|
|
|
|
|
|
|
|
|
|
||
|
|
|
|
|
|
|
|
|
|
3x |
|
|
|
|
|
|
|
|
|
2x |
|
|
|
|
|
|
|
|
|
|
|
|
|
|
|
|
|
|
|
|
2.4x |
|
2.3x |
1.9x |
1.6x |
1.6x |
1.4x |
||
|
|
|
|||||||
1x |
|
|
|
|
|
|
|
|
|
|
|
|
|
|
|
|
|
|
|
0x |
|
|
|
|
|
|
|
|
|
|
|
|
|
|
|
|
|
|
|
-1x |
|
|
|
|
|
|
|
|
|
-2x |
|
Northam Glencore |
Rusal* |
Sappi |
Sasol |
Norilsk |
RBPlats |
||
|
|||||||||
|
|
||||||||
Note: Priced at market close on 1 February 2019
|
CY19E Net debt/EBITDA |
|
LT average |
|
|
1.3x |
1.2x |
1.1x |
1.1x |
1.1x |
1.1x |
1.0x |
1.0x |
|
|
|
|
|
|
|
|
|
|
|
|
|
|
|
|
|
|
|
|
|
|
|
|
|
|
|
|
|
|
0.7x |
0.6x |
0.5x |
0.5x |
0.4x |
0.4x |
0.4x |
0.3x |
0.3x |
0.2x |
0.1x |
0.1x |
0.1x |
0.1x |
|
|
|
|
|
|
|
|
|
|
|
|
||||||||||||
|
|
|
|
|
|
|
|
|
|
|
|
|
|
|
|
|
|
|
|
|
|
|
|
|
|
|
|
Sector average, 0.6x |
|
||||||||
|
|
|
|
|
|
|
|
|
|
|
|
|
|
|
|
|
|
|
|
|
|
|
|
|
|
|
|
|
|
|
|
|
|
|
|
|
|
|
|
|
|
|
|
|
|
|
|
|
|
|
|
|
|
|
|
|
|
|
|
|
|
|
|
0.0x |
-0.1x |
-0.3x |
-0.4x |
-0.5x |
-0.5x |
-0.7x |
-0.8x+ |
||||
Evraz |
AMSA |
PhosAgro |
Mondi |
Polymetal |
Polyus |
Sibanye |
Russian* |
Gold Fields |
Severstal |
Fortescue |
Others* |
AngloGold |
BHP |
NLMK |
Alrosa |
Harmony |
Vale |
Exxaro* |
Impala |
MMK |
Anglo |
Rio Tinto |
Hulamin |
Amplats |
Merafe |
Kumba |
South32 |
ARM* |
Assore* |
||||||||
Source: Company data, Renaissance Capital estimates
Deleveraging the balance sheet is a strategic priority for Rusal and its medium-term dividend policy is to pay up to 15% of EBITDA plus dividends from Norilsk. We forecast net debt falling from $7.6bn in FY17 to $4.7bn at the end of FY20, implying comfortable net debt/(EBITDA + Norilsk dividend) of 1.5x.
Figure 5: Rusal’s net debt and net debt/(EBITDA plus Norilsk dividends)
|
Net debt, $mn |
|
|
|
Net debt/(EBITDA+dividends from associates) |
18,000 |
|
|
|
|
|
|
|
|
|
|
|
|
|
|
|
|
25.0x |
16,000 |
|
|
|
|
|
|
|
|
|
|
|
|
|
|
|
|
|
14,000 |
|
|
|
|
|
|
|
|
|
|
|
|
|
|
|
|
20.0x |
|
|
|
|
|
|
|
|
|
|
|
|
|
|
|
|
|
|
12,000 |
|
|
|
|
|
|
|
|
|
|
7,648 |
|
|
|
|
|
|
10,000 |
|
|
|
|
|
|
|
|
|
|
6,982 |
|
|
|
|
15.0x |
|
|
|
|
|
|
|
|
|
|
|
5,937 |
|
|
|
|
|||
8,000 |
|
|
|
|
|
|
|
|
|
|
4,740 |
|
|
10.0x |
|||
|
|
|
|
|
|
|
|
|
|
|
3,393 |
|
|||||
6,000 |
|
|
|
|
|
|
|
|
|
|
2,172 |
|
|||||
4,000 |
|
|
|
|
|
|
|
|
|
|
5.0x |
||||||
|
|
|
|
|
|
|
|
|
|
|
|||||||
|
|
|
|
|
|
|
|
|
|
|
|
||||||
2,000 |
|
|
|
|
|
|
|
|
|
|
2.4x |
2.2x |
2.3x |
1.5x 1.0x |
0.7x |
|
|
|
|
|
|
|
|
|
|
|
|
|
|
|
|
||||
|
|
|
|
|
|
|
|
|
|
|
|
|
|
|
|
|
|
0 |
|
|
|
|
|
|
|
|
|
|
|
2018E |
2019E |
2020E |
2021E |
2022E |
0.0x |
2006 |
2007 |
2008 |
2009 |
2010 |
2011 |
2012 |
2013 |
2014 |
2015 |
2016 |
2017 |
|
|||||
Source: Company data, Renaissance Capital estimates
4
vk.com/id446425943
Renaissance Capital
5 February 2019
Rusal
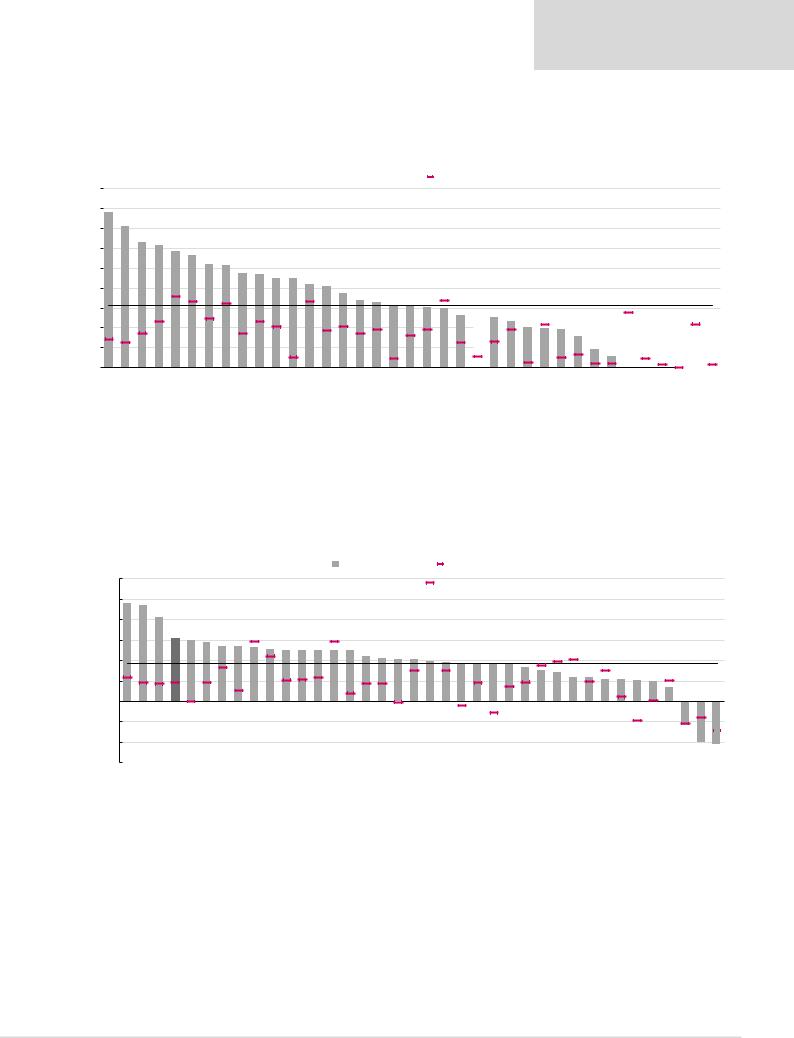
Despite Rusal’s conservative dividend policy, we forecast a supportive FY19E dividend yield of 5.1%. We forecast Rusal’s dividend yield over the next three years to be 6.5% on average.
Figure 6: Miners ranked by CY19E dividend yield compared with their historical averages
18% |
|
15.6% |
14.2% |
12.6% |
12.3% |
11.7% |
11.3% |
|
|||||||
16% |
|
||||||
|
|
|
|
|
|
|
|
14% |
|
|
|
|
|
|
|
12% |
|
|
|
|
|
|
|
10% |
|
|
|
|
|
|
|
8% |
|
|
|
|
|
|
|
6% |
|
|
|
|
|
|
|
4% |
|
|
|
|
|
|
|
2% |
|
|
|
|
|
|
|
0% |
|
Merafe |
Evraz |
Alrosa |
NLMK |
Severstal |
Kumba |
|
|||||||
|
|
Note: Priced at market close on 1 February 2019
10.4% |
10.3% |
9.5% |
9.4% |
9.0% |
8.9% |
8.4% |
|
|
CY19E Dividend yield |
|
|
LT average |
|
|
|
|
|
|
|
|
|
|
|
|
|
|
|
||||||||
|
|
|
|
|
|
|
|
|
|
|
|
|
|
|
|
|
|
|
|||||||||||||||||
8.2% |
7.5% |
6.8% |
6.6% |
6.3% |
6.2% |
6.1% |
5.9% |
5.2% |
5.1% |
5.1% |
4.6% |
4.0% |
4.0% |
3.8% |
3.1% |
1.9% |
1.1% |
0.0% |
0.0% |
0.0% |
0.0% |
0.0% |
0.0% |
||||||||||||
|
|
|
|
|
|
|
|
|
|
|
|
|
|
|
|
|
|
|
|
|
|
|
|
|
|
|
|
Sector average, 6.2% |
|
||||||
|
|
|
|
|
|
|
|
|
|
|
|
|
|
|
|
|
|
|
|
|
|
|
|
|
|
|
|
|
|
|
|
|
|
|
|
|
|
|
Russian* |
|
|
|
|
|
|
|
|
|
|
|
|
|
|
|
|
|
|
|
|
|
|
|
|
|
|
Impala |
|
|
|
|
|
Exxaro |
Norilsk |
ARM |
Fortescue |
Hulamin |
PhosAgro |
Assore |
BHP |
MMK |
Polymetal |
South32 |
Glencore |
Rio Tinto |
Polyus |
Anglo |
Rusal |
Others* |
Sasol |
Sappi |
Mondi |
Harmony |
Gold Fields |
Amplats |
AngloGold |
Vale |
Northam |
RBPlats |
Sibanye |
AMSA |
|||||||
Source: Company data, Renaissance Capital estimates
Attractive valuation relative to peers
Rusal’s CY19E FCF yield of 15.5% is well above the sector average of 9.4%.
Figure 7: Companies ranked by CY19E FCF yield compared with their historical averages
30.0%
25.0%
20.0%
15.0%
10.0%
5.0%
0.0% -5.0% -10.0% -15.0%
24.0% |
|
|
|
|
|
|
|
|
|
|
|
|
|
CY19E FCF yield |
|
|
LT average |
|
|
|
|
|
|
|
|
|
|
||||||
23.4% |
20.5% |
15.5% |
15.0% |
14.4% |
13.5% |
13.4% |
13.2% |
12.8% |
12.5% |
12.4% |
12.4% |
12.4% |
12.4% |
11.0% |
10.4% |
10.2% |
10.2% |
9.8% |
9.4% |
9.4% |
9.3% |
9.2% |
9.1% |
8.4% |
7.6% |
7.2% |
|
|
|
Sector average, 9.4% |
|||
5.9% |
5.9% |
5.4% |
5.3%+ |
4.8% |
3.5% |
||||||||||||||||||||||||||||
5.1% |
|||||||||||||||||||||||||||||||||
|
|
|
|
|
-6.0% |
-10.0% |
-10.5% |
|
|
Hulamin ARM Merafe Rusal Harmony Exxaro Fortescue AngloGold Alrosa Kumba Anglo NLMK Assore Evraz Gold Fields BHP Polyus PhosAgro Russian* South32 Rio Tinto Impala Polymetal Sibanye Others* Vale Glencore MMK Severstal Mondi Norilsk Amplats Northam Sasol Sappi Lonmin |
RBPlats |
AMSA |
||
*Proportionately consolidated **Excluding marketing business
Source: Company data, Renaissance Capital estimates
5

vk.com/id446425943
Renaissance Capital
5 February 2019
Rusal
Rusal’s CY19E P/E multiple of 4.7x is well below the sector average of 9.1x.
Figure 8: Companies ranked by CY19E P/E multiples compared with their historical averages
15.x |
|
20.0x |
17.6x |
16.2x |
13.6x |
12.8x |
12.5x |
||
25.x |
|
|
|
|
|
|
|
|
|
20.x |
|
|
|
|
|
|
|
|
|
10.x |
|
|
|
|
|
|
|
|
|
5.x |
|
|
|
|
|
|
|
|
|
0.x |
|
|
|
|
|
|
|
|
|
-5.x |
|
|
|
|
|
|
|
|
|
-10.x |
|
|
|
|
|
|
|
|
|
-15.x |
|
AMSA |
Fortescue |
Amplats |
Northam |
South32 |
MMK |
||
|
|||||||||
|
|
||||||||
Note: Priced at market close on 1 February 2019
|
|
|
|
|
|
|
|
CY19E P/E multiple |
LT average |
|
|
|
|
|
|
|
|
|
|
|
|
|
|
|||||||
12.1x |
11.3x |
10.5x |
10.1x |
10.0x |
9.8x |
9.6x |
9.4x |
9.0x |
8.9x |
8.9x |
8.3x |
8.2x |
7.9x |
7.8x |
7.7x |
7.6x |
7.6x |
7.5x |
7.0x |
6.8x |
6.8x |
6.2x |
5.9x |
5.7x |
5.6x |
4.7x |
4.6x |
3.9x |
3.4x |
2.0x |
|
|
|
|
|
|
|
|
|
|
|
|
|
|
|
|
|
|
|
|
|
|
|
Sector average, 9.1x |
|
|
|
||||
GoldRio GlencoreBHPMondiFieldsNorilskTintoAngloOthers*AngloGoldNLMKKumbaSasolSeverstalSappiImpalaPolymetalAlrosaRBPlatsRussian*PolyusValeAssoreEvrazSibanyeMerafeARMRusalExxaroHarmonyHulaminPhosAgro
Source: Company data, Renaissance Capital estimates
Rusal’s earnings sensitivity to aluminium prices and rouble
The figures below show Rusal’s FY19 earnings per share and P/E multiples on a range of aluminium prices and RUB/$ exchange rates. We use our base case earnings for Norilsk in all cases.
Figure 9: Rusal’s FY19E EPS at different aluminium prices and exchange rates, USc
|
|
RUB/$ |
57 |
60 |
64 |
67 |
70 |
74 |
77 |
|
$/t |
1,367 |
-7.5 |
-5.4 |
-3.6 |
-2.0 |
-0.5 |
0.8 |
2.0 |
|
price, |
1,562 |
-3.8 |
-1.8 |
0.0 |
1.7 |
3.1 |
4.4 |
5.6 |
|
1,757 |
-0.1 |
1.9 |
3.7 |
5.3 |
6.7 |
8.1 |
9.3 |
|
|
|
|
|
|
|
|
|
||
|
Aluminium |
1,953 |
3.5 |
5.6 |
7.3 |
8.9 |
10.4 |
11.7 |
12.9 |
|
|
2,148 |
7.2 |
9.2 |
11.0 |
12.5 |
14.0 |
15.3 |
16.5 |
|
|
2,343 |
10.8 |
12.8 |
14.6 |
16.2 |
17.6 |
18.9 |
20.1 |
|
|
2,538 |
14.4 |
16.4 |
18.2 |
19.8 |
21.2 |
22.5 |
23.7 |
Source: Bloomberg, Renaissance Capital estimates
Figure 10: Rusal’s FY19E P/E multiple at different aluminium prices and exchange rates
|
RUB/$ |
57 |
60 |
64 |
67 |
70 |
74 |
77 |
||
$/t |
1,367 |
-5.6 |
-7.7 |
-11.5 |
-20.7 |
-77.7 |
53.5 |
21.0 |
||
price, |
1,562 |
-11.0 |
-23.5 |
1112.3 |
25.1 |
13.4 |
|
9.4 |
7.4 |
|
1,757 |
-340.8 |
22.0 |
11.3 |
|
7.9 |
6.2 |
|
5.2 |
4.5 |
|
Aluminium |
1,953 |
11.9 |
7.5 |
5.7 |
4.7 |
4.0 |
|
3.6 |
3.2 |
|
|
2,148 |
5.8 |
4.6 |
3.8 |
3.3 |
3.0 |
2.7 |
2.5 |
||
|
2,343 |
3.9 |
3.3 |
2.9 |
2.6 |
2.4 |
2.2 |
2.1 |
||
|
2,538 |
2.9 |
2.5 |
2.3 |
2.1 |
2.0 |
1.9 |
1.8 |
||
Note: Priced as at market close on 1 February 2019
Source: Bloomberg, Renaissance Capital estimates
6

vk.com/id446425943
Commodity price and exchange rate forecasts
Figure 11 sets out our average commodity price and exchange rate forecasts per calendar year.
Renaissance Capital
5 February 2019
Rusal
Figure 11: Average commodity prices and exchange rates*
Average per calendar year |
2016 |
2017 |
2018 |
2019E |
2020E |
2021E |
2022E |
2023E |
LT real |
Precious commodities |
|
|
|
|
|
|
|
|
|
Gold, $/oz |
1,248 |
1,258 |
1,269 |
1,350 |
1,338 |
1,311 |
1,337 |
1,364 |
1,250 |
Silver, $/oz |
17 |
17 |
16 |
17 |
18 |
19 |
19 |
20 |
18 |
Platinum, $/oz |
988 |
950 |
880 |
870 |
1,070 |
1,153 |
1,177 |
1,200 |
1,100 |
Palladium, $/oz |
614 |
871 |
1,030 |
1,216 |
1,088 |
1,049 |
1,070 |
1,091 |
1,000 |
Rhodium, $/oz |
694 |
1,108 |
2,218 |
2,379 |
2,163 |
2,097 |
2,139 |
2,182 |
2,000 |
3PGM basket (57% Pt, 36% Pd, 7% Rh), $/oz |
833 |
933 |
1,028 |
1,100 |
1,153 |
1,182 |
1,206 |
1,230 |
1,127 |
Rough diamond index, $/ct |
197 |
198 |
202 |
202 |
208 |
215 |
219 |
224 |
205 |
Base metals |
|
|
|
|
|
|
|
|
|
Aluminium, $/t |
1,604 |
1,968 |
2,110 |
1,953 |
2,166 |
2,254 |
2,300 |
2,346 |
2,150 |
Bauxite, $/t |
40 |
43 |
42 |
41 |
49 |
51 |
52 |
53 |
48 |
Copper, $/t |
4,867 |
6,170 |
6,532 |
6,000 |
6,367 |
6,606 |
6,739 |
6,875 |
6,300 |
Copper, USc/lb |
221 |
280 |
296 |
272 |
289 |
300 |
306 |
312 |
286 |
Nickel, $/t |
9,599 |
10,404 |
13,130 |
11,530 |
14,285 |
14,680 |
14,975 |
15,277 |
14,000 |
Nickel, USc/lb |
435 |
472 |
596 |
523 |
648 |
666 |
679 |
693 |
635 |
Zinc, $/t |
2,091 |
2,891 |
2,923 |
2,543 |
2,732 |
2,831 |
2,888 |
2,946 |
2,700 |
Zinc, USc/lb |
95 |
131 |
133 |
115 |
124 |
128 |
131 |
134 |
122 |
Lead, $/t |
1,867 |
2,314 |
2,241 |
2,033 |
2,459 |
2,548 |
2,599 |
2,652 |
2,430 |
Cobalt (99.8%), $/lb |
12 |
25 |
33 |
25 |
26 |
26 |
27 |
27 |
25 |
Steelmaking materials |
|
|
|
|
|
|
|
|
|
Iron ore fines (62% Fe, CIF China), $/t |
58 |
71 |
66 |
75 |
67 |
65 |
66 |
68 |
62 |
Iron ore fines (58% Fe, CIF China), $/t |
48 |
52 |
45 |
54 |
52 |
51 |
52 |
53 |
48 |
Iron ore lump premium (62% Fe), $/t |
10 |
15 |
20 |
17 |
13 |
14 |
14 |
14 |
13 |
Freight charges, $/t |
|
|
|
|
|
|
|
|
|
- Australia to China |
4.5 |
6.7 |
7.6 |
8.1 |
7.6 |
7.4 |
7.5 |
7.7 |
7.0 |
- Brazil to China |
9.1 |
14.8 |
18.4 |
19.5 |
18.5 |
17.8 |
18.2 |
18.5 |
17.0 |
- South Africa to China |
6.8 |
11.2 |
13.8 |
14.4 |
13.7 |
13.2 |
13.5 |
13.7 |
12.6 |
Hard coking coal - spot, $/t |
144 |
188 |
206 |
178 |
160 |
157 |
160 |
164 |
150 |
Manganese ore (44%, CIF China), $/mtu |
4.30 |
6.00 |
7.11 |
5.48 |
5.33 |
5.45 |
5.56 |
5.67 |
5.20 |
Ferrochrome (EU), $/lb |
1.0 |
1.5 |
1.4 |
1.2 |
1.3 |
1.3 |
1.3 |
1.4 |
1.3 |
Steel |
|
|
|
|
|
|
|
|
|
China HRC, $/t |
377 |
508 |
564 |
471 |
471 |
484 |
494 |
504 |
461 |
China export Rebar, $/t |
348 |
517 |
580 |
445 |
449 |
460 |
469 |
478 |
438 |
Energy |
|
|
|
|
|
|
|
|
|
Brent crude oil, $/bl |
45 |
55 |
72 |
65 |
60 |
63 |
64 |
65 |
60 |
WTI oil, $/bl |
43 |
51 |
65 |
62 |
57 |
60 |
61 |
62 |
57 |
Henry Hub (US) gas, $/MMBtu |
2.5 |
3.0 |
3.2 |
3.4 |
3.5 |
4.2 |
4.3 |
4.4 |
4 |
Thermal coal (FOB Richard's Bay), $/t |
64 |
85 |
98 |
93 |
86 |
84 |
86 |
87 |
80 |
Uranium, $/lb |
26 |
22 |
25 |
33 |
43 |
47 |
48 |
49 |
45 |
Chemicals |
|
|
|
|
|
|
|
|
|
Ethane (US), $/t |
146 |
184 |
244 |
260 |
374 |
419 |
428 |
436 |
400 |
Ethylene (US), $/t |
585 |
613 |
402 |
548 |
831 |
944 |
963 |
982 |
900 |
Paper & packaging |
|
|
|
|
|
|
|
|
|
Testliner, EUR/t |
432 |
476 |
534 |
532 |
507 |
494 |
499 |
504 |
482 |
Uncoated fine paper, EUR/t |
824 |
815 |
869 |
898 |
873 |
860 |
869 |
878 |
840 |
Fertilisers |
|
|
|
|
|
|
|
|
|
MOP Potash Soluble FOB Saskatchewan, $/t |
228 |
230 |
261 |
289 |
283 |
283 |
289 |
295 |
270 |
Baltic sea Urea granular, $/t |
202 |
220 |
251 |
263 |
269 |
273 |
278 |
284 |
260 |
Baltic DAP, $/t |
357 |
358 |
421 |
434 |
429 |
430 |
439 |
447 |
410 |
Black sea 16-16-16, $/t |
324 |
321 |
318 |
340 |
347 |
353 |
360 |
367 |
337 |
Currency exchange rates |
|
|
|
|
|
|
|
|
|
ZAR/$ |
14.70 |
13.31 |
13.24 |
14.31 |
14.14 |
14.17 |
14.45 |
14.74 |
13.00 |
$/AUD |
0.74 |
0.77 |
0.75 |
0.72 |
0.78 |
0.80 |
0.80 |
0.80 |
0.80 |
$/EUR |
1.11 |
1.13 |
1.18 |
1.17 |
1.21 |
1.22 |
1.22 |
1.22 |
1.20 |
CLP/$ |
676 |
649 |
642 |
689 |
674 |
673 |
687 |
701 |
630 |
BRL/$ |
3.49 |
3.19 |
3.65 |
3.78 |
3.50 |
3.42 |
3.49 |
3.56 |
3.20 |
COP/$ |
3,053 |
2,952 |
2,956 |
3,193 |
3,031 |
3,015 |
3,138 |
3,265 |
2,800 |
RUB/$ |
67 |
58 |
63 |
67 |
68 |
67 |
66 |
66 |
58 |
Inflation |
|
|
|
|
|
|
|
|
|
US consumer price index |
240 |
245 |
251 |
256 |
261 |
266 |
272 |
277 |
|
US inflation |
1.3% |
2.1% |
2.5% |
2.0% |
2.0% |
2.0% |
2.0% |
2.0% |
|
*The above amounts represent the average per calendar year
Source: Bloomberg, Thomson Reuters Data stream, Renaissance Capital estimates
7
vk.com/id446425943
Rusal – BUY
Renaissance Capital
5 February 2019
Rusal
Figure 12: Rusal, $mn (unless otherwise noted)
|
|
|
|
|
|
|
|
|
|
|
|
|
|
|
Rusal |
|
0486.HK |
|
|
|
|
|
Target price, HKD: |
|
|
6.0 |
|||
Market capitalisation, $mn: |
|
6,351 |
|
|
|
|
|
Share price, HKD: |
|
|
3.3 |
|||
Enterprise value, $mn: |
|
13,999 |
|
|
|
|
|
Potential 12-month return: |
|
88% |
||||
|
|
|
|
|
|
|
|
|
|
|
|
|
|
|
Dec-YE |
|
2016 |
2017 |
2018E |
2019E |
2020E |
Dec-YE |
2016 |
2017 |
|
2018E |
2019E |
2020E |
|
Income statement |
|
|
|
|
|
|
|
Balance sheet |
|
|
|
|
|
|
Revenue |
|
7,983 |
9,969 |
10,136 |
9,588 |
10,694 |
|
Net operating assets |
11,377 |
12,139 |
|
12,303 |
12,287 |
12,548 |
Underlying EBITDA |
|
1,489 |
2,120 |
2,240 |
1,671 |
2,209 |
|
Financial instruments |
32 |
-50 |
|
-36 |
-36 |
-36 |
Underlying EBIT |
|
1,024 |
1,607 |
1,738 |
1,154 |
1,634 |
|
Equity |
2,988 |
4,441 |
|
5,285 |
6,315 |
7,772 |
EBIT |
|
1,068 |
1,523 |
1,572 |
1,154 |
1,634 |
|
Minority interest |
0 |
0 |
|
0 |
0 |
0 |
Net interest |
|
-860 |
-855 |
-534 |
-626 |
-576 |
|
Net debt |
8,421 |
7,648 |
|
6,982 |
5,937 |
4,740 |
Equity accounted income |
|
848 |
620 |
1,049 |
918 |
979 |
|
Balance sheet ratios |
|
|
|
|
|
|
Taxation |
|
-175 |
-66 |
-170 |
-90 |
-180 |
|
|
|
|
|
|
|
|
Other |
|
298 |
0 |
0 |
0 |
0 |
|
Gearing (net debt/(net debt+equity)) |
73.8% |
63.3% |
|
56.9% |
48.5% |
37.9% |
Net profit for the year |
|
1,179 |
1,222 |
1,917 |
1,357 |
1,857 |
|
Net debt/(EBITDA+dividends from associat |
4.7x |
2.4x |
|
2.2x |
2.3x |
1.5x |
Underlying earnings |
|
1,179 |
1,222 |
1,917 |
1,357 |
1,857 |
|
RoCE |
8.8% |
12.6% |
|
13.3% |
8.8% |
12.3% |
Underlying EPS, USc |
|
7.76 |
8.04 |
12.62 |
8.93 |
12.22 |
|
RoIC (after tax) |
5.7% |
10.3% |
|
10.8% |
7.5% |
10.3% |
|
|
RoE |
56.3% |
32.9% |
|
39.4% |
23.4% |
26.4% |
||||||
Thomson Reuters consensus EPS, USc |
|
|
|
12.49 |
12.91 |
13.69 |
|
|
|
|
|
|
|
|
DPS declared, USc |
|
1.65 |
1.97 |
2.61 |
2.15 |
2.63 |
|
Cash flow statement |
1,331 |
2,869 |
|
2,365 |
2,754 |
2,786 |
Income statement ratios |
|
|
0.036471 |
|
|
|
|
Operating cash flow |
|
|||||
|
|
|
|
|
|
|
Capex |
-575 |
-842 |
|
-770 |
-850 |
-700 |
|
EBITDA margin |
|
19% |
21% |
22% |
17% |
21% |
|
Other FCF |
508 |
-311 |
|
-65 |
0 |
0 |
EBIT margin |
|
13% |
15% |
16% |
12% |
15% |
|
FCF |
1,264 |
1,717 |
|
1,530 |
1,904 |
2,086 |
EPS growth |
|
111% |
4% |
57% |
-29% |
37% |
|
Equity shareholders' cash |
201 |
1,072 |
|
1,062 |
1,372 |
1,597 |
Dividend payout ratio |
|
21% |
24% |
21% |
24% |
22% |
|
Dividends and share buy backs |
-250 |
-299 |
|
-396 |
-327 |
-400 |
Input assumptions |
|
|
|
|
|
|
|
Surplus (deficit) cash |
-49 |
773 |
|
666 |
1,045 |
1,197 |
|
|
|
|
|
|
|
Cash flow ratios |
|
|
|
|
|
|
|
Aluminium, $/t |
|
1,604 |
1,968 |
2,110 |
1,953 |
2,166 |
|
|
|
|
|
|
|
|
Alumina, $/t |
|
283 |
376 |
485 |
391 |
412 |
|
Working capital days |
77 |
64 |
|
81 |
74 |
72 |
RUB/$ |
|
67 |
58 |
63 |
67 |
68 |
|
Cash conversion |
0.2x |
0.9x |
|
0.6x |
1.0x |
0.9x |
Estimated aluminium breakeven price, $/t |
|
1,341 |
1,588 |
1,658 |
1,629 |
1,719 |
|
FCF yield |
9.3% |
10.4% |
|
12.0% |
15.5% |
18.8% |
Production volumes, kt |
|
|
|
|
|
|
|
Equity shareholders' yield |
3.8% |
12.2% |
|
18.4% |
21.6% |
25.1% |
|
|
|
|
|
|
|
Capex/(EBITDA+Norilsk dividends) |
32.3% |
26.0% |
|
24.3% |
32.5% |
21.9% |
|
Aluminium |
|
|
|
|
|
|
|
Valuation |
|
|
|
|
|
|
Russia Aluminium |
|
3,562 |
3,584 |
3,622 |
3,632 |
3,670 |
|
|
|
|
|
|
|
|
Other |
|
161 |
144 |
148 |
147 |
147 |
|
SoTP DCF valuation and calculation of target price |
|
|
|
$mn |
HKD/sh |
|
Total |
|
3,723 |
3,728 |
3,770 |
3,779 |
3,818 |
|
Aluminium |
|
|
|
|
10,901 |
5.6 |
|
|
|
|
|
|
|
|
Norilsk Nickel |
|
|
|
|
8,493 |
4.4 |
Alumina |
|
|
|
|
|
|
|
Total enterprise value |
|
|
|
|
19,394 |
10.0 |
Ireland |
|
1,967 |
1,938 |
1,925 |
1,970 |
1,970 |
|
Net debt as at 31 December 2017 |
|
|
|
|
-7,648 |
-3.9 |
Jamaica |
|
608 |
582 |
601 |
615 |
615 |
|
Cash used in share buy-backs |
|
|
|
|
0 |
0.0 |
Ukraine |
|
1,510 |
1,675 |
1,693 |
1,733 |
1,733 |
|
Other investments |
|
|
|
|
-50 |
-0.0 |
Russia |
|
2,730 |
2,821 |
2,844 |
2,911 |
2,911 |
|
Minority interest |
|
|
|
|
0 |
0.0 |
Australia (JV) |
|
760 |
755 |
754 |
772 |
772 |
|
Equity value as at 4/2/2019 |
|
|
|
|
11,696 |
6.0 |
Total |
|
7,528 |
7,772 |
7,816 |
8,000 |
8,000 |
|
|
|
|
|
|
|
|
TP |
|
|
|
|
|
6.0 |
||||||||
Bauxite |
|
|
|
|
|
|
|
Share price on 3/2/2019 |
|
|
|
|
|
3.3 |
|
|
|
|
|
|
|
Expected share price return |
|
|
|
|
|
82.9% |
|
Jamaica |
|
2,123 |
1,954 |
2,235 |
2,462 |
2,462 |
|
Plus: expected dividend yield |
|
|
|
|
|
5.3% |
Russia |
|
5,432 |
5,524 |
6,274 |
6,909 |
6,909 |
|
Total implied one-year return |
|
|
|
|
|
88.2% |
Guinea |
|
3,539 |
3,123 |
3,751 |
4,700 |
6,000 |
|
|
|
|
|
|
|
|
Guyana |
|
1,094 |
1,044 |
1,538 |
1,693 |
1,693 |
|
Share price range, HKD: |
|
|
|
|
|
|
Total |
|
12,187 |
11,646 |
13,794 |
15,764 |
17,064 |
|
12-month high on 5/2/2018 |
6.0 |
12-month low on 17/4/2018 |
1.3 |
|||
Nepheline |
|
4,432 |
4,333 |
4,629 |
4,720 |
4,720 |
|
Price move since high |
-45.5% Price move since low |
|
150.4% |
|||
|
|
Calculation of discount rate |
|
|
|
|
|
|
||||||
Aluminium foil and packaging |
|
85 |
101 |
101 |
101 |
101 |
|
|
|
|
|
|
|
|
|
|
WACC |
12.5% |
Cost of debt |
|
|
6.0% |
|||||||
Sales volumes |
|
|
|
|
|
|
|
Risk-free rate |
4.0% |
Tax rate |
|
|
15% |
|
|
|
|
|
|
|
|
Equity risk premium |
8.0% |
After-tax cost of debt |
|
5.1% |
|||
Aluminium, kt |
|
3,818 |
3,955 |
3,650 |
3,779 |
3,818 |
|
Beta |
1.30 |
Debt weighting |
|
20% |
||
Value added products, % of total |
|
44% |
47% |
46% |
46% |
50% |
|
Cost of equity |
14.4% |
Terminal growth rate |
|
2.0% |
||
Contribution to enterprise value of $19bn |
|
|
|
|
|
|
Valuation ratios |
|
|
|
|
|
|
|
|
|
|
|
|
|
Dec-YE |
2016 |
2017 |
|
2018E |
2019E |
2020E |
||
|
|
|
|
|
|
|
|
P/E multiple |
4.4x |
7.2x |
|
3.0x |
4.7x |
3.4x |
Norilsk Nickel |
|
|
|
|
|
|
Dividend yield |
4.8% |
3.4% |
|
6.9% |
5.1% |
6.3% |
|
44% |
|
|
|
|
|
|
|
EV/(EBITDA+Equity income) |
5.8x |
6.0x |
|
3.9x |
4.7x |
3.5x |
|
|
|
|
|
|
|
|
P/B |
1.8x |
2.0x |
|
1.1x |
1.0x |
0.8x |
|
|
|
|
|
|
|
|
NAV per share, USc |
19.7 |
29.2 |
|
34.8 |
41.6 |
51.2 |
|
|
|
|
|
|
|
|
NAV per share, HKD |
1.5 |
2.3 |
|
2.7 |
3.3 |
4.0 |
Aluminium
56%
Source: Bloomberg, Thomson Reuters, Company data, Renaissance Capital estimates
8

vk.com/id446425943
Disclosures appendix
Renaissance Capital
5 February 2019
Rusal
Analysts certification
This research report has been prepared by the research analyst(s), whose name(s) appear(s) on the front page of this document, to provide background information about the issuer or issuers (collectively, the “Issuer”) and the securities and markets that are the subject matter of this report. Each research analyst hereby certifies that with respect to the Issuer and such securities and markets, this document has been produced independently of the Issuer and all the views expressed in this document accurately reflect his or her personal views about the Issuer and any and all of such securities and markets. Each research analyst and/or persons connected with any research analyst may have interacted with sales and trading personnel, or similar, for the purpose of gathering, synthesizing and interpreting market information. If the date of this report is not current, the views and contents may not reflect the research analysts’ current thinking.
Each research analyst also certifies that no part of his or her compensation was, or will be, directly or indirectly related to the specific ratings, forecasts, estimates, opinions or views in this research report. Research analysts’ compensation is determined based upon activities and services intended to benefit the investor clients of Renaissance Securities (Cyprus) Limited and any of its affiliates (“Renaissance Capital”). Like all of Renaissance Capital’s employees, research analysts receive compensation that is impacted by overall Renaissance Capital profitability, which includes revenues from other business units within Renaissance Capital.
Important issuer disclosures
Important issuer disclosures outline currently known conflicts of interest that may unknowingly bias or affect the objectivity of the analyst(s) with respect to an issuer that is the subject matter of this report. Disclosure(s) apply to Renaissance Securities (Cyprus) Limited or any of its direct or indirect subsidiaries or affiliates (which are individually or collectively referred to as “Renaissance Capital”) with respect to any issuer or the issuer’s securities.
A complete set of disclosure statements associated with the issuers discussed in this Report is available using the ‘Stock Finder’ or ‘Bond Finder’ for individual issuers on the Renaissance Capital Research Portal at: http://research.rencap.com/eng/default.asp
United Company Rusal |
Bloomberg: 486 HK |
Renaissance Capital is either a market maker or on a continuous basis has sold to/bought from customers on a principal basis the securities or related securities of the issuer at prices defined by Renaissance Capital.
MMC Norilsk Nickel OJSC |
Bloomberg: MNOD LI |
Renaissance Capital is either a market maker or on a continuous basis has sold to/bought from customers on a principal basis the securities or related securities of the issuer at prices defined by Renaissance Capital.
Investment ratings
Investment ratings may be determined by the following standard ranges: Buy (expected total return of 15% or more); Hold (expected total return of 0-15%); and Sell (expected negative total return). Standard ranges do not always apply to emerging markets securities and ratings may be assigned on the basis of the research analyst’s knowledge of the securities.
Investment ratings are a function of the research analyst’s expectation of total return on equity (forecast price appreciation and dividend yield within the next 12 months, unless stated otherwise in the report). Investment ratings are determined at the time of initiation of coverage of an issuer of equity securities or a change in target price of any of the issuer’s equity securities. At other times, the expected total returns may fall outside of the range used at the time of setting a rating because of price movement and/or volatility.
Such interim deviations will be permitted but will be subject to review by Renaissance Capital’s Research Management.
Where the relevant issuer has a significant material event with further information pending or to be announced, it may be necessary to temporarily place the investment rating Under Review. This does not revise the previously published rating, but indicates that the analyst is actively reviewing the investment rating or waiting for sufficient information to re-evaluate the analyst’s expectation of total return on equity.
Where coverage of the relevant issuer is due to be maintained by a new analyst, on a temporary basis the relevant issuer will be rated as Coverage in Transition. Previously published investment ratings should not be relied upon as they may not reflect the new analysts’ current expectations of total return. While rated as Coverage in Transition, Renaissance Capital may not always be able to keep you informed of events or provide background information relating to the issuer.
If issuing of research is restricted due to legal, regulatory or contractual obligations publishing investment ratings will be Restricted. Previously published investment ratings should not be relied upon as they may no longer reflect the analysts’ current expectations of total return. While restricted, the analyst may not always be able to keep you informed of events or provide background information relating to the issuer.
Where Renaissance Capital has neither reviewed nor revised its investment ratings on the relevant issuer for a period of 180 calendar days, coverage shall be discontinued.
Where Renaissance Capital has not provided coverage of an issuer for a period of 365 calendar days, coverage shall be discontinued.
Where Renaissance Capital has not expressed a commitment to provide continuous coverage and/or an expectation of total return, to keep you informed, analysts may prepare reports covering significant events or background information without an investment rating (Not Covered).
Your decision to buy or sell a security should be based upon your personal investment objectives and should be made only after evaluating the security’s expected performance and risk.
Renaissance Capital reserves the right to update or amend its investment ratings in any way and at any time it determines.
9

vk.com/id446425943
Renaissance Capital
5 February 2019
Rusal
Renaissance Capital equity research distribution of ratings
Investment Rating Distribution |
|
Investment Banking Relationships* |
Renaissance Capital Research |
|
Renaissance Capital Research |
Buy |
138 |
49% |
Hold |
99 |
35% |
Sell |
33 |
12% |
Under Review |
4 |
1% |
Restricted |
0 |
0% |
Cov. in Trans. |
10 |
4% |
Buy |
6 |
75% |
Hold |
2 |
25% |
Sell |
0 |
0% |
Under Review |
0 |
0% |
Restricted |
0 |
0% |
Cov. in Trans. |
0 |
0% |
|
|
|
284 |
|
|
|
|
|
|
|
|
8 |
|
|
|
|
|
|
|
|
|
|
|
|
|
|
|
*Companies from which RenCap has received compensation within the past 12 months. |
|
|
|
|
|
|
|
|
|
|
|
|
|
|
|||||||||||||
NR – Not Rated |
|
|
|
|
|
|
|
|
|
|
|
|
|
|
|
|
|
|
|
|
|
|
|
|
|
||
UR – Under Review |
|
|
|
|
|
|
|
|
|
|
|
|
|
|
|
|
|
|
|
|
|
|
|
|
|
||
RUSAL share price, target price and rating history |
|
|
|
|
|
|
|
|
|
|
|
|
|
|
|
|
|
|
|
|
|||||||
|
|
Buy |
|
|
|
|
Hold |
|
|
|
|
|
Sell |
|
|
|
|
|
|
Not covered |
|
|
|
|
Cov. in Trans. |
||
|
|
Under Review |
|
|
|
Restricted |
|
|
|
|
|
Suspended |
|
|
|
|
|
Target Price |
|
|
|
|
Last Price |
||||
10 |
|
|
|
|
|
|
|
|
|
|
|
|
|
|
|
|
|
|
|
|
|
|
|
|
|
|
100% |
8 |
|
|
|
|
|
|
|
|
|
|
|
|
|
|
|
|
|
|
|
|
|
|
|
|
|
|
80% |
6 |
|
|
|
|
|
|
|
|
|
|
|
|
|
|
|
|
|
|
|
|
|
|
|
|
|
|
60% |
4 |
|
|
|
|
|
|
|
|
|
|
|
|
|
|
|
|
|
|
|
|
|
|
|
|
|
|
40% |
2 |
|
|
|
|
|
|
|
|
|
|
|
|
|
|
|
|
|
|
|
|
|
|
|
|
|
|
20% |
0 |
Mar-16 |
Apr-16 May-16 |
Jun-16 Jul-16 |
|
Sep-16 Oct-16 |
Nov-16 |
Dec-16 Jan-17 Feb-17 |
Mar-17 |
Apr-17 |
|
Jun-17 |
Jul-17 |
|
Oct-17 |
Nov-17 |
Dec-17 |
Jan-18 |
|
Mar-18 |
Apr-18 May-18 Jun-18 Jul-18 |
|
|
Oct-18 |
Nov-18 |
Dec-18 |
Jan-19 |
0% |
Feb-16 |
Aug-16 |
May-17 |
Aug-17 Sep-17 |
Feb-18 |
Aug-18 |
Sep-18 |
Feb-19 |
||||||||||||||||||||
|
|
|
|
|
|
|
|
|
|
|
|
|
|
|
|
|
|
|
|
|
|
|
|
|
|
Source: Bloomberg |
|
Norilsk Nickel share price, target price and rating history |
|
|
|
|
|
|
|
|
|
|
|
|
|
|
|
|
|
|
|
||||||||
|
|
Buy |
|
|
|
|
Hold |
|
|
|
|
|
Sell |
|
|
|
|
|
|
Not covered |
|
|
|
|
Cov. in Trans. |
||
|
|
Under Review |
|
|
|
Restricted |
|
|
|
|
|
Suspended |
|
|
|
|
|
Target Price |
|
|
|
|
Last Price |
||||
30 |
|
|
|
|
|
|
|
|
|
|
|
|
|
|
|
|
|
|
|
|
|
|
|
|
|
|
100% |
25 |
|
|
|
|
|
|
|
|
|
|
|
|
|
|
|
|
|
|
|
|
|
|
|
|
|
|
80% |
|
|
|
|
|
|
|
|
|
|
|
|
|
|
|
|
|
|
|
|
|
|
|
|
|
|
|
|
20 |
|
|
|
|
|
|
|
|
|
|
|
|
|
|
|
|
|
|
|
|
|
|
|
|
|
|
60% |
15 |
|
|
|
|
|
|
|
|
|
|
|
|
|
|
|
|
|
|
|
|
|
|
|
|
|
|
|
|
|
|
|
|
|
|
|
|
|
|
|
|
|
|
|
|
|
|
|
|
|
|
|
|
|
40% |
|
10 |
|
|
|
|
|
|
|
|
|
|
|
|
|
|
|
|
|
|
|
|
|
|
|
|
|
|
|
|
|
|
|
|
|
|
|
|
|
|
|
|
|
|
|
|
|
|
|
|
|
|
|
|
|
|
|
5 |
|
|
|
|
|
|
|
|
|
|
|
|
|
|
|
|
|
|
|
|
|
|
|
|
|
|
20% |
|
|
|
|
|
|
|
|
|
|
|
|
|
|
|
|
|
|
|
|
|
|
|
|
|
|
|
|
0 |
|
Apr-16 May-16 |
Jun-16 Jul-16 |
|
Sep-16 Oct-16 |
|
|
|
Apr-17 |
|
|
Jul-17 |
|
Oct-17 |
|
|
|
|
|
Apr-18 May-18 Jun-18 Jul-18 |
|
|
Oct-18 |
|
|
|
0% |
Feb-16 |
Mar-16 |
Aug-16 |
Nov-16 |
Dec-16 Jan-17 Feb-17 |
Mar-17 |
May-17 |
Jun-17 |
Aug-17 Sep-17 |
Nov-17 |
Dec-17 |
Jan-18 |
Feb-18 |
Mar-18 |
Aug-18 |
Sep-18 |
Nov-18 |
Dec-18 |
Jan-19 |
Feb-19 |
||||||||
Source: Bloomberg
10