

PWC - capital markets 2030_watermark
.pdfvk.com/id446425943
Capital Markets in 2030
The future of equity capital markets
Written by

vk.com/id446425943
Foreword
Ross Hunter
IPO Centre Leader
Partner, PwC UK
Welcome to Capital Markets in 2030, a report exploring the changing dynamics in global equity capital markets.
Our initial survey of global executives was conducted in 2011. At that time, strong growth was anticipated in emerging economies and, by association, in their equity markets, to the point that they were expected to become the leading global exchanges for new issues in the medium term. We can now see that the New York, London and Hong Kong exchanges are proving to be significantly more resilient than had been anticipated in 2011, enjoying strong momentum in recent years and now expected to maintain their lead.
Although the growth of emerging market exchanges has been more subdued than anticipated in 2011, Chinese and Indian companies are still expected to dominate future new issues. While further progress in the key emerging market economies will support the growth of their exchanges, the pace of the shift in balance to these exchanges has perhaps moderated.
Technology companies have featured strongly in initial public offering (IPO) activity in recent years. This is set to last, as the sector continues to generate significant demand for equity in public markets, and the competition between exchanges to attract ‘unicorns’ and ‘new economy’ companies intensifies, particularly between the US and China (mainland China and Hong Kong).
New York, London and Hong Kong exchanges are proving to be significantly more resilient than had been anticipated in 2011, enjoying strong momentum
in recent years and now expected to maintain their lead.
Ross Hunter
IPO Centre Leader
Alongside this, the range of capital raising options has increased significantly in recent years as the established private equity and venture capital pools have grown, and as they are complemented by numerous alternatives.
Ultimately, in our view, the public equity markets remain the natural destination for many companies, and can play a vital role in the healthy functioning of the global economy. The challenge for the exchanges is how they can adapt to the changing landscape, competing but also collaborating with one another, and complementing other financing alternatives to support the provision of capital across the world.
For companies, the choice of credible exchanges for public listings, as well as a range of private funding options, will continue to expand, offering ever more alternatives when they seek to raise capital.

vk.com/id446425943
Contents
Executive summary |
4 |
Then and now: Are the markets on trend? |
5 |
Which sectors and where? |
6 |
Which markets attract foreign issuers? |
10 |
Looking to 2030 |
12 |
Which countries will lead capital raising in 2030? |
12 |
What drives the choice of exchange? |
15 |
What is holding back EM exchanges? |
16 |
Are public equity markets under threat? |
18 |
Private markets: To rival or to complement? |
19 |
Conclusion |
21 |
About this report |
22 |
vk.com/id446425943
Executive summary
Global capital markets reached new post–financial crisis highs in 2018. This expansion was largely driven by the US economy. Companies now have to consider a growing range of issues that may affect the shape of future capital market activity, such as an increasing focus by regulators and investors on sustainability and governance, and mounting concerns around deglobalisation, rising populism and greater geopolitical risks.
70%
of respondents agree that most successful companies would still choose to go public at some point in their life cycle.
In 2018, The Economist Intelligence Unit conducted a followup to a 2011 survey on behalf of PwC, asking nearly 400 executives at companies from across the globe for their views on the factors that are defining the development of global equity capital markets. This report marks the evolution of these industry leaders’ views.
The 2011 report reflected a degree of post–financial crisis optimism, particularly for emerging market (EM) equity markets. Given the growth dynamics at that time, expectations were for EMs — particularly China and India — to increasingly dominate global equity markets in terms of issuance, sources of capital and the influence of their stock exchanges. The latest survey does demonstrate a continued recognition of the growing role of EMs, but also reflects a sometimes radical modification of business leaders’ perspectives.
•Although developed market (DM) exchanges continue to be favoured for listing, their lead over EMs has narrowed significantly since 2011. The dominance of the New York Stock Exchange (NYSE), the Nasdaq, the London Stock Exchange (LSE) and the Hong Kong Stock Exchange (HKEX) is not as great as before, with Indian exchanges, Shanghai’s SSE and Brazil’s Bovespa moving up the ranks, in recognition of the growing maturity of EM exchanges. Other exchanges that became more attractive are the Australian Securities Exchange (ASX) and Singapore Exchange (SGX), reflecting the growing importance of the Southeast Asia region.
55%
of respondents feel the most attractive private funding option is private equity.
•When looking towards 2030, although our respondents still expect companies from China and India to dominate issuance, views regarding the leading exchanges have changed dramatically. The same four exchanges, NYSE, Nasdaq, LSE and HKEX, are expected to maintain their leading position, reflecting their unmatched levels of resilience and liquidity advantages. In 2011, the medium-term view of the top four exchange destinations was very different — with Shanghai in the top spot, Indian exchanges at number three and Brazil’s Bovespa in fourth place.
•Liquidity remains the top priority (selected as most important by 49% of respondents) when choosing a listing location. Respondents are increasingly focused on valuations (32%) and concerned about the costs of listing (29%). Meanwhile, stock market ecosystems and the size of the investor base have become relatively less important to participants.
•Companies’ options for raising capital have increased.
Some 76% of respondents believe that companies in both DMs and EMs have more choices of both public and private financing routes.
•Private markets are seen as complementary to public markets, not as rivals. Seventy percent of respondents feel that the traditional public listing is becoming a less important source of funding. The most attractive private funding option, selected by 55% of respondents, is private equity. Notwithstanding that finding, 70% agree that most successful companies would still choose to go public at some point in their life cycle.
4 | Capital Markets in 2030 | PwC
vk.com/id446425943
Then and now: Are the markets on trend?
In 2011, survey respondents thought that EM exchanges, most notably China and India, would grow rapidly to rival — if not displace — DM exchanges, particularly London and New York.
The expectation was of high growth in the market capitalisation of companies listed on EM stock exchanges. This was based on overall market bullishness about the rise of EMs and their
increasing share of global GDP, coupled with deeper domestic capital capacity and additional opportunities for access by foreign investors. The market capitalisation of companies
on Chinese exchanges was forecast to outstrip those on US exchanges by 2030. Evidence suggests that EMs are falling behind on this trend line.
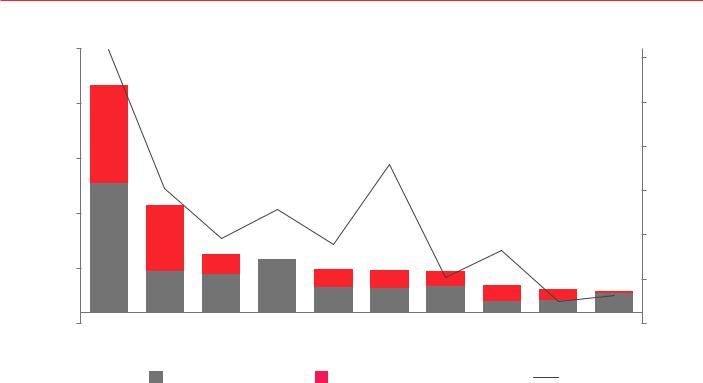
Figure 1: Ten largest exchanges by market capitalisation as at December 2018
|
309 |
|
|
|
|
|
|
|
|
|
|
|
|
25,000 |
|
|
|
|
|
|
|
|
|
300 |
|
|
|
|
|
|
|
|
|
|
|
|
|
|
|
20,000 |
|
|
|
|
|
|
|
|
|
250 |
|
|
|
|
|
|
|
180 |
|
|
|
|
200 |
IPO |
Market cap US$bn |
15,000 |
|
|
|
|
|
|
|
|
US$bn 18-2011 value |
||
152 |
|
|
|
|
|
|
|
|
|
|||
|
|
|
|
|
|
|
|
|
|
|||
|
|
|
129 |
|
|
|
|
|
|
150 |
||
10,000 |
|
96 |
|
89 |
|
|
|
|
|
|
||
|
|
|
|
|
82 |
|
|
100 |
||||
|
|
|
|
|
|
|
|
|
||||
|
|
|
|
|
|
52 |
|
|
|
|
||
|
5,000 |
|
|
|
|
|
|
|
|
|
|
|
|
|
|
|
|
|
|
|
25 |
31 |
50 |
|
|
|
|
|
|
|
|
|
|
|
|
|||
|
0 |
NASDAQ |
Japan |
LSE |
Shanghai |
Hong |
Euronext |
Shenzhen |
BSE |
TMX |
- |
|
|
NYSE |
|
|
|||||||||
|
|
|
|
|
|
Kong |
|
|
|
|
|
|
|
|
2011 market cap |
|
Incremental 2018 market cap |
IPO values |
|
|
|||||
Source: World Federation of Exchanges (WFE), exchange data (for LSE only), Dealogic
Note: WFE data includes only domestic market capitalisation
The slower-than-expected growth of EM exchanges is demonstrated when comparing the sizes of the US and Greater China exchanges now and in 2011. The combined US domestic market caps total US$30.4tn; for mainland China and Hong Kong, they total US$10.1tn. In 2011, it was US$15.6tn and US$5.7tn, respectively. US exchanges are now three times the size of their Chinese counterparts, compared with 2.7 times in 2011. The growth of the US market has outstripped expectations, while the growth of China and other EMs has lagged.
In terms of capital raised, the US, London and Hong Kong remain the pre-eminent international centres; mainland China exchanges also show strong growth.
In addition to representing a significant proportion of the new capital raised, the US market has been the major beneficiary of a dramatic increase in technology-related stock valuations. Largely as a result of that, the US S&P 500 index has doubled since 2007, although prices have come under pressure since late autumn 2018.
PwC | Capital Markets in 2030 | 5

vk.com/id446425943
Which sectors and where?
Initial public offering (IPO) activity since 2011 has been heavily influenced by the rise of ‘new economy’ companies. As reflected in Figure 2, technology and financials dominated the listing activity on the leading exchanges in 2016–18. Other notable listings include the IPO of Softbank, which raised US$21.3bn on the Tokyo Stock Exchange in December 2018, the US$5.2bn IPO of Siemens Healthineers and the US$4.4bn IPO of Knorr-Bremse on the Deutsche Börse.
Figure 2: Top IPOs by sector in London, New York, Hong Kong and Shanghai, 2016–18
London 

New York 

Hong Kong 

Shanghai 

0% 10% 20% 30% 40% 50% 60% 70% 80% 90%100%
 Financial
  Technology
  Other
Other
Source: Dealogic
The geographical and cultural proximity for mainland investors to invest via the Stock Connect channel should entice companies to list in Hong Kong.
James Fok
Head of Group Strategy
HKEX
6 | Capital Markets in 2030 | PwC

vk.com/id446425943
Figure 3: Top IPOs in London, New York, Hong Kong and Shanghai in 2016–18
London
Year |
IPO |
Total amount US$m |
Sector |
2018 |
Aston Martin Lagonda Global Holdings plc |
1,407 |
Automotive |
|
Smithson Investment Trust plc |
1,084 |
Finance |
|
Vivo Energy plc |
819 |
Oil & Gas |
|
Avast plc |
816 |
Computers & Electronics |
|
Nova Ljubljanska Banka |
764 |
Finance |
2017 |
Allied Irish Banks Plc |
3,832 |
Finance |
|
EN+ Group plc |
1,500 |
Utility & Energy |
|
J2 Acquisition Ltd |
1,210 |
Finance |
|
Sherborne Investors (Guernsey) C Ltd |
906 |
Finance |
|
BioPharma Credit plc |
762 |
Finance |
2016 |
ConvaTec Group plc |
1,939 |
Healthcare |
|
CYBG plc |
566 |
Finance |
|
Metro Bank plc |
564 |
Finance |
|
Countryside Properties plc |
506 |
Real Estate/Property |
|
Civitas Social Housing plc |
436 |
Real Estate/Property |
New York (NYSE and Nasdaq) |
|
|
|
Year |
IPO |
Total amount US$m |
Sector |
2018 |
AXA Equitable Holdings Inc |
3,157 |
Insurance |
|
PagSeguro Digital Ltd |
2,606 |
Computers & Electronics |
|
iQIYI Inc |
2,424 |
Telecommunications |
|
Pinduoduo Inc |
1,743 |
Computers & Electronics |
|
Elanco Animal Health Inc |
1736 |
Healthcare |
2017 |
Snap Inc |
3,910 |
Computers & Electronics |
|
Altice USA Inc |
2,152 |
Telecommunications |
|
Invitation Homes Inc |
1,771 |
Real Estate/Property |
|
Loma Negra CIASA |
1,097 |
Construction/Building |
|
Silver Run Acquisition Corp II |
1,035 |
Finance |
2016 |
ZTO Express (Cayman) Inc |
1,406 |
Transportation |
|
LINE Corp |
1,322 |
Computers & Electronics |
|
Athene Holding Ltd |
1,242 |
Insurance |
|
MGM Growth Properties LLC |
1,208 |
Real Estate/Property |
|
US Foods Holding Corp |
1,176 |
Food & Beverage |
PwC | Capital Markets in 2030 | 7

vk.com/id446425943
Hong Kong
Year |
IPO |
Total amount US$m |
Sector |
|
2018 |
China Tower Corp Ltd |
7,491 |
Telecommunications |
|
|
Xiaomi Corp |
5,430 |
Telecommunications |
|
|
Meituan Dianping |
4,222 |
Computers & Electronics |
|
|
Ping An Healthcare & Technology Co Ltd |
1,118 |
Computers & Electronics |
|
|
Jiangxi Bank Co Ltd |
1,095 |
Finance |
|
2017 |
ZhongAn Online P & C Insurance Co Ltd |
1,754 |
Insurance |
|
|
China Literature Ltd |
1,227 |
Computers & Electronics |
|
|
Guangzhou Rural Commercial Bank Co Ltd |
1,191 |
Finance |
|
|
Zhongyuan Bank Co Ltd |
1,190 |
Finance |
|
|
Yixin Group Ltd |
867 |
Computers & Electronics |
|
2016 |
Postal Savings Bank of China Co Ltd |
7,625 |
Finance |
|
|
China Resources Pharmaceutical Group Ltd |
1,941 |
Healthcare |
|
|
China Zheshang Bank Co Ltd |
1,938 |
Finance |
|
|
BOC Aviation Ltd |
1,126 |
Finance |
|
|
China Securities Co Ltd |
1,057 |
Finance |
|
Shanghai |
|
|
|
|
|
|
|
|
|
Year |
IPO |
Total amount US$m |
Sector |
|
|
|
|
|
|
2018 |
Foxconn Industrial Internet Co Ltd |
4,257 |
Computers & Electronics |
|
|
Hebei Yangyuan ZhiHui Beverage Co Ltd |
669 |
Food & Beverage |
|
|
Jiangsu Financial Leasing Co Ltd |
636 |
Finance |
|
|
Bank of Changsha Co Ltd |
399 |
Finance |
|
|
Bank of Chengdu Co Ltd |
385 |
Finance |
|
2017 |
Caitong Securities Co Ltd |
620 |
Finance |
|
|
Huaneng Lancang River Hydropower Co Ltd |
589 |
Utility & Energy |
|
|
Zheshang Securities Co Ltd |
409 |
Finance |
|
|
Shandong Publishing & Media Co Ltd |
409 |
Publishing |
|
|
Jiangsu Provincial Agricultural Reclamation & Develop- |
351 |
Agribusiness |
|
|
ment Co Ltd |
|||
|
|
|
|
|
2016 |
Bank of Shanghai Co Ltd |
1,599 |
Finance |
|
|
Bank of Jiangsu Co Ltd |
1,095 |
Finance |
|
|
Huaan Securities Co Ltd |
744 |
Finance |
|
|
Triangle Tyre Co Ltd |
661 |
Automotive |
|
|
Bank of Guiyang Co Ltd |
640 |
Finance |
|
Source: Dealogic
8 | Capital Markets in 2030 | PwC

vk.com/id446425943
In terms of IPO values per exchange, there has been a significant shift back to DMs over the past seven years. The combined value of Shanghai, Shenzhen and Hong Kong IPOs in 2016–18 was US$142.5bn; for NYSE and Nasdaq, it was marginally less, at US$138.6bn. For 2009–11, the three-year period preceding our previous survey, the figures were US$250.1bn and US$128.9bn, respectively.
Hong Kong IPO proceeds significantly outweighed Shanghai and Shenzhen combined IPO funds raised in 2018, although for the 2016–18 period, mainland China exchanges marginally led the way. This makes it clear that Chinese companies are increasingly finding access to sufficient sources of capital on the mainland. As noted by James Fok, Head of Group Strategy at the HKEX, however, the Hong Kong route offers additional advantages to company founders in terms of ease of sell-down and political de-risking. He also says that “the geographical and cultural proximity for mainland investors to invest via the Stock Connect channel should entice companies to list in Hong Kong.”
The new technology wave and its impact on global capital markets
Looking to 2030, PwC anticipates that technology will remain the most important sector.
Historically, the US market has been a more attractive environment for technology companies, with better valuations and a more knowledgeable investor base, attracting the lion’s share of Chinese technology IPOs, including Alibaba’s recordbreaking US$25bn IPO in 2014. Increasing efforts by leading financial centres to win over such companies will continue to intensify competition between the New York and China (mainland China and Hong Kong) exchanges in particular. Listings of companies such as Xiaomi and Meituan in Hong Kong in 2018 are evidence of this.
A number of recent market and regulatory developments can be expected to help attract more IPOs to Hong Kong and mainland Chinese exchanges, away from the US market:
•The amendment by HKEX of IPO rules in April 2018 to allow dual-class shares for listing companies gives certain shareholders, such as company founders, voting power beyond the proportion of their equity holding. This is popular with ‘new economy’ companies and was previously available only in the US.
•Changes to the HKEX listing rules to relax the three-year profitability requirements for biotech companies paved the way for more of these firms to list in Hong Kong rather than the long-established US market.
•Mainland China is now allowing global technology companies easier access to domestic investors. Authorities have endorsed the Chinese depositary receipts scheme, which will allow Chinese investors to hold a form of shares in firms listed abroad. This scheme is currently available only to the largest companies.
•The Shanghai exchange is moving to a registration process prior to listing, similar to Hong Kong and the US, which is expected to reduce the current lengthy wait for new issuers. Notably, in January 2019 the exchange unveiled trading rules for its much anticipated Technology Innovation Board. It will now allow unprofitable tech firms, including pre-revenue biotech startups, as well as the companies with a dualclass shareholding structure, to list on the new board, giving the Shanghai bourse greater freedom to attract promising technology startups away from New York and Hong Kong.
If local regulatory constraints are alleviated, domestic markets might prove more attractive for fast-growing Chinese
companies, given how well Chinese investors understand these companies and the potential depth of their home market.
PwC | Capital Markets in 2030 | 9

vk.com/id446425943
Which markets attract foreign issuers?
When survey respondents were asked which exchanges they think issuers consider beyond their home exchange when planning an IPO now, DM exchanges continued to dominate, although the proportion favouring EM exchanges has increased significantly since 2011 (see Figure 4).
Figure 4: Which of the following exchanges do you think issuers consider (beyond their home exchange) now when planning an IPO?
NYSE |
|
|
|
|
|
|
|
|
|
|
|
|
|
|
|
|
38% |
|
|
|
|
|
|
|
|
|
|
|
|
|
|
|
|
||
London Stock Exchange |
|
|
|
|
|
|
|
|
|
|
|
|
|
|
|
34% |
|
|
|
|
|
|
|
|
|
|
|
|
|
|
|
|
|
||
Nasdaq |
|
|
|
|
|
|
|
|
|
|
|
|
|
|
32% |
|
|
|
|
|
|
|
|
|
|
|
|
|
|
|
|
|
|||
Hong Kong Stock Exchange |
|
|
|
|
|
|
|
|
|
|
|
|
|
22% |
|
|
|
|
|
|
|
|
|
|
|
|
|
|
|
|
|
|
|
||
Indian exchanges (Bombay Stock Exchange and |
|
|
|
|
|
|
|
|
|
|
|
|
18% |
|
|
|
|
|
|
|
|
|
|
|
|
|
|
|
|
|
|
|
|
||
National Stock Exchange of India) |
|
|
|
|
|
|
|
|
|
|
|
|
|
|
|
|
|
|
|
|
|
|
|
|
|
|
|
|
17% |
|
|
|
|
||
Euronext |
|
|
|
|
|
|
|
|
|
|
|
|
|
|
|
||
|
|
|
|
|
|
|
|
|
|
|
|
|
|
|
|||
Australian Securities Exchange |
|
|
|
|
|
|
|
|
|
|
15% |
|
|
|
|
||
|
|
|
|
|
|
|
|
|
|
|
|
|
|
||||
Deutsche Börse |
|
|
|
|
|
|
|
|
|
14% |
|
|
|
|
|
||
|
|
|
|
|
|
|
|
|
|
|
|
|
|
||||
Shanghai Stock Exchange |
|
|
|
|
|
|
|
|
13% |
|
|
|
|
|
|
||
|
|
|
|
|
|
|
|
|
|
|
|
|
|
||||
Johannesburg Stock Exchange |
|
|
|
|
|
|
|
12% |
|
|
|
|
|
|
|
||
|
|
|
|
|
|
|
|
|
|
|
|
|
|
||||
Singapore Exchange |
|
|
|
|
|
|
11% |
|
|
|
|
|
|
|
|||
|
|
|
|
|
|
|
|
|
|
|
|
|
|||||
Mexican Bolsa |
|
|
|
|
|
10% |
|
|
|
|
|
|
|
|
|
||
|
|
|
|
|
|
|
|
|
|
|
|
|
|
||||
Bovespa (Brazil) |
|
|
|
|
9% |
|
|
|
|
|
|
|
|
|
|
||
|
|
|
|
|
|
|
|
|
|
|
|
|
|
||||
Nigeria Stock Exchange |
|
|
|
5% |
|
|
|
|
|
|
|
|
|
|
|
|
|
|
|
|
|
|
|
|
|
|
|
|
|
|
|
|
|
||
Toronto Stock Exchange |
|
|
4% |
|
|
|
|
|
|
|
|
|
|
|
|
|
|
|
|
|
|
|
|
|
|
|
|
|
|
|
|
|
|||
Tokyo Stock Exchange |
|
2% |
|
|
|
|
|
|
|
|
|
|
|
|
|
|
|
|
|
|
|
|
|
|
|
|
|
|
|
|
|
|
|||
Moscow Exchange |
|
2% |
|
|
|
|
|
|
|
|
|
|
|
|
|
|
|
|
|
|
|
|
|
|
|
|
|
|
|
|
|
|
|||
Korea Exchange |
|
2% |
|
|
|
|
|
|
|
|
|
|
|
|
|
|
|
|
|
|
|
|
|
|
|
|
|
|
|
|
|
|
|||
|
|
|
|
|
|
|
|
|
|
|
|
|
|
|
|
|
|
Source: The Economist Intelligence Unit
The biggest gains were for Indian exchanges, with 18% selecting those now versus 5% in 2011; Shanghai increased from 4% to 13%; and Brazil’s Bovespa was selected by 9% today versus 5% in 2011. Other exchanges that became more attractive were Australian Securities Exchange (ASX) (from 5% to 15%) and Singapore Exchange (SGX) (from 6% to 11%). This change in view since 2011 reflects the strong performance of the Indian market, particularly in 2017 and 2018, and the growing importance of ASX and SGX as regional hubs for Southeast Asia.
Although Greater China remains the primary Asian market, India has seen significant increases in IPO activity after a period of market downturn. India may also benefit from concerns by Asian equity investors over the US’s and China’s growing trade rift, as India is less involved in regional supply chains than other major Asian countries such as China and South Korea.
10 | Capital Markets in 2030 | PwC