

Oil_and_Gas_Weekly-261118(1)_watermark
.pdfvk.com/id446425943
Oil & Gas
Weekly Monitor
Price performance
Russian oil & gas stocks were down 2% on average last week, underperforming the RTS Index (unchanged) and EE refiners (+2%), in line with global oil & gas stocks (- 2%) and outperforming the Brent oil price (-7%). The two best-performing stocks in our sector universe were PKN ORLEN (+6%) and Grupa LOTOS (+5%). The worstperforming stocks were Gazprom Neft (-5%) and Tatneft prefs (-4%). On a YtD basis, the two best performers are NOVATEK (+65%) and Tatneft commons (+56%).
Gazprom issues new 2019 capex guidance
On 22 November, Gazprom announced its 2019 headline investment budget of RUB1,325bn ($20.0bn). As usual, this estimate excludes the capex budget of its fully consolidated Gazprom Neft ($5.2bn) and utilities business ($1.0bn), the inclusion of which results in a total investment plan of $26.2bn, 9% below our current estimate of $28.9bn (down 13% YoY). Historically, there is little confidence in Gazprom’s capex estimates as they tend to be revised upwards regularly. For example, Gazprom’s original RUB1,279bn headline investment budget for 2018 (approved last December) was revised upwards by 17% in October. We therefore leave our 2019 capex estimate of $28.9bn unchanged.
Chart of the week
Declining oil prices and a higher MoM export duty ($20.8/bl in November vs $18.8/bl in October) are depressing the profitability of Russia’s oil producers. Figure 1 shows that the netback to Nizhnevartovsk (West Siberia) declined to $33.5/bl last week, down 33% on 3Q18, while normalised upstream FCF is barely positive at $1/bl, down from a record-high $15/bl seen in early October. A $2.3/bl lower export duty starting from 1 December should support the upstream profitability of Russian oil producers, we think.
Figure 1: Urals oil price netback to Nizhnevartovsk vs normalised FCF*, $/bl
Netback to Nizhnevartovsk |
|
Normalised FCF, rhs |
|
65 |
|
|
|
|
|
|
|
|
|
|
|
|
|
|
|
|
|
|
|
|
|
16 |
60 |
|
|
|
|
|
|
|
|
|
|
|
|
|
|
|
|
|
|
|
|
|
14 |
55 |
|
|
|
|
|
|
|
|
|
|
|
|
|
|
|
|
|
|
|
|
|
12 |
|
|
|
|
|
|
|
|
|
|
|
|
|
|
|
|
|
|
|
|
|
|
|
50 |
|
|
|
|
|
|
|
|
|
|
|
|
|
|
|
|
|
|
|
|
|
10 |
|
|
|
|
|
|
|
|
|
|
|
|
|
|
|
|
|
|
|
|
|
|
|
45 |
|
|
|
|
|
|
|
|
|
|
|
|
|
|
|
|
|
|
|
|
|
8 |
40 |
|
|
|
|
|
|
|
|
|
|
|
|
|
|
|
|
|
|
|
|
|
|
|
|
|
|
|
|
|
|
|
|
|
|
|
|
|
|
|
|
|
|
|
|
|
35 |
|
|
|
|
|
|
|
|
|
|
|
|
|
|
|
|
|
|
|
|
|
6 |
|
|
|
|
|
|
|
|
|
|
|
|
|
|
|
|
|
|
|
|
|
|
|
30 |
|
|
|
|
|
|
|
|
|
|
|
|
|
|
|
|
|
|
|
|
|
4 |
|
|
|
|
|
|
|
|
|
|
|
|
|
|
|
|
|
|
|
|
|
|
|
25 |
|
|
|
|
|
|
|
|
|
|
|
|
|
|
|
|
|
|
|
|
|
2 |
20 |
Feb-17 |
Mar-17 |
Apr-17 |
May-17 |
|
|
|
|
Oct-17 |
|
|
|
Feb-18 |
Mar-18 |
Apr-18 |
May-18 |
|
|
|
|
Oct-18 |
- |
Jan-17 |
Jun-17 |
Jul-17 |
Aug-17 |
Sep-17 |
Nov-17 |
Dec-17 |
Jan-18 |
Jun-18 |
Jul-18 |
Aug-18 |
Sep-18 |
Nov-18 |
*We calculate normalised FCF by assuming average lifting cost of $4/bl, average MET discount of 15% and an average capex of $9/bl.
Source: Argus, Renaissance Capital estimates
Sector update
Equity Research 26 November 2018
Oil & Gas Russia
Alexander Burgansky +44 (207) 005-7982 ABurgansky@rencap.com
Oleg Chistyukhin
+7 (495) 258-7770 x4073 OChistyukhin@rencap.com
Richard Wisentaner
+44 (207) 005-7594 x8954 RWisentaner@rencap.com
Gazprom (BUY) |
|
GAZP RX |
TP/Current Price, RUB |
|
220.0/153.9 |
Upside Potential, % |
|
42.9 |
|
|
|
LUKOIL (BUY) |
|
LKOH RX |
TP/Current Price, RUB |
|
5,600.0/4,813. |
Upside Potential, % |
|
16.3 |
|
|
|
NOVATEK (HOLD) |
|
NVTK RX |
TP/Current Price, RUB |
|
1070.0/1124.0 |
Upside Potential, % |
|
(4.8) |
|
|
|
Rosneft (BUY) |
|
ROSN RX |
TP/Current Price, RUB |
|
550.0/411.1 |
Upside Potential, % |
|
33.8 |
|
|
|
Gazprom Neft (HOLD) |
|
SIBN RX |
TP/Current Price, RUB |
|
360.0/362.8 |
Upside Potential, % |
|
(0.8) |
|
|
|
SurgutNG (HOLD / BUY) |
SNGS RX |
SNGSP RX |
TP/Current Price, RUB |
110.0/27.3 |
110.0/37.5 |
Upside Potential, % |
303.2 |
193.5 |
|
|
|
Tatneft (HOLD / BUY) |
TATN RX |
TATNP RX |
TP/Current Price, RUB |
740.0/755.0 |
740.0/520.0 |
Upside Potential, % |
(2.0) |
42.3 |
|
|
|
Transneft (BUY) |
|
TRNFP RX |
TP/Current Price, RUB |
215,000.0/169,550.0 |
|
Upside Potential, % |
26.8 |
|
|
|
|
PKN ORLEN (HOLD) |
|
PKN PW |
TP/Current Price, PLN |
|
98.0/104.6 |
Upside Potential, % |
|
(6.3) |
|
|
|
MOL Group (BUY) |
|
MOL HB |
TP/Current Price, HUF |
|
4,200.0/3,160. |
Upside Potential, % |
|
32.9 |
|
|
|
Tupras (BUY) |
|
TUPRS TI |
TP/Current Price, TRY |
|
176.0/123.8 |
Upside Potential, % |
|
42.2 |
|
|
|
OMV Petrom (BUY) |
|
SNP RE |
TP/Current Price, RON |
|
0.46/0.36 |
Upside Potential, % |
|
26.2 |
|
|
|
Grupa LOTOS (BUY) |
|
LTS PW |
TP/Current Price, PLN |
|
92.0/77.3 |
Upside Potential, % |
|
19.0 |
|
|
|
Petkim (HOLD) |
|
PETKM TI |
TP/Current Price, TRY |
|
8.0/5.2 |
Upside Potential, % |
|
54.1 |
Prices in this report as of close 22 November 2018
Source: Bloomberg, Renaissance Capital estimates
Important disclosures are found at the Disclosures Appendix. Communicated by Renaissance Securities (Cyprus) Limited, regulated by the Cyprus Securities & Exchange Commission, which together with non-US affiliates operates outside of the USA under the brand name of Renaissance Capital.
vk.com/id446425943
|
|
|
|
|
|
|
|
|
|
|
|
|
|
|
|
|
Renaissance Capital |
||||
|
|
|
|
|
|
|
|
|
|
|
|
|
|
|
|
|
26 November 2018 |
||||
|
|
|
|
|
|
|
|
|
|
|
|
|
|
|
|
|
|
Oil & Gas |
|||
|
|
|
|
|
|
|
|
|
|
|
|
|
|
|
|
|
|
|
|||
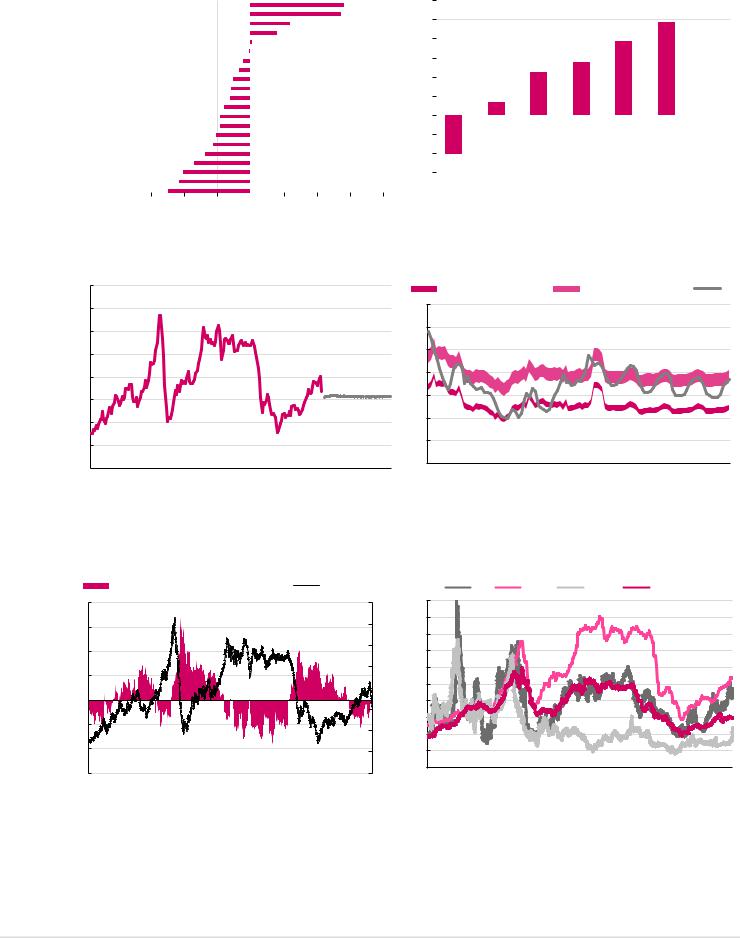
Figure 2: Price performance, last week, % |
|
|
|
|
|
|
|
|
|
Figure 3: Russian oil production (in b/d terms) growth in October 2018, YoY |
|||||||||||
PKN ORLEN |
|
|
|
|
|
|
|
|
|
|
|
5.7% |
|
6% |
|
|
|
|
|
|
|
|
|
|
|
|
|
|
|
|
|
|
|
|
4.9% |
|
|
|
|
||||
|
|
|
|
|
|
|
|
|
|
|
|
|
|
|
|
|
|
||||
Grupa LOTOS |
|
|
|
|
|
|
|
|
|
|
|
5.5% |
|
5% |
|
4.4% |
|
||||
|
|
|
|
|
|
|
|
|
|
|
|
|
|
|
|
||||||
Petkim |
|
|
|
|
|
|
|
|
2.4% |
|
|
|
|
|
3.9% |
|
|||||
|
|
|
|
|
|
|
|
|
|
|
|
|
|
|
|
|
|
||||
MOL |
|
|
|
|
|
|
|
1.6% |
|
|
|
|
4% |
|
|
|
|
|
|||
|
|
|
|
|
|
|
|
|
|
|
|
|
|
|
|
||||||
|
|
|
|
|
|
|
|
|
|
|
|
|
|
|
|
|
|
||||
Tupras |
|
|
|
|
|
|
0.1% |
|
|
|
|
|
|
|
2.8% |
|
|
|
|
||
|
|
|
|
|
|
|
|
|
|
|
|
|
|
|
|
|
|
||||
Gazprom |
|
|
|
-0.1% |
|
|
|
|
|
|
|
|
|
3% |
|
|
|
|
|
||
NOVATEK |
|
|
|
-0.4% |
|
|
|
|
|
|
|
|
|
|
2.2% |
|
|
|
|
||
|
|
|
|
|
|
|
|
|
|
|
|
|
|
|
|
|
|
||||
Surgutneftegas |
|
|
- |
0.7% |
|
|
|
|
|
|
|
|
|
2% |
|
|
|
|
|
|
|
Bashneft |
|
|
-1.1% |
|
|
|
|
|
|
|
|
|
|
|
|
|
|
|
|
||
LUKOIL |
|
|
-1.2% |
|
|
|
|
|
|
|
|
|
1% |
0.7% |
|
|
|
|
|
|
|
Transneft |
|
|
-1.2% |
|
|
|
|
|
|
|
|
|
|
|
|
|
|
|
|
||
Surgutneftegas prefs |
|
|
-1.6% |
|
|
|
|
|
|
|
|
|
|
0% |
|
|
|
|
|
|
|
Tatneft |
|
|
-1.8% |
|
|
|
|
|
|
|
|
|
|
|
|
|
|
|
|
|
|
Bashneft prefs |
|
|
-1.8% |
|
|
|
|
|
|
|
|
|
|
-1% |
|
|
|
|
|
|
|
Nostrum Oil & Gas |
|
|
-2.1% |
|
|
|
|
|
|
|
|
|
|
|
|
|
|
|
|
|
|
|
|
|
|
|
|
|
|
|
|
|
|
|
|
|
|
|
|
|
|||
Russneft |
|
|
-2.2% |
|
|
|
|
|
|
|
|
|
|
-2% |
|
|
|
|
|
|
|
Exillon Energy |
|
- |
2.8% |
|
|
|
|
|
|
|
|
|
|
|
|
|
|
|
|
|
|
|
|
|
|
|
|
|
|
|
|
|
|
|
|
|
|
|
|
||||
Rosneft |
|
-3.4% |
|
|
|
|
|
|
|
|
|
|
|
-3% |
-2.1% |
|
|
|
|
|
|
OMV Petrom |
|
-4.1% |
|
|
|
|
|
|
|
|
|
|
|
|
|
|
|
|
|
||
|
|
|
|
|
|
|
|
|
|
|
|
|
|
|
|
|
|
|
|||
Tatneft prefs |
|
-4.3% |
|
|
|
|
|
|
|
|
|
|
|
|
Bashneft Surgut |
LUKOIL Gazprom Tatneft Rosneft Russia |
|||||
Gazprom Neft |
- |
4.9% |
|
|
|
|
|
|
|
|
|
|
|
|
|||||||
|
|
|
|
|
|
|
|
|
|
|
|
|
|
Neft |
|
|
|
|
|||
|
-6% -4% -2% |
0% |
2% |
4% |
6% |
8% |
|
|
|
|
|
|
|||||||||
|
|
|
|
|
|
|
|
||||||||||||||
|
|
|
|
|
|
|
|
|
|
|
Source: Bloomberg |
|
|
Source: CDU TEK, Interfax, Renaissance Capital |
|||||||
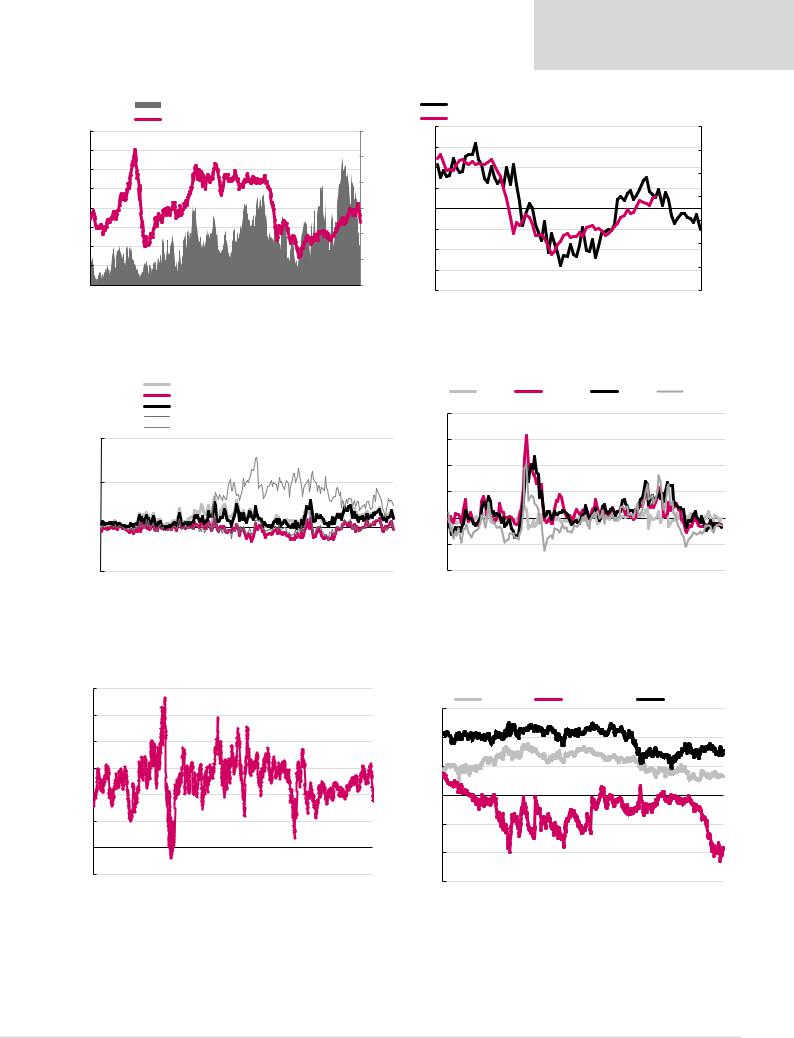
Figure 4: Brent strip, $/bl |
|
|
|
|
|
|
|
|
|
Figure 5: Full costs* of US LNG vs European hub prices ($/mmbtu) |
|
|
|
|
|||||||
160 |
|
|
|
|
|
|
|
|
|
|
|
|
|
|
|
|
|
|
|
|
Short-term breakeven range |
|
Long-term breakeven range |
NBP |
||||
|
|
|
|
|
|
|
|
|
|
|
|
|
|
|
|
|
|
|
|
|
|
|||||||
140 |
|
|
|
|
|
|
|
|
|
|
|
|
|
|
|
|
|
|
|
14 |
|
|
|
|
|
|
|
|
|
|
|
|
|
|
|
|
|
|
|
|
|
|
|
|
|
|
|
|
|
|
|
|
|
|
|
|
|
120 |
|
|
|
|
|
|
|
|
|
|
|
|
|
|
|
|
|
|
|
12 |
|
|
|
|
|
|
|
|
|
|
|
|
|
|
|
|
|
|
|
|
|
|
|
|
|
|
|
|
|
|
|
|
|
|
|
|
|
100 |
|
|
|
|
|
|
|
|
|
|
|
|
|
|
|
|
|
|
|
10 |
|
|
|
|
|
|
|
|
|
|
|
|
|
|
|
|
|
|
|
|
|
|
|
|
|
|
|
|
|
|
|
|
|
|
|
|
|
80 |
|
|
|
|
|
|
|
|
|
|
|
|
|
|
|
|
|
|
|
8 |
|
|
|
|
|
|
|
|
|
|
|
|
|
|
|
|
|
|
|
|
|
|
|
|
|
|
|
|
|
|
|
|
|
|
|
|
|
60 |
|
|
|
|
|
|
|
|
|
|
|
|
|
|
|
|
|
|
|
6 |
|
|
|
|
|
|
|
|
|
|
|
|
|
|
|
|
|
|
|
|
|
|
|
|
|
|
|
|
|
|
|
|
|
|
|
|
|
40 |
|
|
|
|
|
|
|
|
|
|
|
|
|
|
|
|
|
|
|
4 |
|
|
|
|
|
|
|
|
|
|
|
|
|
|
|
|
|
|
|
|
|
|
|
|
|
|
|
|
|
|
|
|
|
|
|
|
|
20 |
|
|
|
|
|
|
|
|
|
|
|
|
|
|
|
|
|
|
|
2 |
|
|
|
|
|
|
|
|
|
|
|
|
|
|
|
|
|
|
|
|
|
|
|
|
|
|
|
|
|
|
|
|
|
|
|
|
|
0 |
|
|
|
|
|
|
|
|
|
|
|
|
|
|
|
|
|
|
|
0 |
|
|
|
|
|
|
|
|
|
|
|
|
|
|
|
|
|
|
|
|
|
|
|
|
|
|
|
2014 |
2015 |
2016 |
2017 |
2018 |
2019 |
2020 |
2021 |
2022 |
|
2004 |
2005 |
2006 |
2007 |
2008 |
2009 |
2010 |
2011 |
2012 |
2013 |
2014 |
2015 |
2016 |
2017 |
2018 |
2019 |
2020 |
2021 |
2022 |
2023 |
|||||||||
|
|
*Based on typical contract price formula, incl. 115% of HH, $2.4 - 3.0/mmbtu tolling, shipping ($1.0) |
|
Source: Bloomberg |
and regasification costs ($1.0). |
|
Source: Bloomberg, Renaissance Capital estimates |
|
|
|
|
Figure 6: Contango or backwardation, $/bl |
|
Figure 7: European gas prices – Gazprom vs spot, $/mmbtu |
|
One-year contango/(backwardation) (LHS) |
|
Brent (RHS) |
$/Mmbtu |
|
NBP |
|
LNG Asia |
|
|
Henry Hub |
|
Germany BAFA import price |
||||||||||
20 |
|
|
|
|
|
|
160 |
20 |
|
|
|
|
|
|
|
|
|
|
|
|
|
|
|
15 |
|
|
|
|
|
|
140 |
18 |
|
|
|
|
|
|
|
|
|
|
|
|
|
|
|
|
|
|
|
|
|
|
|
|
|
|
|
|
|
|
|
|
|
|
|
|
|||
|
|
|
|
|
|
|
16 |
|
|
|
|
|
|
|
|
|
|
|
|
|
|
||
|
|
|
|
|
|
|
|
|
|
|
|
|
|
|
|
|
|
|
|
|
|
||
10 |
|
|
|
|
|
|
120 |
14 |
|
|
|
|
|
|
|
|
|
|
|
|
|
|
|
|
|
|
|
|
|
|
|
|
|
|
|
|
|
|
|
|
|
|
|
|
|||
5 |
|
|
|
|
|
|
100 |
12 |
|
|
|
|
|
|
|
|
|
|
|
|
|
|
|
|
|
|
|
|
|
|
10 |
|
|
|
|
|
|
|
|
|
|
|
|
|
|
||
|
|
|
|
|
|
|
80 |
|
|
|
|
|
|
|
|
|
|
|
|
|
|
||
|
|
|
|
|
|
|
|
|
|
|
|
|
|
|
|
|
|
|
|
|
|
||
0 |
|
|
|
|
|
|
60 |
8 |
|
|
|
|
|
|
|
|
|
|
|
|
|
|
|
|
|
|
|
|
|
|
6 |
|
|
|
|
|
|
|
|
|
|
|
|
|
|
||
-5 |
|
|
|
|
|
|
|
|
|
|
|
|
|
|
|
|
|
|
|
|
|
||
|
|
|
|
|
|
40 |
4 |
|
|
|
|
|
|
|
|
|
|
|
|
|
|
||
|
|
|
|
|
|
|
|
|
|
|
|
|
|
|
|
|
|
|
|
|
|||
|
|
|
|
|
|
|
|
|
|
|
|
|
|
|
|
|
|
|
|
|
|
||
-10 |
|
|
|
|
|
|
20 |
2 |
|
|
|
|
|
|
|
|
|
|
|
|
|
|
|
-15 |
|
|
|
|
|
|
0 |
0 |
|
|
|
|
|
|
|
|
|
|
|
|
|
|
|
|
|
|
|
|
|
2004 |
2005 |
2006 |
2007 |
2008 |
2009 |
2010 |
2011 |
2012 |
2013 |
2014 |
2015 |
2016 |
2017 |
2018 |
|||
04 |
06 |
08 |
10 |
12 |
14 |
16 |
18 |
||||||||||||||||
|
|
|
|
|
|
|
|
|
|
|
|
|
|
|
|||||||||
|
|
|
|
|
|
|
Source: Bloomberg |
|
|
|
|
|
|
|
|
Source: Bloomberg, Gazprom, Renaissance Capital |
|||||||
2
vk.com/id446425943
Renaissance Capital
26 November 2018
Oil & Gas
Figure 8: Oil futures open interest vs Brent price |
Figure 9: OECD commercial inventories and Brent oil price (rhs) |
|
|
|
|
Managed Money, no. of long positions (RHS) |
|
|
OECD inventories (days of supply) in excess of 5-yr average, mn bls (lhs, inverted) |
|||||||||
|
|
|
|
Brent spot price, $/bl (LHS) |
|
|
|
|
(8) |
Brent oil price, $/bl (rhs) |
140 |
|||||
160 |
|
|
|
|
|
|
|
|
|
|
|
600,000 |
|
|
||
|
|
|
|
|
|
|
|
|
|
|
|
|
|
|
||
140 |
|
|
|
|
|
|
|
|
|
|
|
500,000 |
(6) |
|
|
120 |
|
|
|
|
|
|
|
|
|
|
|
|
|
|
|||
|
|
|
|
|
|
|
|
|
|
|
|
|
|
|
|
|
120 |
|
|
|
|
|
|
|
|
|
|
|
|
(4) |
|
|
100 |
|
|
|
|
|
|
|
|
|
|
|
|
400,000 |
|
|
|
|
100 |
|
|
|
|
|
|
|
|
|
|
|
(2) |
|
|
|
|
|
|
|
|
|
|
|
|
|
|
|
|
|
|
80 |
||
|
|
|
|
|
|
|
|
|
|
|
|
|
|
|
|
|
80 |
|
|
|
|
|
|
|
|
|
|
|
300,000 |
- |
|
|
|
60 |
|
|
|
|
|
|
|
|
|
|
|
|
2 |
|
|
60 |
|
|
|
|
|
|
|
|
|
|
|
200,000 |
|
|
|
||
|
|
|
|
|
|
|
|
|
|
|
|
|
|
|
40 |
|
40 |
|
|
|
|
|
|
|
|
|
|
|
|
4 |
|
|
|
|
|
|
|
|
|
|
|
|
|
|
|
|
|
|
||
|
|
|
|
|
|
|
|
|
|
|
|
|
|
|
|
|
20 |
|
|
|
|
|
|
|
|
|
|
|
100,000 |
|
|
|
20 |
|
|
|
|
|
|
|
|
|
|
|
|
6 |
|
|
||
|
|
|
|
|
|
|
|
|
|
|
|
|
|
|
|
|
- |
|
|
|
|
|
|
|
|
|
|
|
- |
8 |
|
|
- |
2006 |
2007 |
2008 |
2009 |
2010 |
2011 |
2012 |
2013 |
2014 |
2015 |
2016 |
2017 |
2018 |
|
|
||
Jan-13 Nov-13 Sep-14 |
Jul-15 |
May-16 Mar-17 Jan-18 Nov-18 Sep-19 |
||||||||||||||
|
|
|
|
|||||||||||||
Source: Bloomberg |
Source: EIA, Bloomberg |
Figure 10: Refining margin Russia vs Europe, $/bl |
|
|
|
|
|
|
|
|
|
Figure 11: Russian domestic price premium vs export netbacks |
|
|
|||||||||||||||||||||||
|
|
|
|
|
|
Urals (cracking) |
|
|
|
|
|
|
|
|
|
|
|
|
|
Crude |
|
|
Gasoline |
|
|
Diesel |
|
Fuel oil |
|||||||
|
|
|
|
|
|
Urals (hydroskimming) |
|
|
|
|
|
|
|
|
|
|
|
|
|
|
|
|
|||||||||||||
|
|
|
|
|
|
|
|
|
|
|
|
|
|
|
|
|
|
|
|
|
|
|
|
|
|
|
|
|
|||||||
|
|
|
|
|
|
Brent (cracking) |
|
|
|
|
|
|
|
|
|
|
|
200% |
|
|
|
|
|
|
|
|
|
|
|
|
|
||||
|
|
|
|
|
|
Brent (hydroskimming) |
|
|
|
|
|
|
|
|
|
|
|
|
|
|
|
|
|
|
|
|
|
|
|||||||
|
|
|
|
|
|
|
|
|
|
|
|
|
|
|
|
|
|
|
|
|
|
|
|
|
|
|
|
|
|||||||
|
|
|
|
|
Average gross refining margin in Russia |
|
|
|
|
|
|
|
|
|
|
|
|
|
|
|
|
|
|
|
|||||||||||
40.0 |
|
|
|
|
|
|
|
|
|
|
|
|
|
|
|
|
|
|
|
|
|
150% |
|
|
|
|
|
|
|
|
|
|
|
|
|
|
|
|
|
|
|
|
|
|
|
|
|
|
|
|
|
|
|
|
|
|
|
100% |
|
|
|
|
|
|
|
|
|
|
|
|
|
20.0 |
|
|
|
|
|
|
|
|
|
|
|
|
|
|
|
|
|
|
|
|
|
50% |
|
|
|
|
|
|
|
|
|
|
|
|
|
|
|
|
|
|
|
|
|
|
|
|
|
|
|
|
|
|
|
|
|
|
|
|
|
|
|
|
|
|
|
|
|
|
|
|
|
- |
|
|
|
|
|
|
|
|
|
|
|
|
|
|
|
|
|
|
|
|
|
0% |
|
|
|
|
|
|
|
|
|
|
|
|
|
|
|
|
|
|
|
|
|
|
|
|
|
|
|
|
|
|
|
|
|
|
|
|
|
|
|
|
|
|
|
|
|
|
|
|
|
|
|
|
|
|
|
|
|
|
|
|
|
|
|
|
|
|
|
|
|
|
|
-50% |
|
|
|
|
|
|
|
|
|
|
|
|
|
(20.0) |
|
|
|
|
|
|
|
|
|
|
|
|
|
|
|
|
|
|
|
|
|
-100% |
|
|
|
|
|
|
|
|
|
|
|
|
|
1997 |
1998 |
1999 |
2000 |
2001 |
2002 |
2003 |
2004 |
2005 |
2006 |
2007 |
2008 |
2009 |
2010 |
2011 |
2012 |
2013 |
2014 |
2015 |
2016 |
2017 |
2018 |
2005 |
2006 |
2007 |
2008 |
2009 |
2010 |
2011 |
2012 |
2013 |
2014 |
2015 |
2016 |
2017 |
2018 |
Source: EIA, Bloomberg, Argus, InfoTEK, Renaissance Capital |
Source: Bloomberg, Argus, InfoTEK, Renaissance Capital |
Figure 12: Gross margin contribution for Russian crude exporters, $/bl (Urals oil price less export duty less MET)
60
50 |
|
|
|
|
|
|
|
|
|
|
|
|
|
40 |
|
|
|
|
|
|
|
|
|
|
|
|
|
30 |
|
|
|
|
|
|
|
|
|
|
|
|
|
20 |
|
|
|
|
|
|
|
|
|
|
|
|
|
10 |
|
|
|
|
|
|
|
|
|
|
|
|
|
- |
|
|
|
|
|
|
` |
|
|
|
|
|
|
(10) |
|
|
|
|
|
|
|
|
|
|
|
|
|
2004 |
2005 |
2006 |
2007 |
2008 |
2009 |
2010 |
2011 |
2012 |
2013 |
2014 |
2015 |
2016 |
2017 |
Source: Bloomberg, Interfax, Renaissance Capital
Figure 13: Preferred share price discount to commons
60% |
Sberbank |
Surgutneftegas |
Tatneft |
|
|
|
|
|
|
40% |
|
|
|
|
20% |
|
|
|
|
0% |
|
|
|
|
-20% |
|
|
|
|
-40% |
|
|
|
|
-60% |
|
|
|
|
2013 |
2014 |
2015 |
2016 |
2017 |
Source: Bloomberg
3
vk.com/id446425943
Renaissance Capital
26 November 2018
Oil & Gas
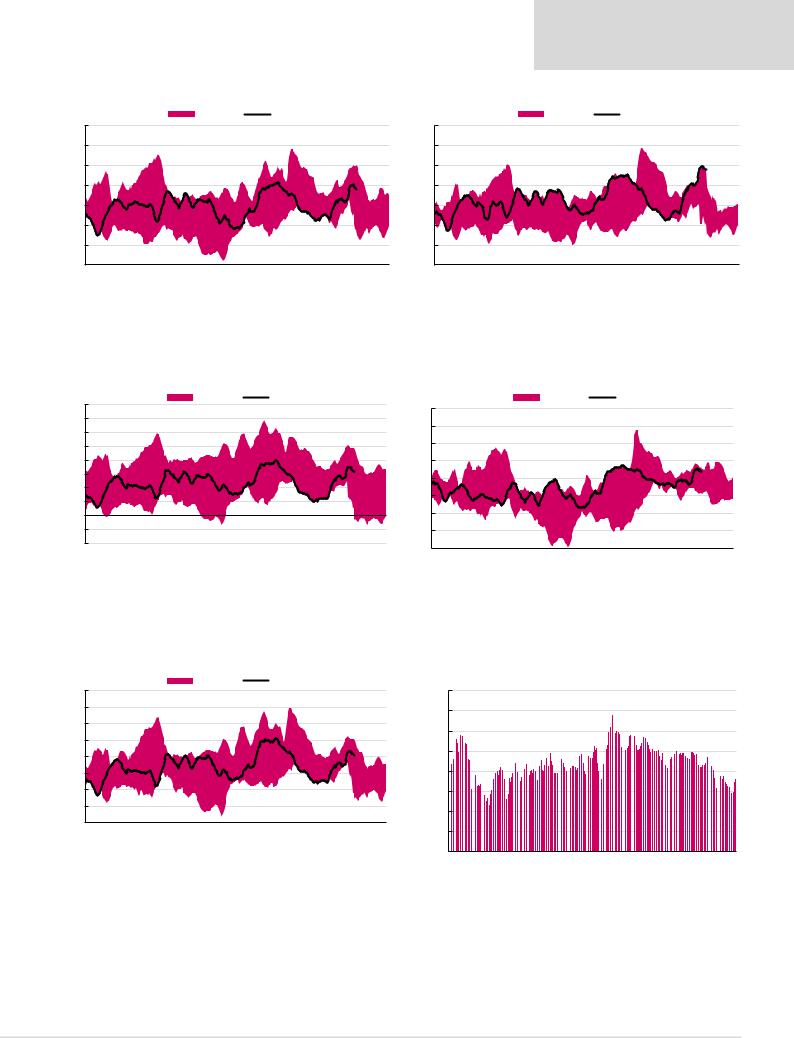
Figure 14: MOL model refining margin 7-day average, $/bl |
Figure 15: Grupa LOTOS model refining margin 7-day average, $/bl |
|
|
|
|
|
5Y range |
|
Margin |
|
|
|
|
14 |
|
|
|
|
|
|
|
|
|
|
14 |
12 |
|
|
|
|
|
|
|
|
|
|
12 |
10 |
|
|
|
|
|
|
|
|
|
|
10 |
8 |
|
|
|
|
|
|
|
|
|
|
8 |
6 |
|
|
|
|
|
|
|
|
|
|
6 |
4 |
|
|
|
|
|
|
|
|
|
|
4 |
2 |
|
|
|
|
|
|
|
|
|
|
2 |
0 |
February |
March |
|
May |
June |
July |
August |
September |
October |
|
0 |
January |
April |
November |
December |
||||||||
|
|
|
|
|
5Y range |
|
Margin |
|
|
|
|
January |
February |
March |
April |
May |
June |
July |
August |
September |
October |
November |
December |
Source: Bloomberg, Thomson Reuters Datastream Source: Bloomberg, Thomson Reuters Datastream
Figure 16: PKN ORLEN model refining margin 7-day average, $/bl Figure 17: Tupras model refining margin 7-day average, $/bl
16 |
|
|
|
|
5Y range |
|
Margin |
|
|
|
|
||
|
|
|
|
|
|
|
|
|
|
|
16 |
||
14 |
|
|
|
|
|
|
|
|
|
|
|
||
|
|
|
|
|
|
|
|
|
|
|
14 |
||
12 |
|
|
|
|
|
|
|
|
|
|
|
||
|
|
|
|
|
|
|
|
|
|
|
|
||
10 |
|
|
|
|
|
|
|
|
|
|
|
12 |
|
|
|
|
|
|
|
|
|
|
|
|
|
||
8 |
|
|
|
|
|
|
|
|
|
|
|
10 |
|
6 |
|
|
|
|
|
|
|
|
|
|
|
8 |
|
4 |
|
|
|
|
|
|
|
|
|
|
|
||
|
|
|
|
|
|
|
|
|
|
|
6 |
||
2 |
|
|
|
|
|
|
|
|
|
|
|
||
|
|
|
|
|
|
|
|
|
|
|
|
||
0 |
|
|
|
|
|
|
|
|
|
|
|
4 |
|
|
|
|
|
|
|
|
|
|
|
|
|
||
-2 |
|
|
|
|
|
|
|
|
|
|
|
2 |
|
-4 |
February |
March |
|
May |
June |
July |
August |
September |
October |
|
|
0 |
|
January |
April |
November |
December |
||||||||||
|
|||||||||||||
|
|
|
|
|
5Y range |
|
Margin |
|
|
|
|
January |
February |
March |
April |
May |
June |
July |
August |
September |
October |
November |
December |
Source: Bloomberg, Thomson Reuters Datastream Source: Bloomberg, Thomson Reuters Datastream
Figure 18: OMV Petrom model refining margin 7-day average, $/bl Figure 19: North-Western Europe LDPE-Naphtha spread, $/t
16 |
|
|
|
|
5Y range |
|
Margin |
|
|
|
1,600 |
|
|
|
|
|
|
|
|
|
|
|
|
|
|
|
|
|
|
|
|
|
|
|
|
||
14 |
|
|
|
|
|
|
|
|
|
|
|
1,400 |
|
|
|
|
|
|
|
|
|
|
|
|
|
|
|
|
|
|
|
|
|
|
|
|
|
12 |
|
|
|
|
|
|
|
|
|
|
|
1,200 |
|
|
|
|
|
|
10 |
|
|
|
|
|
|
|
|
|
|
|
|
|
|
|
|
|
|
|
|
|
|
|
|
|
|
|
|
|
|
|
|
|
|
|
|
|
8 |
|
|
|
|
|
|
|
|
|
|
|
1,000 |
|
|
|
|
|
|
|
|
|
|
|
|
|
|
|
|
|
|
|
|
|
|
|
|
|
6 |
|
|
|
|
|
|
|
|
|
|
|
800 |
|
|
|
|
|
|
4 |
|
|
|
|
|
|
|
|
|
|
|
600 |
|
|
|
|
|
|
2 |
|
|
|
|
|
|
|
|
|
|
|
400 |
|
|
|
|
|
|
|
|
|
|
|
|
|
|
|
|
|
|
|
|
|
|
|
|
|
0 |
February |
|
|
May |
|
July |
|
September |
October |
|
|
|
|
|
|
|
|
|
January |
March |
April |
June |
August |
November |
December |
200 |
|
|
|
|
|
|
|||||
- |
|
|
|
|
|
|
||||||||||||
Nov-10 Nov-11 |
Nov-12 |
Nov-13 |
Nov-14 |
Nov-15 |
Nov-16 |
Nov-17 |
||||||||||||
Source: Bloomberg, Thomson Reuters Datastream |
Source: Thomson Reuters Datastream |
4

vk.com/id446425943
Renaissance Capital
26 November 2018
Oil & Gas
Figure 20: Summary valuation for oil and gas companies we cover
Company name |
Ticker |
Currency |
Rating |
TP |
Current price |
Potential upside / |
MktCap, |
EV, |
|
P/E, x |
|
EV/EBITDA, x |
Div yield, % |
EV/reserves EV/production |
||||
|
22-Nov-18 |
downside |
$mn |
$mn |
2018E |
2019E |
2020E |
2018E |
2019E |
2020E |
2018E |
2019E |
$/boe, 2017 |
$/boe, 2017 |
||||
|
|
|
|
|
||||||||||||||
Russian Oil and Gas |
|
|
|
|
|
|
|
|
|
|
|
|
|
|
|
|
|
|
Gazprom (RenCap estimates) |
GAZP RX |
RUB |
BUY |
220.0 |
153.9 |
43% |
55,493 |
91,222 |
2.7 |
3.0 |
3.0 |
2.5 |
2.9 |
2.8 |
5.2 |
5.2 |
0.7 |
24.4 |
Gazprom (consensus estimates) |
GAZP RX |
|
|
|
|
|
|
|
2.8 |
2.7 |
2.7 |
2.5 |
2.5 |
2.4 |
6.4 |
8.2 |
|
|
NOVATEK (RenCap estimates) |
NVTK RM |
RUB |
HOLD |
1,070.0 |
1,124.0 |
-5% |
51,978 |
53,044 |
19.0 |
14.5 |
13.0 |
14.1 |
14.6 |
13.7 |
1.4 |
1.4 |
3.6 |
105.2 |
NOVATEK (consensus estimates) |
NVTK RM |
|
|
|
|
|
|
|
15.1 |
11.5 |
10.6 |
12.4 |
12.8 |
11.6 |
1.7 |
2.1 |
|
|
Rosneft (RenCap estimates) |
ROSN RX |
RUB |
BUY |
550.0 |
411.1 |
34% |
66,357 |
122,868 |
6.4 |
5.6 |
4.8 |
4.2 |
4.0 |
3.9 |
7.8 |
8.9 |
3.1 |
59.0 |
Rosneft (consensus estimates) |
ROSN RX |
|
|
|
|
|
|
|
6.7 |
5.5 |
4.9 |
4.0 |
3.8 |
3.6 |
6.9 |
9.0 |
|
|
LUKOIL (RenCap estimates) |
LKOH RX |
RUB |
BUY |
5,600.0 |
4,813.5 |
16% |
54,983 |
54,973 |
5.3 |
7.0 |
8.6 |
3.0 |
3.4 |
3.8 |
5.1 |
5.6 |
3.6 |
69.3 |
LUKOIL (consensus estimates) |
LKOH RX |
|
|
|
|
|
|
|
5.7 |
5.5 |
5.4 |
3.1 |
3.1 |
3.0 |
5.1 |
5.5 |
|
|
Surgutneftegas (RenCap estimates) |
SNGS RX |
RUB |
HOLD |
110.0 |
27.3 |
303% |
19,243 |
(14,249) |
1.8 |
2.7 |
3.0 |
n/a |
n/a |
n/a |
2.4 |
2.4 |
0.4 |
n/a |
Surgutneftegas prefs (RenCap estimates) |
SNGSP RX |
RUB |
BUY |
110.0 |
37.5 |
193% |
4,397 |
|
|
|
- |
- |
- |
- |
17.1 |
11.5 |
|
|
Surgutneftegas (consensus estimates) |
SNGS RX |
|
|
|
|
|
|
|
3.1 |
3.5 |
3.5 |
n/a |
n/a |
n/a |
2.6 |
2.4 |
|
|
Gazprom Neft (RenCap estimates) |
SIBN RX |
RUB |
HOLD |
360.0 |
362.8 |
-1% |
26,198 |
34,602 |
4.4 |
5.5 |
6.5 |
3.6 |
4.3 |
4.6 |
8.0 |
7.3 |
3.3 |
55.3 |
Gazprom Neft (consensus estimates) |
SIBN RX |
|
|
|
|
|
|
|
4.6 |
4.4 |
4.5 |
3.7 |
3.7 |
3.7 |
6.2 |
8.0 |
|
|
Tatneft (RenCap estimates) |
TATN RM |
RUB |
HOLD |
740.0 |
755.0 |
-2% |
26,221 |
27,493 |
7.6 |
8.8 |
9.5 |
5.6 |
6.3 |
6.5 |
9.1 |
5.6 |
4.3 |
130.0 |
Tatneft prefs (RenCap estimates) |
TATNP RX |
RUB |
BUY |
740.0 |
520.0 |
42% |
1,168 |
|
|
|
- |
- |
- |
|
13.2 |
8.1 |
|
|
Tatneft (consensus estimates) |
TATN RM |
|
|
|
|
|
|
|
8.0 |
8.1 |
7.6 |
6.1 |
6.1 |
5.6 |
7.9 |
7.0 |
|
|
Weighted average |
|
|
|
|
|
|
|
|
7.2 |
6.9 |
6.9 |
5.1 |
5.4 |
5.3 |
5.7 |
5.6 |
2.7 |
63.4 |
EM refiners |
|
|
|
|
|
|
|
|
|
|
|
|
|
|
|
|
|
|
Tupras (RenCap estimates) |
TUPRS TI |
TRY |
BUY |
176.0 |
123.8 |
42% |
5,842 |
7,528 |
7.3 |
4.7 |
4.6 |
5.8 |
4.2 |
4.1 |
10.9 |
17.0 |
n/a |
36.6 |
Tupras (consensus estimates) |
TUPRS TI |
|
|
|
|
|
|
|
9.1 |
6.5 |
5.2 |
5.6 |
5.1 |
4.5 |
12.4 |
17.0 |
|
|
MOL (RenCap estimates) |
MOL HB |
HUF |
BUY |
4,200.0 |
3,160.0 |
33% |
7,872 |
10,214 |
8.2 |
9.0 |
9.4 |
4.0 |
4.1 |
4.2 |
3.0 |
3.3 |
n/a |
66.7 |
MOL (consensus estimates) |
MOL HB |
|
|
|
|
|
|
|
8.4 |
7.6 |
7.1 |
4.2 |
4.0 |
4.0 |
3.7 |
3.6 |
|
|
PKN ORLEN (RenCap estimates) |
PKN PW |
PLN |
HOLD |
98.0 |
104.6 |
-6% |
11,884 |
13,264 |
7.7 |
8.7 |
8.5 |
5.5 |
5.4 |
5.4 |
3.0 |
3.2 |
n/a |
51.4 |
PKN ORLEN (consensus estimates) |
PKN PW |
|
|
|
|
|
|
|
9.2 |
9.4 |
9.0 |
5.7 |
5.7 |
5.4 |
3.1 |
3.2 |
|
|
Grupa LOTOS (RenCap estimates) |
LTS PW |
PLN |
BUY |
92.0 |
77.3 |
19% |
3,796 |
4,792 |
10.3 |
7.1 |
6.0 |
6.9 |
5.0 |
4.4 |
1.4 |
1.5 |
n/a |
62.3 |
Grupa LOTOS (consensus estimates) |
LTS PW |
|
|
|
|
|
|
|
9.7 |
10.2 |
8.3 |
5.9 |
6.0 |
5.1 |
2.3 |
2.7 |
|
|
OMV Petrom (RenCap estimates) |
SNP RE |
RON |
BUY |
0.46 |
0.36 |
26% |
5,054 |
3,876 |
6.6 |
7.1 |
7.9 |
2.2 |
2.2 |
2.3 |
5.8 |
6.0 |
n/a |
117.5 |
OMV Petrom (consensus estimates) |
SNP RE |
|
|
|
|
|
|
|
6.4 |
5.8 |
6.0 |
2.1 |
2.0 |
2.1 |
7.8 |
7.8 |
|
|
Petkim (RenCap estimates) |
PETKM TI |
TRY |
HOLD |
8.0 |
5.2 |
54% |
1,614 |
2,230 |
8.8 |
3.5 |
3.1 |
9.8 |
6.6 |
4.7 |
0.0 |
14.2 |
n/a |
n/a |
Petkim (consensus estimates) |
PETKM TI |
|
|
|
|
|
|
|
8.7 |
7.5 |
6.0 |
8.1 |
6.9 |
6.8 |
8.4 |
9.6 |
|
|
Weighted average |
|
|
|
|
|
|
|
|
7.9 |
7.5 |
7.5 |
5.1 |
4.5 |
4.4 |
4.4 |
6.1 |
|
60.4 |
Source: Company data, Bloomberg, Renaissance Capital estimates
5

vk.com/id446425943
Renaissance Capital
26 November 2018
Oil & Gas
Figure 21: Comparable multiples analysis for oil companies
Company name |
Ticker |
Currency Rating |
TP |
Current price |
Potential upside / |
MktCap, |
EV, |
|
P/E, x |
|
EV/EBITDA, x |
|
Div yield, % |
EV/reserves |
EV/production |
||||
22-Nov-18 |
downside, % |
$mn |
$mn |
2018E |
2019E |
2020E |
2018E |
2019E |
2020E |
2018E |
2019E |
$/boe, 2017 |
$/boe, 2017 |
||||||
|
|
|
|
|
|||||||||||||||
Russian Oil and Gas majors |
|
|
|
|
|
|
|
|
|
|
|
|
|
|
|
|
|
|
|
Rosneft (RenCap estimates) |
ROSN RX |
RUB |
BUY |
550.0 |
411.1 |
34% |
66,357 |
122,868 |
6.4 |
5.6 |
4.8 |
4.2 |
4.0 |
3.9 |
7.8 |
8.9 |
3.1 |
59.0 |
|
Rosneft (consensus estimates) |
ROSN RX |
|
|
|
|
|
|
|
6.7 |
5.5 |
4.9 |
4.0 |
3.8 |
3.6 |
6.9 |
9.0 |
|
|
|
LUKOIL (RenCap estimates) |
LKOH RX |
RUB |
BUY |
5,600 |
4,814 |
16% |
54,983 |
54,973 |
5.3 |
7.0 |
8.6 |
3.0 |
3.4 |
3.8 |
5.1 |
5.6 |
3.6 |
69.3 |
|
LUKOIL (consensus estimates) |
LKOH RX |
|
|
|
|
|
|
|
5.7 |
5.5 |
5.4 |
3.1 |
3.1 |
3.0 |
5.1 |
5.5 |
|
|
|
Surgutneftegas (RenCap estimates) |
SNGS RX |
RUB |
HOLD |
110.0 |
27.3 |
303% |
19,243 |
(14,249) |
1.8 |
2.7 |
3.0 |
n/a |
n/a |
n/a |
2.4 |
2.4 |
0.4 |
n/a |
|
Surgutneftegas prefs (RenCap estimates) |
SNGSP RX |
RUB |
BUY |
110.0 |
37.5 |
193% |
4,397 |
|
|
|
|
|
|
|
17.1 |
11.5 |
|
|
|
Surgutneftegas (consensus estimates) |
SNGS RX |
|
|
|
|
|
|
|
3.1 |
3.5 |
3.5 |
n/a |
n/a |
n/a |
2.6 |
2.4 |
|
|
|
Gazprom Neft (RenCap estimates) |
SIBN RX |
RUB |
HOLD |
360.0 |
362.8 |
-1% |
26,198 |
34,602 |
4.4 |
5.5 |
6.5 |
3.6 |
4.3 |
4.6 |
8.0 |
7.3 |
3.3 |
55.3 |
|
Gazprom Neft (consensus estimates) |
SIBN RX |
|
|
|
|
|
|
|
4.6 |
4.4 |
4.5 |
3.7 |
3.7 |
3.7 |
6.2 |
8.0 |
|
|
|
Tatneft (RenCap estimates) |
TATN RM |
RUB |
HOLD |
740.0 |
755.0 |
-2% |
26,221 |
27,493 |
7.6 |
8.8 |
9.5 |
5.6 |
6.3 |
6.5 |
9.1 |
5.6 |
4.3 |
130.0 |
|
Tatneft prefs (RenCap estimates) |
TATNP RX |
RUB |
BUY |
740.0 |
520.0 |
42% |
1,168 |
|
|
|
|
|
|
|
13.2 |
8.1 |
|
|
|
Tatneft (consensus estimates) |
TATN RM |
|
|
|
|
|
|
|
8.0 |
8.1 |
7.6 |
6.1 |
6.1 |
5.6 |
7.9 |
7.0 |
|
|
|
Weighted average |
|
|
|
|
|
|
|
|
5.5 |
6.1 |
6.6 |
4.0 |
4.2 |
4.4 |
7.0 |
6.8 |
3.1 |
63.4 |
|
Other FSU oil companies |
|
|
|
|
|
|
|
|
|
|
|
|
|
|
|
|
|
|
|
Nostrum (RenCap estimates) |
NOG LI |
GBp |
BUY |
283.0 |
180.0 |
57% |
436 |
1,416 |
12.8 |
14.6 |
22.9 |
5.5 |
5.9 |
5.9 |
0.0 |
0.0 |
2.9 |
99.0 |
|
Nostrum (consensus estimates) |
NOG LN |
|
|
|
180.0 |
|
|
|
11.5 |
6.7 |
4.8 |
5.6 |
4.3 |
3.5 |
0.0 |
1.4 |
|
|
|
Russneft (consensus estimates) |
RNFT RX |
|
|
|
522.6 |
|
2,341 |
3,638 |
7 |
5 |
4.5 |
5.5 |
4.1 |
4.1 |
n/a |
n/a |
n/a |
n/a |
|
Exillon Energy (consensus estimates) |
EXI LN |
|
|
|
70.6 |
|
147 |
272 |
n/a |
n/a |
n/a |
n/a |
n/a |
n/a |
n/a |
n/a |
1.5 |
54.5 |
|
Weighted average |
|
|
|
|
|
|
|
|
7.7 |
5.8 |
7.1 |
5.2 |
4.1 |
4.1 |
0.0 |
0.0 |
0.5 |
17.5 |
|
Other GEM oil companies |
|
|
|
|
|
|
|
|
|
|
|
|
|
|
|
|
|
|
|
Petrobras |
PETR3 BZ |
BRL |
|
|
27.4 |
|
90,492 |
164,455 |
9.2 |
7.2 |
6.8 |
4.9 |
4.3 |
4.1 |
2.4 |
3.0 |
16.9 |
162.8 |
|
Petrochina |
601857 CH |
CNY |
|
|
7.7 |
|
192,719 |
260,172 |
20.8 |
18.1 |
16.8 |
5.0 |
4.8 |
4.6 |
2.4 |
2.7 |
12.8 |
178.5 |
|
Sinopec |
386 HK |
HKD |
|
|
6.6 |
|
101,519 |
116,245 |
8.9 |
8.9 |
8.9 |
3.4 |
3.3 |
3.3 |
8.8 |
8.7 |
47.3 |
259.0 |
|
CNOOC |
883 HK |
HKD |
|
|
12.8 |
|
71,765 |
70,762 |
8.7 |
7.6 |
8.1 |
3.4 |
3.3 |
3.3 |
5.3 |
5.9 |
15.9 |
150.5 |
|
ONGC |
ONGC IN |
INR |
|
|
151.8 |
|
27,651 |
44,827 |
8.1 |
6.2 |
6.0 |
5.1 |
4.1 |
4.0 |
4.8 |
5.4 |
10.5 |
96.8 |
|
Sasol |
SOL SJ |
ZAr |
|
|
42,650 |
|
19,159 |
26,565 |
28.1 |
8.4 |
7.3 |
10.4 |
5.3 |
4.7 |
3.2 |
4.3 |
n/a |
n/a |
|
YPF |
YPFD AR |
ARS |
|
|
547.2 |
|
5,928 |
13,278 |
11.0 |
11.2 |
6.4 |
3.3 |
2.8 |
2.6 |
0.5 |
0.8 |
14.8 |
65.5 |
|
Ecopetrol |
ECOPETL CB |
COP |
|
|
3,150 |
|
40,460 |
52,114 |
9.3 |
8.8 |
9.5 |
4.8 |
4.6 |
5.0 |
3.4 |
4.8 |
31.4 |
199.7 |
|
Cap-weighted average |
|
|
|
|
|
|
|
|
13.8 |
11.5 |
11.0 |
4.7 |
4.2 |
4.1 |
4.2 |
4.6 |
21.1 |
177.1 |
|
International oil companies |
|
|
|
|
|
|
|
|
|
|
|
|
|
|
|
|
|
|
|
Exxon Mobil |
XOM US |
$ |
|
|
77.0 |
|
328,374 |
369,208 |
16.2 |
13.3 |
12.8 |
7.3 |
6.3 |
6.1 |
4.2 |
4.4 |
17.4 |
253.8 |
|
Chevron |
CVX US |
$ |
|
|
116.1 |
|
224,650 |
252,112 |
14.0 |
12.1 |
12.4 |
5.7 |
5.1 |
5.2 |
3.9 |
4.0 |
21.6 |
253.2 |
|
ConocoPhillips |
COP US |
$ |
|
|
64.0 |
|
75,383 |
85,918 |
13.7 |
12.4 |
12.9 |
5.3 |
4.9 |
5.1 |
1.8 |
1.9 |
17.1 |
170.9 |
|
Marathon |
MRO US |
$ |
|
|
15.9 |
|
13,641 |
17,575 |
20.1 |
14.0 |
12.8 |
4.6 |
4.1 |
3.8 |
1.3 |
1.3 |
12.1 |
121.3 |
|
Occidental |
OXY US |
$ |
|
|
70.3 |
|
54,422 |
61,786 |
13.2 |
12.5 |
14.8 |
6.2 |
5.7 |
6.1 |
4.4 |
4.5 |
23.8 |
281.2 |
|
BP |
BP/ LN |
GBp |
|
|
$525 |
|
135,621 |
175,104 |
11.4 |
10.4 |
10.1 |
4.7 |
4.2 |
4.2 |
6.0 |
6.1 |
9.5 |
135.1 |
|
Royal Dutch Shell |
RDSB LN |
GBp |
|
|
2,426 |
|
255,470 |
318,689 |
11.4 |
9.6 |
9.5 |
5.4 |
4.9 |
4.8 |
6.0 |
6.1 |
26.1 |
238.3 |
|
Total |
FP FP |
EUR |
|
|
49.1 |
|
150,414 |
179,374 |
10.4 |
9.2 |
9.1 |
5.1 |
4.6 |
4.5 |
5.3 |
5.4 |
15.6 |
191.5 |
|
ENI |
ENI IM |
EUR |
|
|
14.3 |
|
59,404 |
70,158 |
11.5 |
9.6 |
9.7 |
3.2 |
2.9 |
2.9 |
5.8 |
5.9 |
9.3 |
105.8 |
|
Repsol YPF |
REP SM |
EUR |
|
|
15.3 |
|
27,812 |
36,395 |
9.7 |
8.4 |
7.7 |
4.5 |
4.1 |
3.9 |
6.0 |
6.4 |
15.5 |
143.5 |
|
Equinor ASA |
EQNR NO |
NOK |
|
|
202.0 |
|
79,067 |
88,935 |
11.4 |
9.6 |
9.5 |
3.1 |
2.7 |
2.6 |
3.9 |
4.1 |
16.6 |
117.1 |
|
Cap-weighted average |
|
|
|
|
|
|
|
|
13.1 |
11.2 |
11.1 |
5.6 |
4.9 |
4.9 |
4.7 |
4.8 |
18.5 |
211.9 |
|
Source: Company data, Bloomberg, Renaissance Capital estimates
6

vk.com/id446425943
Renaissance Capital
26 November 2018
Oil & Gas
Figure 22: Comparable multiples analysis for gas companies
Company name |
Ticker |
Currency |
Rating |
TP |
Current price |
|
Potential upside / |
|
MktCap, |
|
EV, |
|
|
P/E, x |
|
|
|
|
EV/EBITDA, x |
Div yield, % |
|
EV/reserves |
|
EV/production |
||||||||||||
22-Nov-18 |
|
downside, % |
|
$mn |
|
$mn |
2018E |
2019E |
2020E |
|
2018E |
|
2019E |
2020E |
2018E |
2019E |
|
$/boe, 2017 |
|
$/boe, 2017 |
||||||||||||||||
|
|
|
|
|
|
|
|
|
|
|
|
|
|
|||||||||||||||||||||||
Russian Oil and Gas |
|
|
|
|
|
|
|
|
|
|
|
|
|
|
|
|
|
|
|
|
|
|
|
|
|
|
|
|
|
|
|
|
|
|
|
|
Gazprom (RenCap estimates) |
GAZP RX |
|
RUB |
BUY |
220.0 |
153.9 |
|
43% |
|
55,493 |
91,222 |
|
2.7 |
3.0 |
3.0 |
|
2.5 |
2.9 |
2.8 |
5.2 |
5.2 |
|
|
0.7 |
24.4 |
|
||||||||||
Gazprom (consensus estimates) |
GAZP RX |
|
|
|
|
|
|
|
|
|
|
|
|
|
|
2.8 |
2.7 |
2.7 |
|
2.5 |
|
2.5 |
2.4 |
6.4 |
8.2 |
|
|
|
|
|
|
|
||||
NOVATEK (RenCap estimates) |
NVTK RM |
|
RUB |
HOLD |
1,070.0 |
1,124.0 |
|
-5% |
|
51,978 |
53,044 |
|
19 |
14.5 |
13.0 |
|
14.1 |
14.6 |
13.7 |
1.4 |
1.4 |
|
|
3.6 |
105.2 |
|||||||||||
NOVATEK (consensus estimates) |
NVTK RM |
|
|
|
|
|
|
|
|
|
|
|
|
|
|
15.1 |
11.5 |
10.6 |
|
12.4 |
|
12.8 |
11.6 |
1.7 |
2.1 |
|
|
|
|
|
|
|
||||
Weighted average |
|
|
|
|
|
|
|
|
|
|
|
|
|
|
|
|
11 |
9 |
7.8 |
|
8.1 |
8.5 |
8.1 |
3.4 |
3.4 |
|
|
2.1 |
63.5 |
|
||||||
Premium/(discount) to International, % |
|
|
|
|
|
|
|
|
|
|
|
|
|
|
|
|
(35.8) |
(30.2) |
(22.8) |
|
34.9 |
|
66.4 |
75.2 |
30.3 |
21.7 |
|
|
-87.2 |
-50.3 |
|
|||||
International oil companies |
|
|
|
|
|
|
|
|
|
|
|
|
|
|
|
|
|
|
|
|
|
|
|
|
|
|
|
|
|
|
|
|
|
|
|
|
Engie |
ENGI FP |
|
EUR |
|
|
12.1 |
|
|
|
|
|
33,770 |
63,028 |
|
12.3 |
11.4 |
9.8 |
|
6.1 |
|
5.7 |
5.4 |
6.1 |
6.4 |
|
|
n/a |
|
n/a |
|
||||||
Devon Energy |
DVN US |
|
$ |
|
|
27.4 |
|
|
|
|
13,358 |
16,304 |
|
12.9 |
11.9 |
9.1 |
|
5.1 |
4.6 |
3.8 |
1.1 |
1.3 |
|
|
7.6 |
82.3 |
|
|||||||||
Murphy Oil |
MUR US |
|
$ |
|
|
30.8 |
|
|
|
|
|
5,465 |
7,442 |
|
18.2 |
8.6 |
10.6 |
|
4.6 |
|
3.4 |
3.4 |
3.2 |
3.2 |
|
|
10.7 |
124.7 |
||||||||
Chesapeake Energy |
CHK US |
|
$ |
|
|
3.2 |
|
|
|
|
2,979 |
14,581 |
|
3.8 |
2.6 |
1.9 |
|
6.2 |
5.4 |
4.7 |
0.0 |
0.0 |
|
|
7.6 |
72.9 |
|
|||||||||
Encana |
ECA CN |
|
CAD |
|
|
$10 |
|
|
|
|
|
7,138 |
10,741 |
|
12.3 |
6.2 |
5.0 |
|
4.9 |
|
3.1 |
2.5 |
0.8 |
1.1 |
|
|
13.5 |
94.0 |
|
|||||||
Pioneer Natural Resources |
PXD US |
|
$ |
|
|
151 |
|
|
|
|
26,244 |
27,054 |
|
22.5 |
13.3 |
10.6 |
|
8.1 |
6.1 |
5.2 |
0.2 |
0.3 |
|
|
27.5 |
272.2 |
||||||||||
Apache |
APA US |
|
$ |
|
|
34.7 |
|
|
|
|
|
13,675 |
22,619 |
|
17.1 |
16.7 |
13.8 |
|
4.5 |
|
4.4 |
4.3 |
2.9 |
2.9 |
|
|
19.3 |
135.5 |
||||||||
Anadarko Petroleum |
APC US |
|
$ |
|
|
52.4 |
|
|
|
|
27,014 |
44,360 |
|
19.7 |
13.5 |
11.0 |
|
5.7 |
4.8 |
4.4 |
1.7 |
2.1 |
|
|
30.8 |
180.9 |
||||||||||
Cap-weighted average |
|
|
|
|
|
|
|
|
|
|
|
|
|
|
|
|
16.5 |
12.2 |
10.1 |
|
6.0 |
|
5.1 |
4.6 |
2.6 |
2.8 |
|
|
16.2 |
127.7 |
||||||
|
|
|
|
|
|
|
|
|
|
|
|
|
|
|
|
|
|
|
|
|
|
|
|
|
|
|
|
Source: Company data, Bloomberg, Renaissance Capital estimates |
||||||||
Figure 23: Comparable multiples analysis for pipeline operators |
|
|
|
|
|
|
|
|
|
|
|
|
|
|
|
|
|
|
|
|
|
|
|
|
|
|
|
|
|
|
|
|
||||
Company name |
|
Ticker |
|
Currency Rating |
TP |
Current price |
Potential upside / |
|
MktCap, |
EV, |
|
|
|
|
|
P/E, x |
|
|
|
EV/EBITDA, x |
|
Div yield, % |
||||||||||||||
|
|
22-Nov-18 |
downside |
|
$mn |
|
$mn |
|
2018E |
2019E |
2020E |
|
2018E |
2019E |
|
2020E |
|
2018E |
2019E |
|||||||||||||||||
|
|
|
|
|
|
|
|
|
|
|
|
|
|
|||||||||||||||||||||||
Russian pipeline operators |
|
|
|
|
|
|
|
|
|
|
|
|
|
|
|
|
|
|
|
|
|
|
|
|
|
|
|
|
|
|
|
|
|
|
|
|
Transneft (RenCap estimates) |
|
TRNFP RX |
RUB |
BUY |
215,000.0 |
|
169,550.0 |
|
27% |
18,395 |
24,114 |
5.9 |
|
|
6.1 |
6.3 |
|
2.7 |
2.7 |
2.7 |
|
8.5 |
8.2 |
|||||||||||||
Transneft (consensus estimates) |
|
TRNFP RX |
|
|
|
|
|
|
|
|
|
|
|
|
|
|
|
|
6.1 |
|
|
5.5 |
4.8 |
|
3.6 |
3.4 |
|
3.1 |
|
5.5 |
6.6 |
|||||
Gazprom (RenCap estimates) |
|
GAZP RX |
RUB |
BUY |
220.0 |
|
153.9 |
|
43% |
55,493 |
91,222 |
2.7 |
|
|
3.0 |
3.0 |
|
2.5 |
2.9 |
2.8 |
|
5.2 |
5.2 |
|||||||||||||
Gazprom (consensus estimates) |
|
GAZP RX |
|
|
|
|
|
|
|
|
|
|
|
|
|
|
|
|
2.8 |
|
|
2.7 |
2.7 |
|
2.5 |
2.5 |
|
2.4 |
|
6.4 |
8.2 |
|||||
Weighted average |
|
|
|
|
|
|
|
|
|
|
|
|
|
|
|
|
|
|
3.5 |
|
|
3.8 |
3.8 |
|
2.6 |
2.8 |
2.8 |
|
6.0 |
6.0 |
||||||
Premium/(discount) to International, % |
|
|
|
|
|
|
|
|
|
|
|
|
|
|
|
|
|
|
|
(75.0) |
|
(72.1) |
(71.4) |
|
(74.3) |
(70.2) |
|
(70.7) |
|
30.2 |
20.9 |
|||||
European pipeline operators |
|
|
|
|
|
|
|
|
|
|
|
|
|
|
|
|
|
|
|
|
|
|
|
|
|
|
|
|
|
|
|
|
|
|
|
|
Elia |
|
ELI BB |
|
EUR |
|
|
|
|
56.2 |
|
|
|
|
3,908 |
7,142 |
|
13.2 |
|
13.1 |
12.6 |
|
8.4 |
7.3 |
|
6.9 |
|
2.9 |
3.0 |
||||||||
Red Electrica |
|
REE SM |
|
EUR |
|
|
|
|
18.9 |
|
|
|
11,652 |
17,872 |
14.4 |
|
14.0 |
14.5 |
|
10.1 |
9.9 |
10.1 |
|
5.2 |
5.6 |
|||||||||||
Transelectrica |
|
TEL RO |
|
RON |
|
|
|
|
23.0 |
|
|
|
|
413 |
|
409 |
|
19.3 |
|
10.9 |
8.8 |
|
n/a |
|
n/a |
|
n/a |
|
n/a |
n/a |
||||||
Terna |
|
TRN IM |
|
EUR |
|
|
|
|
4.8 |
|
|
|
11,005 |
19,846 |
13.9 |
|
13.2 |
12.8 |
|
10.7 |
10.1 |
9.8 |
|
4.8 |
5.1 |
|||||||||||
Cap-weighted average |
|
|
|
|
|
|
|
|
|
|
|
|
|
|
|
|
|
|
|
14.1 |
|
13.5 |
13.4 |
|
10.0 |
9.5 |
|
9.4 |
|
4.6 |
4.9 |
|||||
Source: Company data, Bloomberg, Renaissance Capital estimates
7

vk.com/id446425943
Renaissance Capital
26 November 2018
Oil & Gas
Figure 24: E&Ps – comparable multiples analysis
Company name |
Ticker |
Country of |
Currency |
Current price |
MktCap, |
EV, |
Earnings |
EBITDA |
P/E, x |
EV/EBITDA, x 2P reserves, 2C resources, Production, |
EV/2P |
EV/(2P+2C), |
EV/production |
|||
major operations |
22-Nov-18 |
$mn |
$mn |
2017, $mn |
2017, $mn |
2017 |
2017 |
mn boe |
mn boe |
kboe |
$/boe, 2017 |
$/boe |
$/boe, 2017 |
|||
Nostrum Oil&Gas |
NOG LN |
Kazakhstan |
GBp |
180.0 |
436.0 |
1415.9 |
-23.88 |
253.63 |
n/m |
5.6 |
488.0 |
221.8 |
14308 |
2.9 |
2.0 |
99.0 |
Exillon Energy |
EXI LN |
Russia |
GBp |
70.6 |
146.8 |
271.6 |
47.6 |
80.5 |
3.1 |
3.4 |
500.3 |
0 |
3874 |
0.5 |
0.5 |
70.1 |
Petroneft resources |
PTR LN |
Russia |
GBp |
1.5 |
14.6 |
15.6 |
n/m |
n/m |
n/m |
n/m |
65.0 |
16 |
817 |
0.2 |
0.2 |
19.1 |
Volga Gas |
VGAS LN |
Russia |
GBp |
56.0 |
56.7 |
44.5 |
0.3 |
8.8 |
171.9 |
5.1 |
26.5 |
0 |
1806 |
1.7 |
1.7 |
24.6 |
Zoltav resources |
ZOL LN |
Russia |
GBp |
15.0 |
27.4 |
44.9 |
n/m |
n/m |
n/m |
n/m |
210.4 |
5 |
3344 |
0.2 |
0.2 |
13.4 |
Araca energy |
ARACA NS |
Russia |
NOK |
0.1 |
17.3 |
17.7 |
n/m |
n/m |
n/m |
n/m |
2.6 |
|
87 |
6.9 |
6.9 |
202 |
Urals energy |
UEN LN |
Russia |
GBp |
25.0 |
4.1 |
23.3 |
n/m |
n/m |
n/m |
n/m |
108.2 |
0 |
757 |
0.2 |
0.2 |
30.8 |
JKX |
JKX LN |
Ukraine |
GBp |
35.4 |
78.3 |
81.6 |
-17.7 |
25.3 |
n/m |
3.2 |
95.1 |
166 |
3160 |
0.9 |
0.3 |
25.8 |
Regal petroleum |
RPT LN |
Ukraine |
GBp |
50.4 |
207.9 |
167.8 |
2.3 |
17.3 |
90.8 |
9.7 |
13.5 |
75 |
596 |
12.4 |
1.9 |
281.5 |
Caspian Sunrise |
CASP LN |
Kazakhstan |
GBp |
6.4 |
141.9 |
138.2 |
n/m |
n/m |
n/m |
n/m |
29.9 |
|
|
4.6 |
4.6 |
|
Jupiter Energy |
JPR AU |
Kazakhstan |
AUD |
0.1 |
5.9 |
5.6 |
-6.1 |
-2.2 |
n/m |
n/m |
19.2 |
64 |
|
0.3 |
0.1 |
|
Average |
|
|
|
|
|
|
|
|
88.6 |
5.4 |
|
|
|
2.8 |
1.7 |
85.2 |
Source: Company data, Bloomberg, Renaissance Capital
8

vk.com/id446425943
Renaissance Capital
26 November 2018
Oil & Gas
Figure 25: Comparable valuation multiples for oil refiners
Company name |
|
Ticker |
Currency Rating |
Target |
Current price |
|
Upside/ |
MktCap, |
Net debt, |
EV, |
|
P/E, x |
|
|
EV/EBITDA, x |
|
Div yield, % |
Refining capacity EV/production |
|||||||||||||||
|
price |
22-Nov-18 |
downside |
$mn |
$mn |
$mn |
2018E |
2019E |
2020E |
2018E |
2019E |
|
2020E |
2018E |
2019E |
|
mnt pa, 2017 |
|
$/boe, 2017 |
||||||||||||||
Our coverage universe |
|
|
|
|
|
|
|
|
|
|
|
|
|
|
|
|
|
|
|
|
|
|
|
|
|
|
|
|
|
|
|
|
|
Tupras (RenCap estimates) |
TUPRS TI |
TRY |
BUY |
176.0 |
123.8 |
|
42% |
5,842 |
1,687 |
7,528 |
7.3 |
4.7 |
4.6 |
|
5.8 |
4.2 |
4.1 |
10.9 |
17.0 |
|
28.1 |
|
|
|
36.6 |
||||||||
Tupras (consensus estimates) |
TUPRS TI |
|
|
|
|
|
|
|
|
|
|
|
|
9.1 |
6.5 |
5.2 |
|
5.6 |
5.1 |
4.5 |
12.4 |
17.0 |
|
|
|
|
|
|
|
|
|||
MOL (RenCap estimates) |
|
MOL HB |
HUF |
BUY |
4,200 |
3,160 |
|
33% |
7,872 |
2,342 |
10,214 |
8.2 |
9.0 |
9.4 |
|
4.0 |
4.1 |
4.2 |
3.0 |
3.3 |
|
20.9 |
|
|
|
66.7 |
|||||||
MOL (consensus estimates) |
|
MOL HB |
|
|
|
|
|
|
|
|
|
|
|
|
8.4 |
7.6 |
7.1 |
|
4.2 |
4.0 |
4.0 |
3.7 |
3.6 |
|
|
|
|
|
|
|
|
||
PKN ORLEN (RenCap estimates) |
|
PKN PW |
PLN |
HOLD |
98.0 |
104.6 |
|
-6% |
11,884 |
1,380 |
13,264 |
7.7 |
8.7 |
8.5 |
|
5.5 |
5.4 |
5.4 |
3.0 |
3.2 |
|
35.2 |
|
|
|
51.4 |
|||||||
PKN ORLEN (consensus estimates) |
|
PKN PW |
|
|
|
|
|
|
|
|
|
|
|
|
9.2 |
9.4 |
9.0 |
|
5.7 |
5.7 |
5.4 |
3.1 |
3.2 |
|
|
|
|
|
|
|
|
||
Grupa LOTOS (RenCap estimates) |
|
LTS PW |
PLN |
BUY |
92.0 |
77.3 |
|
|
19% |
3,796 |
996 |
4,792 |
10.3 |
7.1 |
6.0 |
|
6.9 |
5.0 |
4.4 |
1.4 |
1.5 |
|
10.5 |
|
|
|
62.3 |
||||||
Grupa LOTOS (consensus estimates) |
|
LTS PW |
|
|
|
|
|
|
|
|
|
|
|
|
9.7 |
10.2 |
8.3 |
|
5.9 |
6.0 |
5.1 |
2.3 |
2.7 |
|
|
|
|
|
|
|
|
||
OMV Petrom (RenCap estimates) |
|
SNP RE |
RON |
BUY |
0.46 |
0.36 |
|
|
26% |
5,054 |
(1,178) |
3,876 |
6.6 |
7.1 |
7.9 |
|
2.2 |
2.2 |
2.3 |
5.8 |
6.0 |
|
4.5 |
|
|
|
117.5 |
||||||
OMV Petrom (consensus estimates) |
|
SNP RE |
|
|
|
|
|
|
|
|
|
|
|
|
6.4 |
5.8 |
6.0 |
|
2.1 |
2.0 |
2.1 |
7.8 |
7.8 |
|
|
|
|
|
|
|
|
||
Cap-weighted average |
|
|
|
|
|
|
|
|
|
|
|
|
|
|
7.9 |
7.7 |
7.7 |
|
4.9 |
4.4 |
4.3 |
4.6 |
5.8 |
|
23.5 |
|
|
|
63.3 |
||||
Comparable companies |
|
|
|
|
|
|
|
|
|
|
|
|
|
|
|
|
|
|
|
|
|
|
|
|
|
|
|
|
|
|
|
|
|
Motor Oil (consensus estimates) |
|
MOH GA |
EUR |
|
|
19.9 |
|
|
|
|
2,512 |
337 |
2,797 |
7.9 |
8.2 |
6.9 |
|
4.4 |
4.6 |
4.0 |
7.0 |
7.7 |
|
9.2 |
|
|
|
41.4 |
|||||
Neste Oil (consensus estimates) |
NESTE FH |
EUR |
|
|
68.7 |
|
|
|
|
20,107 |
489 |
20,294 |
17.2 |
15.3 |
14.3 |
|
10.8 |
9.9 |
9.4 |
3.3 |
3.5 |
|
15.0 |
|
|
|
184.6 |
||||||
Hellenic Petroleum (consensus estimates) |
ELPE GA |
EUR |
|
|
|
6.9 |
|
|
|
|
2,422 |
2,166 |
4,556 |
7.1 |
7.7 |
7.1 |
|
5.3 |
5.7 |
5.6 |
6.0 |
6.8 |
|
17.0 |
|
|
|
36.6 |
|||||
Saras (consensus estimates) |
|
SRS IM |
EUR |
|
|
|
1.7 |
|
|
|
|
1,879 |
(94) |
1,796 |
15.8 |
8.9 |
6.7 |
|
4.1 |
3.5 |
2.8 |
5.7 |
7.4 |
|
15.0 |
|
|
|
16.3 |
||||
Phillips 66 (consensus estimates) |
|
PSX US |
USD |
|
|
92.5 |
|
|
|
|
43,184 |
6,991 |
56,073 |
10.2 |
9.7 |
8.5 |
|
7.1 |
6.7 |
6.0 |
3.7 |
3.9 |
|
109.5 |
|
|
|
69.8 |
|||||
Valero (consensus estimates) |
|
VLO US |
USD |
|
|
78.6 |
|
|
|
|
33,605 |
3,022 |
40,180 |
12.4 |
8.6 |
6.6 |
|
6.6 |
5.2 |
4.4 |
4.4 |
4.7 |
|
154.4 |
|
|
|
35.5 |
|||||
Marathon Petroleum (consensus estimates) |
|
MPC US |
USD |
|
|
61.9 |
|
|
|
|
44,028 |
9,935 |
62,353 |
16.2 |
9.2 |
7.6 |
|
8.0 |
5.1 |
4.6 |
3.2 |
3.5 |
|
93.7 |
|
|
|
90.8 |
|||||
Cap-weighted average |
|
|
|
|
|
|
|
|
|
|
|
|
|
|
13.4 |
10.0 |
8.5 |
|
7.7 |
6.2 |
5.6 |
3.8 |
4.1 |
|
97.7 |
|
|
|
82.2 |
||||
|
|
|
|
|
|
|
|
|
|
|
|
|
|
|
|
|
|
|
|
|
|
|
|
Source: Company data, Bloomberg, Renaissance Capital estimates |
|||||||||
Figure 26: Comparable valuation table for petrochemical companies |
|
|
|
|
|
|
|
|
|
|
|
|
|
|
|
|
|
|
|
|
|
|
|
|
|
|
|
|
|
||||
Company name |
|
Ticker |
Currency |
Rating |
Target |
|
Current price |
Upside/ |
MktCap, |
Net debt, |
EV, |
|
|
P/E, x |
|
|
|
|
EV/EBITDA, x |
|
Div yield, % |
||||||||||||
|
|
price |
|
22-Nov-18 |
downside |
$mn |
$mn |
|
$mn |
|
2018E |
2019E |
|
2020E |
|
2018E 2019E |
|
2020E |
|
2018E |
|
2019E |
|||||||||||
|
|
|
|
|
|
|
|
|
|
|
|
|
|
|
|
||||||||||||||||||
European petrochemicals |
|
|
|
|
|
|
|
|
|
|
|
|
|
|
|
|
|
|
|
|
|
|
|
|
|
|
|
|
|
|
|
|
|
Petkim (RenCap estimates) |
|
PETKM TI |
TRY |
HOLD |
|
|
8.0 |
5.2 |
|
54% |
1,614 |
616 |
|
2,230 |
|
8.8 |
3.5 |
3.1 |
|
9.8 |
6.6 |
4.7 |
|
0.0 |
14.2 |
||||||||
Petkim (consensus estimates) |
|
PETKM TI |
|
|
|
|
|
|
|
|
|
|
|
|
|
|
|
8.7 |
7.5 |
|
6.0 |
|
8.1 |
6.9 |
|
6.8 |
|
8.4 |
|
9.6 |
|||
BASF |
|
BAS GY |
EUR |
|
|
|
|
65.7 |
|
68,932 |
13,807 |
90,984 |
|
10.9 |
10.3 |
9.5 |
|
7.7 |
7.2 |
6.8 |
|
5.1 |
5.2 |
||||||||||
Solvay |
|
SOLB BB |
EUR |
|
|
|
|
|
94.3 |
|
11,402 |
3,888 |
17,968 |
|
11.8 |
10.9 |
|
9.7 |
|
7.2 |
6.7 |
|
6.3 |
|
3.9 |
|
4.1 |
||||||
Arkema |
|
AKE FP |
EUR |
|
|
|
|
83.4 |
|
7,288 |
1,270 |
|
8,714 |
|
9.2 |
9.0 |
8.4 |
|
5.2 |
5.1 |
4.8 |
|
3.2 |
3.5 |
|||||||||
Lanxess |
|
LXS GR |
EUR |
|
|
|
|
|
49.9 |
|
5,211 |
2,740 |
|
9,410 |
|
10.4 |
11.2 |
|
9.9 |
|
8.3 |
7.8 |
|
7.3 |
|
2.1 |
|
2.5 |
|||||
Cap-weighted average |
|
|
|
|
|
|
|
|
|
|
|
|
|
|
|
|
|
|
10.8 |
10.2 |
9.3 |
|
7.5 |
7.0 |
6.6 |
|
4.5 |
5.0 |
|||||
MENA petrochemicals |
|
|
|
|
|
|
|
|
|
|
|
|
|
|
|
|
|
|
|
|
|
|
|
|
|
|
|
|
|
|
|
|
|
Saudi Basic Industries |
|
SABIC AB |
SAR |
|
|
|
|
116.6 |
|
93,880 |
(1,420) |
107,016 |
|
14.8 |
14.5 |
14.4 |
|
7.6 |
7.6 |
7.6 |
|
4.2 |
4.3 |
||||||||||
Yanbu National Petrochemical |
|
YANSAB AB |
SAR |
|
|
|
|
|
66.0 |
|
10,195 |
(509) |
|
9,495 |
|
13.8 |
13.1 |
|
15.4 |
|
9.3 |
8.8 |
|
9.7 |
|
6.5 |
|
6.6 |
|||||
Saudi Kayan Petrochemical |
|
KAYAN AB |
SAR |
|
|
|
|
13.7 |
|
5,510 |
5,753 |
10,688 |
|
9.3 |
10.3 |
12.0 |
|
7.8 |
7.9 |
8.1 |
|
|
|
1.8 |
|||||||||
Cap-weighted average |
|
|
|
|
|
|
|
|
|
|
|
|
|
|
|
|
|
|
14.4 |
14.2 |
|
14.4 |
|
7.8 |
7.7 |
|
7.8 |
|
4.2 |
|
4.4 |
||
US petrochemicals |
|
|
|
|
|
|
|
|
|
|
|
|
|
|
|
|
|
|
|
|
|
|
|
|
|
|
|
|
|
|
|
|
|
Westlake Chemical |
|
WLK US |
USD |
|
|
|
|
|
67.5 |
|
8,963 |
2,306 |
11,328 |
|
8.0 |
8.2 |
|
7.2 |
|
5.1 |
5.2 |
|
4.8 |
|
1.4 |
|
1.5 |
||||||
Eastman Chemical |
|
EMN US |
USD |
|
|
|
|
80.0 |
|
11,243 |
6,345 |
17,745 |
|
9.2 |
8.8 |
8.3 |
|
7.7 |
7.4 |
7.1 |
|
2.9 |
3.1 |
||||||||||
LyondellBasell Industries |
|
LYB US |
USD |
|
|
|
|
|
91.4 |
|
35,442 |
5,789 |
42,794 |
|
7.6 |
8.0 |
|
7.0 |
|
5.9 |
6.0 |
|
5.6 |
|
4.6 |
|
4.9 |
||||||
Cap-weighted average |
|
|
|
|
|
|
|
|
|
|
|
|
|
|
|
|
|
|
8.0 |
8.2 |
7.3 |
|
6.1 |
6.2 |
5.8 |
|
3.8 |
4.0 |
|||||
Source: Company data, Bloomberg, Renaissance Capital estimates
9

vk.com/id446425943
Renaissance Capital
26 November 2018
Oil & Gas
Figure 27: Price performance of oil and gas companies in Russia, FSU and EM
|
|
|
Current price |
MktCap, |
52 weeks |
Share price performance, |
Share price performance |
Share price performance |
Share price performance (rel. to |
||||||||||||||
Company name |
Ticker |
Currency |
|
(abs),% |
|
|
(rel. to RTS Index), % |
(rel. to MSCI EM Index), % |
Bloomberg World Oil & Gas Index), % |
||||||||||||||
|
|
|
22-Nov-18 |
$mn |
High |
Low |
1W |
1M |
3M |
12M |
1W |
|
1M |
3M |
12M |
1W |
1M |
3M |
12M |
1W |
1M |
3M |
12M |
|
|
|
|
|
|
||||||||||||||||||
Gazprom |
GAZP RX |
RUB |
153.9 |
55,493 |
177.0 |
128.2 |
-0.1 |
-0.4 |
8.1 |
16.3 |
0.8 |
-2.7 |
4.1 |
6.0 |
1.5 |
-2.2 |
19.3 |
18.9 |
2.4 |
3.9 |
21.0 |
3.6 |
|
NOVATEK |
NVTK RM |
RUB |
1,124.0 |
51,978 |
1,215.0 |
647.3 |
-0.4 |
3.3 |
12.5 |
67.2 |
0.5 |
|
1.0 |
8.7 |
51.4 |
1.2 |
1.5 |
23.9 |
64.3 |
2.1 |
7.6 |
25.6 |
48.9 |
Rosneft |
ROSN RX |
RUB |
411.1 |
66,357 |
522.8 |
281.7 |
-3.4 |
-10.6 |
-5.5 |
34.5 |
-2.5 |
-13.0 |
-10.0 |
22.2 |
-1.8 |
-12.4 |
5.2 |
35.2 |
-0.9 |
-6.3 |
6.9 |
19.8 |
|
LUKOIL |
LKOH RX |
RUB |
4,813.5 |
54,983 |
5,192.5 |
3,262.5 |
-1.2 |
-0.1 |
7.1 |
41.0 |
-0.3 |
|
-2.4 |
3.0 |
28.1 |
0.4 |
-1.8 |
18.2 |
41.0 |
1.3 |
4.3 |
19.9 |
25.6 |
Surgutneftegas |
SNGS RX |
RUB |
27.3 |
19,243 |
30.9 |
26.0 |
-0.7 |
1.4 |
-3.6 |
-7.0 |
0.3 |
-0.9 |
-8.1 |
-14.7 |
1.0 |
-0.3 |
7.1 |
-1.8 |
1.9 |
5.8 |
8.8 |
-17.1 |
|
Surgutneftegas Prefs |
SNGSP RX |
RUB |
37.5 |
4,397 |
39.0 |
27.5 |
-1.6 |
3.2 |
4.2 |
23.8 |
-0.7 |
|
0.8 |
0.0 |
12.7 |
0.0 |
1.4 |
15.2 |
25.6 |
0.9 |
7.5 |
16.9 |
10.2 |
Gazprom Neft |
SIBN RX |
RUB |
362.8 |
26,198 |
404.6 |
241.2 |
-4.9 |
-1.8 |
8.6 |
38.3 |
-4.0 |
-4.2 |
4.5 |
25.6 |
-3.3 |
-3.6 |
19.8 |
38.5 |
-2.4 |
2.5 |
21.5 |
23.2 |
|
Tatneft |
TATN RM |
RUB |
755.0 |
26,221 |
847.1 |
452.3 |
-1.8 |
-2.4 |
-1.8 |
54.4 |
-0.9 |
|
-4.7 |
-6.2 |
40.0 |
-0.2 |
-4.2 |
9.0 |
52.9 |
0.7 |
1.9 |
10.7 |
37.5 |
Tatneft Prefs |
TATNP RX |
RUB |
520.0 |
1,168 |
597.3 |
341.0 |
-4.3 |
-6.9 |
3.5 |
45.4 |
-3.4 |
-9.2 |
-0.7 |
32.0 |
-2.7 |
-8.6 |
14.5 |
44.9 |
-1.8 |
-2.5 |
16.2 |
29.5 |
|
Bashneft |
BANE RX |
RUB |
1,944.0 |
5,217 |
2,495.0 |
1,901.0 |
-1.1 |
-0.1 |
-0.6 |
-17.1 |
-0.1 |
|
-2.4 |
-5.0 |
-23.8 |
0.5 |
-1.8 |
10.2 |
-10.8 |
1.4 |
4.3 |
11.9 |
-26.2 |
Bashneft prefs |
BANEP RX |
RUB |
1,850.0 |
839 |
1,952.5 |
1,282.0 |
-1.8 |
1.9 |
9.6 |
20.6 |
-0.9 |
-0.5 |
5.6 |
9.9 |
-0.2 |
0.1 |
20.8 |
22.8 |
0.7 |
6.2 |
22.5 |
7.4 |
|
Russneft |
RNFT RM |
RUB |
522.6 |
2,341 |
634.0 |
462.2 |
-2.2 |
-9.5 |
-15.2 |
n/a |
-1.3 |
|
-11.8 |
-20.2 |
n/a |
-0.6 |
-11.3 |
-5.0 |
n/a |
0.3 |
-5.2 |
-3.3 |
n/a |
Transneft pref |
TRNFP RX |
RUB |
169,550.0 |
18,395 |
188,037.1 |
138,200.0 |
-1.2 |
-1.3 |
11.2 |
-5.4 |
-0.3 |
-3.6 |
7.3 |
-13.3 |
0.4 |
-3.1 |
22.5 |
-0.4 |
1.3 |
3.0 |
24.2 |
-15.8 |
|
Cap-weighted average |
|
|
|
|
|
|
(1.7) |
(2.1) |
4.3 |
33.7 |
(0.7) |
|
(4.4) |
0.1 |
21.6 |
(0.0) |
(3.8) |
15.3 |
34.4 |
0.9 |
2.3 |
17.0 |
19.2 |
Transport companies |
|
|
|
|
|
|
|
|
|
|
|
|
|
|
|
|
|
|
|
|
|
|
|
Transneft |
TRNFP RX |
RUB |
169,550.0 |
18,395 |
188,037.1 |
138,200.0 |
-1.2 |
-1.3 |
11.2 |
-5.4 |
-0.3 |
|
-3.6 |
7.3 |
-13.3 |
0.4 |
-3.1 |
22.5 |
-0.4 |
1.3 |
3.0 |
24.2 |
-15.8 |
KazTransOil |
KZTO KZ |
KZT |
1,320.7 |
1,394 |
1,620.0 |
1,230.0 |
-1.3 |
0.6 |
-2.6 |
-0.5 |
-0.3 |
-2.6 |
-12.3 |
-7.9 |
0.4 |
-2.1 |
3.0 |
5.1 |
1.3 |
4.0 |
4.7 |
-10.3 |
|
Cap-weighted average |
|
|
|
|
|
|
(1.2) |
(1.2) |
10.3 |
(5.1) |
(0.3) |
|
(3.6) |
5.9 |
(12.9) |
0.4 |
(3.0) |
21.1 |
(0.0) |
1.3 |
3.1 |
22.8 |
(15.4) |
Alternatives |
|
|
|
|
|
|
|
|
|
|
|
|
|
|
|
|
|
|
|
|
|
|
|
Nostrum |
NOG LN |
GBp |
180.0 |
436 |
374.0 |
166.4 |
-2.1 |
-17.4 |
-31.2 |
-46.6 |
-2.0 |
|
-18.9 |
-39.8 |
-42.4 |
-1.3 |
-18.3 |
-24.6 |
-29.4 |
-0.4 |
-12.2 |
-22.8 |
-44.8 |
Exillon Energy |
EXI LN |
GBp |
70.6 |
147 |
105.0 |
63.2 |
-2.8 |
2.9 |
-0.4 |
-30.8 |
-2.7 |
1.7 |
-9.1 |
-26.0 |
-2.0 |
2.2 |
6.1 |
-13.1 |
-1.1 |
8.3 |
7.8 |
-28.5 |
|
PetroNeft Resources |
PTR LN |
GBp |
1.5 |
15 |
2.1 |
1.3 |
-1.7 |
7.3 |
5.4 |
-9.2 |
-1.6 |
|
6.1 |
-3.4 |
-3.7 |
-0.9 |
6.6 |
11.8 |
9.2 |
0.0 |
12.7 |
13.5 |
-6.2 |
Volga Gas |
VGAS LN |
GBp |
56.0 |
57 |
61.5 |
49.0 |
-2.7 |
-1.8 |
0.0 |
-6.8 |
-2.6 |
-3.1 |
-8.7 |
-1.3 |
-1.9 |
-2.5 |
6.5 |
11.7 |
-1.0 |
3.6 |
8.2 |
-3.7 |
|
Urals Energy |
UEN LN |
GBp |
25.0 |
4 |
130.0 |
20.0 |
-28.6 |
-20.6 |
-73.7 |
-58.7 |
-28.4 |
|
-22.1 |
-82.1 |
-54.9 |
-27.7 |
-21.5 |
-66.9 |
-42.0 |
-26.8 |
-15.4 |
-65.2 |
-57.3 |
Zoltav Resources |
ZOL LN |
GBp |
15.0 |
27 |
30.5 |
11.0 |
7.1 |
7.1 |
-11.8 |
13.2 |
7.2 |
5.9 |
-20.4 |
19.5 |
7.9 |
6.5 |
-5.2 |
32.4 |
8.8 |
12.6 |
-3.5 |
17.0 |
|
JKX Petroleum |
JKX LN |
GBp |
35.4 |
78 |
48.0 |
10.3 |
-9.0 |
-22.2 |
22.1 |
189.0 |
-8.9 |
|
-23.7 |
13.3 |
201.3 |
-8.2 |
-23.1 |
28.5 |
214.2 |
-7.3 |
-17.0 |
30.2 |
198.8 |
Regal Petroleum |
RPT LN |
GBp |
50.4 |
208 |
64.0 |
6.2 |
-11.3 |
3.8 |
39.9 |
660.0 |
-11.2 |
2.6 |
31.0 |
688.5 |
-10.5 |
3.1 |
46.2 |
701.4 |
-9.6 |
9.2 |
47.9 |
686.0 |
|
Cadogan Petroleum |
CAD LN |
GBp |
6.3 |
18 |
10.0 |
6.0 |
-15.8 |
-15.8 |
-27.3 |
-22.6 |
-15.7 |
|
-17.2 |
-35.9 |
-17.5 |
-15.0 |
-16.6 |
-20.7 |
-4.6 |
-14.1 |
-10.5 |
-19.0 |
-20.0 |
Caspian Sunrise |
CASP LN |
GBp |
6.4 |
142 |
14.0 |
5.8 |
3.8 |
-22.0 |
-32.3 |
-43.2 |
3.9 |
-23.5 |
-40.9 |
-38.9 |
4.6 |
-22.9 |
-25.7 |
-26.0 |
5.5 |
-16.8 |
-24.0 |
-41.3 |
|
Cap-weighted average |
|
|
|
|
|
|
(3.7) |
(9.7) |
(5.6) |
105.5 |
(3.6) |
|
(11.1) |
(14.3) |
114.8 |
(2.9) |
(10.5) |
0.9 |
127.7 |
(2.0) |
(4.4) |
2.6 |
112.3 |
FSU Cap-weighted average |
|
|
|
|
|
(1.6) |
(2.0) |
4.6 |
31.8 |
(0.7) |
(4.4) |
0.4 |
20.0 |
(0.0) |
(3.8) |
15.6 |
32.8 |
0.9 |
2.3 |
17.3 |
17.5 |
||
EM refiners |
|
|
|
|
|
|
|
|
|
|
|
|
|
|
|
|
|
|
|
|
|
|
|
Tupras |
TUPRS TI |
TRY |
123.8 |
5,842 |
144.2 |
93.1 |
0.1 |
-7.4 |
-0.4 |
-2.5 |
1.0 |
-9.8 |
-4.8 |
-10.7 |
1.7 |
-9.2 |
10.4 |
2.2 |
2.6 |
-3.1 |
12.1 |
-13.1 |
|
MOL |
MOL HB |
HUF |
3,160.0 |
7,872 |
3,230.5 |
2,488.0 |
1.6 |
5.9 |
12.8 |
-0.9 |
2.5 |
|
3.6 |
8.9 |
-9.3 |
3.2 |
4.1 |
24.1 |
3.6 |
4.1 |
10.2 |
25.8 |
-11.8 |
PKN ORLEN |
PKN PW |
PLN |
104.6 |
11,884 |
123.9 |
80.2 |
5.7 |
14.9 |
8.2 |
-14.6 |
6.6 |
12.6 |
4.2 |
-21.5 |
7.3 |
13.2 |
19.4 |
-8.6 |
8.2 |
19.3 |
21.1 |
-24.0 |
|
Grupa LOTOS |
LTS PW |
PLN |
77.3 |
3,796 |
77.6 |
51.6 |
5.5 |
11.3 |
9.8 |
24.7 |
6.4 |
|
8.9 |
5.8 |
13.5 |
7.1 |
9.5 |
21.0 |
26.5 |
8.0 |
15.6 |
22.7 |
11.1 |
OMV Petrom |
SNP RE |
RON |
0.4 |
5,054 |
0.4 |
0.3 |
-4.1 |
-7.7 |
10.5 |
26.3 |
-3.2 |
-10.0 |
6.5 |
15.0 |
-2.5 |
-9.5 |
21.7 |
27.9 |
-1.6 |
-3.4 |
23.4 |
12.5 |
|
Petkim |
PETKM TI |
TRY |
5.2 |
1,614 |
7.8 |
3.8 |
2.4 |
-1.3 |
-0.4 |
-12.5 |
3.3 |
|
-3.7 |
-4.8 |
-19.7 |
4.0 |
-3.1 |
10.4 |
-6.7 |
4.9 |
3.0 |
12.1 |
-22.1 |
Cap-weighted average |
|
|
|
|
|
|
2.3 |
5.1 |
7.9 |
0.3 |
3.3 |
2.7 |
3.8 |
(8.2) |
4.0 |
3.3 |
19.1 |
4.7 |
4.9 |
9.4 |
20.8 |
(10.7) |
|
RTS Index |
|
|
|
|
|
|
(0.4) |
2.2 |
8.3 |
(2.4) |
|
|
|
|
|
|
|
|
|
|
|
|
|
MSCI EM Index |
|
|
|
|
|
|
(1.0) |
1.6 |
(6.9) |
(15.3) |
|
|
|
|
|
|
|
|
|
|
|
|
|
Bloomberg World Oil & Gas Index |
|
|
|
|
|
(1.9) |
(4.5) |
(8.6) |
0.1 |
|
|
|
|
|
|
|
|
|
|
|
|
|
|
Source: Company data, Bloomberg, Renaissance Capital
10