

vk.com/id446425943
GLOBAL INVESTMENT COMMITTEE / COMMENTARY |
MARCH 2019 |
|
|
On the Markets
MICHAEL WILSON
Chief Investment Officer
Chief US Equity Strategist
Morgan Stanley & Co.
TABLE OF CONTENTS
Goldilocks Whiplash
2The narrative about lack of inflation is making the rounds again. Watch out.
Waiting for Europe
4Europe has long tried investors’ patience. Perhaps a pay-off is near.
Playing a Recovery in China
5Investors can invest directly or through US companies that sell to China.
Price Makers, Price Takers
It’s better to own companies that can set
6prices, rather than those who accept them.
Short Takes
We look at stock buybacks’ role in equity
8returns, what retail sales may be saying about the economy and why Libor has parted company from short-term rates.
Managing a Critical Asset
9Cash runs the household, and plays a role in investing. Both roles need attention.
Q&A: Don’t Fight the PBOC
China’s central bank wants to stimulate
11the economy, so investors should act accordingly, says investment manager Jan van Eck.
The Power of Momentum
For those of us who took physics in high school, we know from Newtonian dynamics that an object’s momentum can be measured by its mass and velocity. Newton’s first law of motion states, “A body at rest will remain at rest and a body in motion will remain in motion unless it is acted upon by an external force.” In the absence of an external force or friction, that object could remain in motion indefinitely without additional force or energy. Think of a rocket that has achieved escape velocity.
So what does this simple law of physics have to do with investing? Well, investors are well versed in the power of momentum. In fact, over the past few decades, price momentum has become one of the more popular strategies followed by both active and passive investors. Since the financial crisis, I would argue these strategies have become even more popular. The proliferation of quantitative managers who practice trendfollowing, combined with the suppression of volatility by aggressive monetary policies around the world, produced strong returns.
Of course, price momentum can cut both ways, and the fourth quarter of last year, December in particular, was a harsh reminder of that fact. There is little doubt about which way price momentum is moving now, as global equity markets are off to their strongest start since 1991. There is also growing consensus around the view that there may be little in the way to stop it. Going back to physics, in the absence of external forces or friction, the object is likely to continue on its upward path—hence, the growing bullishness by both investors and market commentators.
As a market strategist, it’s my job to incorporate such factors into our price targets and advice to our clients. However, it’s also my responsibility to make sure our clients understand the risk/reward proposition for the price movements we expect. Price momentum is a powerful and sometimes seemingly unstoppable force, like now or in December. However, one thing is clear—the risk/reward assessment for buying stocks is worse today than it was in late December, even though price momentum is currently bullish. It’s often said that stocks are luxury goods, and nobody really feels comfortable buying a luxury item on sale for fear there must be something wrong with it. While we are unlikely to see the kind of negative price momentum we experienced late last year, sometimes price momentum doesn’t need an external force—e.g., a reason—to roll over. It just takes a little gravitational pull.

vk.com/id446425943
ON THE MARKETS / STRATEGY
Goldilocks
Whiplash
ANDREW SHEETS
Chief Cross-Asset Strategist
Morgan Stanley & Co.
Markets frequently change their minds, but even adjusting for that,
the shift in “conventional wisdom” in recent months has been nothing short of whiplash. In December, there was widespread agreement among investors that recession risk had risen sharply, that rising inflation pressures would keep central banks tightening policy and that US-based risks around trade and government funding had gone up significantly. Skip forward two months and these fears have been replaced by a different, if familiar, term: “Goldilocks.”
The Goldilocks narrative made repeated appearances between 2010 and 2016, and the current version sounds something like this: “Inflationary pressures have receded, giving central banks wide latitude to pause almost indefinitely on policy tightening. Global growth is slowing, but not enough
to be truly concerning, and US political risks are close to resolution, with growing investor optimism that lasting solutions to funding the US government and US-China trade are now within reach.” We are skeptical that this story holds together.
LACK OF INFLATION. The Goldilocks narrative depends on a lack of inflation, which gives central banks the opportunity—though not the obligation— to continue accommodative monetary policies. Core inflation in developed markets has moved sideways in recent months, forward-looking inflation expectations have dropped sharply and emerging market inflation sits near a 15year low. Taken together, investors sound more emboldened that a lack of inflation pressure means that central banks have nothing but time.
We’re not so sure. Even with recent energy-led declines, headline inflation is near the 25-year average in the US. The same could be said for the UK, France,
Unemployment Rates in the US, Japan and the Euro Zone Are Near 20-Year Lows
14% Unemployment Rate
|
20-Year Minimum-Maximum Range |
12 |
Current |
|
|
10 |
|
|
Germany and Japan. The unemployment rate sin the US, Japan and the Euro Zone are near their 20-year lows (see chart). Not surprisingly, measures of wage growth in the US and Europe continue to push higher. All these suggest that developed market economies are working with significantly less spare capacity than they were under prior periods when Goldilocks reigned.
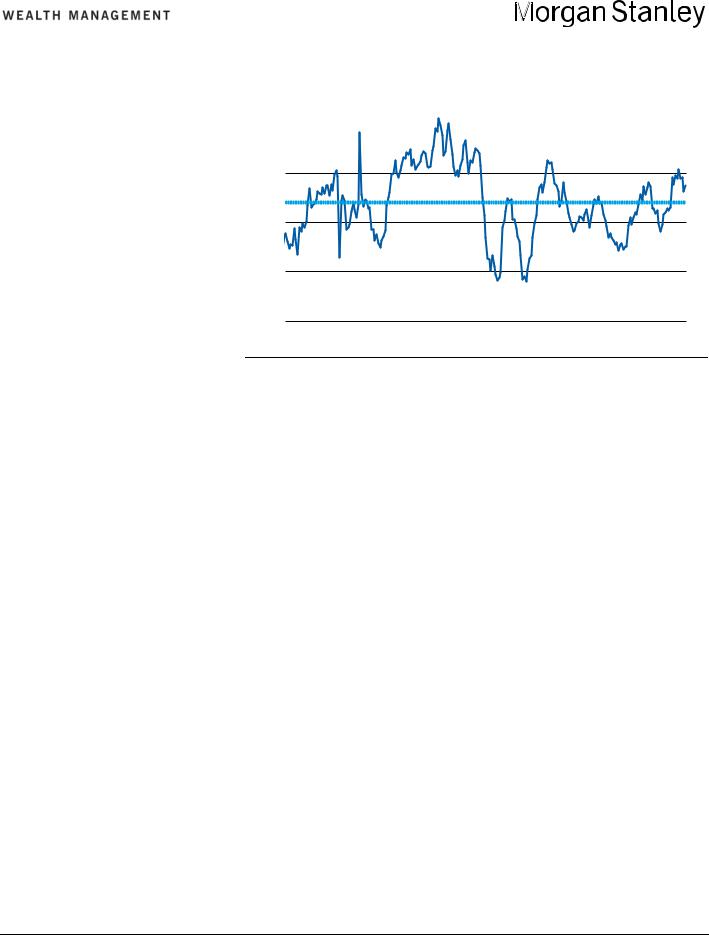
SETTING BENCHMARKS. It’s also important to be careful with level-setting in the inflation discussion. Yes, current inflation as measured by the US core Personal Consumption Expenditure (PCE) Index, at an annualized 2.2% rate, is low by the standards of the past 60 years. Still, it is far less extreme relative to past decades. Lest one thinks that inflation provides a true late-cycle warning signal, this is a good time to remember that the core PCE is currently at the same level as it was in May 2007 and higher than May- to-December 1999 (see chart, page 3).
Goldilocks is about more than a lack of inflation; it also requires enough growth to allay downside fears, and that’s our other problem with this argument. Global growth data remain poor. The weakness in the data is notably broad. Trade data, global purchasing managers’ indexes and earnings revisions have all turned sharply lower in the past three months—a powerful reminder that weakness in the fourth quarter of 2018 wasn’t simply about the Federal Reserve—and, while US data have held up better, it’s hardly been immune. In January, we saw the worst month-on-month decline in US retail sales since the early 2000s.
8
6
4
2
0
US |
Japan |
Euro Zone |
WEAKNESS TROUGHING? There is a good debate about whether this weakness is currently troughing. Morgan Stanley & Co. economists think we are close to more aggressive economic stimulus from China, viewing the sharp rise in total social financing in the most recent monthly data as a sign that policymakers are taking bold actions. However, if these measures provide a strong boost to the Chinese—
Source: Bloomberg, Morgan Stanley & Co. Research as of Feb. 11, 2019
Please refer to important information, disclosures and qualifications at the end of this material. |
March 2019 |
2 |
vk.com/id446425943
and the global—economy, that wouldn’t fit the Goldilocks script. If these measures fail to materialize, or are unsuccessful, it wouldn’t be Goldilocks, either.
Meanwhile, it’s important to remember that the weakness in US earnings is just beginning. Our US equity strategists now expect just 1% earnings-per-share growth for the entire year, a reminder that the challenges to the US fundamental story aren’t going away any time soon.
POLITICAL FACTORS. Finally, there’s politics. The third part of the Goldilocks story is that risks around US trade and government funding will now provide positive catalysts. MS & Co.’s US public policy team, led by Michael Zezas, disagrees. This is partly because investor optimism on both issues has already risen materially, while key issues remain unresolved. On trade, the Trump administration put the increased tariffs for China on hold, but major issues remain unresolved. On government funding, President Trump’s declaration of a state of emergency to secure funding for a border wall set up a new confrontation with Congress and the likelihood of a long court battle.
Core PCE Inflation Remains Above the 20-Year Average
|
US Core Personal Consumption Expenditure Index |
2.5% |
20-Year Average |
|
2.0
1.5
1.0
0.5
1999 2001 2003 2005 2007 2009 2011 2013 2015 2017
Source: Bloomberg, Morgan Stanley & Co. Research as of Feb. 11, 2019
In short, we think that investors should be skeptical of the Goldilocks narrative and look for strategies that benefit from inconsistencies within it. Big picture, we are not looking to add exposure here, and we have been looking to reduce some emerging market beta into strength. Our forecast for stimulus that will help China growth stabilize while US growth continues to moderate supports the strategic case to be short the broad US
dollar and overweight international over US equities as well as a bullish view on both A-shares and the renminbi. On a smaller scale, our rates strategists continue to think that the level of US real rates is too high relative to expectations that the Fed is now done hiking for the cycle. Either those expectations of further hikes should come up, or 10-year real rates should come down.
Please refer to important information, disclosures and qualifications at the end of this material. |
March 2019 |
3 |

vk.com/id446425943
ON THE MARKETS / EQUITIES
Waiting for
Europe
LISA SHALETT
Chief Investment Officer
Morgan Stanley Wealth Management
One of the most persistent stories of the past decade has been US stocks
outperforming the rest of the world, and one of the most dramatic examples is the US versus Europe. From March 2009 through Feb. 27, the S&P 500 Index gained nearly 300%, while the Euro STOXX 600 Index logged just 105%.
Why has Europe been such a laggard? Plagued by slow economic growth and lack of progress on fiscal and political integration, Europe has become vulnerable to volatile, populist and nationalistic politics and structural threats like Brexit and France’s “yellow vest” protests. The European Central Bank (ECB) has tried to follow the Fed’s Quantitative Easing (QE) playbook to pump up the economy, but the sheer complexity of navigating policy while sovereign debt markets are still priced for national budget dynamics has made policy less effective. Still, we have continued to see opportunity.
AN EXPORT PLAY. At the start of 2018, the Global Investment Committee (GIC) increased its allocation to European equities believing its dependence on global exports—48% of GDP, twice the level of China and three times that of the US— would allow it to benefit from the global recovery we forecast. Instead, the US dollar strengthened, which wreaked havoc with emerging markets growth; escalating trade tensions emanating from Washington made matters worse. By midyear, China’s economy started to slow and Germany’s auto industry was contracting, in part due to threats of new US tariffs. GDP growth, at a healthy 2.8% annualized pace in 2018’s first quarter, fell to 1.2% by the fourth quarter.
This year, growth has continued to deteriorate. January purchasing managers’ indexes indicate recession in Italy, and there has been no improvement in Germany, France or Spain. The IFO Business Climate Index is at recession levels. Earnings revisions are pointing
Economic Disappointments in Europe May Be Ending
60 |
Citi Economic Surprise Index |
|
||
40 |
Euro Zone |
US |
|
|
20 |
|
|
|
|
0 |
|
|
|
|
-20 |
|
|
|
|
-40 |
|
|
|
|
-60 |
|
|
|
|
-80 |
|
|
|
|
-100 |
|
|
|
|
-120 |
|
|
|
|
Feb '18 |
May '18 |
Aug '18 |
Nov '18 |
Feb '19 |
Source: Bloomberg as of Feb. 26, 2019
toward a corporate profits recession, with year-over-year earnings shrinking by about 1%. Equity valuations are extremely low in such early-cycle sectors as financials, materials, autos and transports, where dividend yields range between 4% and 6%. Sentiment is awful, with hedge funds’ net long exposure to Europe in the 20th percentile. Still, the Euro STOXX 600 is up 9.6% for the year to date.
UPWARD SURPRISE. Why? Economic growth may be within a quarter of troughing and surprises may be poised to turn upward now that expectations have washed out (see chart). In Germany, a trough may be forming for auto-related manufacturing, with factory orders up 4% in January—the best reading in eight months. Should China’s recovery take hold and reignite trade, the weak euro should be a tailwind for exports. Consumption should also get a boost as real wage growth rebounds.
Then there’s the policy arena. The ECB remains loose with QE as bond proceeds are being reinvested and the central bank continues to buy sovereign debt. On the fiscal side, politicians are trying to address populist concerns. In both France and Italy, budget deficit guidelines look likely to be breached; Italy is moving toward a universal basic income; Spain is boosting the minimum wage by 22%; and Germany is making tax reforms that favor pension savings and childcare.
THE POLITICAL CARD. Politics remains the biggest wild card. Still, investors are already skeptical and any positive news of “muddle through” could be rewarded. The upcoming resumption of auto tariff talks with the US could take a negative turn if Washington feels emboldened about progress with China, but more likely the resolution will be to stretch out negotiations. The end of March could bring a “no deal” or “hard” Brexit. However, in our view, Brexit is more likely to be resolved in some way that stabilizes the UK economy. In that case, it would be plus for Europe, too.
Please refer to important information, disclosures and qualifications at the end of this material. |
March 2019 |
4 |
vk.com/id446425943
ON THE MARKETS / EQUITIES
Playing a Prospective
Recovery in China
DANIEL SKELLY
Senior Equity Strategist
Morgan Stanley Wealth Management
KEVIN DEMERS, CFA
Equity Strategist
Morgan Stanley Wealth Management
Last year, China’s GDP growth slowed to 6.6%—the lowest level since 1990.
The stock market was hit hard, too, as the Shanghai Shenzen Composite CSI 300 Index lost more than a third of its value. Now, the government is taking steps to spur growth and, so far this year, the index has recovered about half of last year’s losses. This sets up an opportunity for investment in China.
Of course, the equity play depends on an economic rebound. In our view, a combination of monetary and fiscal stimulus measures will likely stabilize growth in the current quarter and pick up as the year progresses (see chart). These include continued cuts in reserve requirements, perpetual bond issuance for banks and tax incentives that could, say Morgan Stanley & Co. economists, boost GDP by up to 0.6%.
Next, we believe thawing trade tensions
with the US could drive growth. Michael Zezas, MS & Co.’s policy strategist, believes that a further escalation of tariffs is unlikely, as both China and the US have seen economic growth slow and US companies are calling out the negative impact of tariffs. Indeed, the announcement late last month that the US will put the planned March 1 tariff increases on hold supports this view. Finally, since the Federal Reserve has paused interest rate hikes, Chinese policymakers have room to cut rates. Even so, MS & Co. currency strategists expect the renminbi to strengthen as China becomes more dependent on foreign capital, which would improve total returns for US investors.
The most direct way to play a China recovery is through A-shares, which trade at a compelling 12 times the 2019 consensus earnings per share. In addition, MS & Co. strategists recently raised their forecast for the Shanghai Shenzen to 4,300, a 17% gain. Many US companies appear well positioned to benefit, too. We see opportunity in these sectors:
Petrochemicals. MS & Co. analysts
MS & Co. Anticipates an Upturn in China GDP Growth
7.2% China Real GDP Growth, Annualized Historic Morgan Stanley & Co. Forecast
7.0
6.8
6.6
6.4
6.2
6.0
2015 |
2016 |
2017 |
2018 |
2019 |
Source: Morgan Stanley & Co. Research as of Feb. 25, 2019
expect Chinese petrochemical demand growth of 5%. Trade resolution and a growth rebound offer a potential upside. Recent capacity additions have been digested faster than previous cycles, which should drive margin expansion.
Construction and agricultural machinery. Government stimulus and improving credit growth should bolster Chinese infrastructure, benefitting companies that sell machinery into these markets. If tariffs are lifted, constructionequipment companies should broadly benefit from better underlying demand and price/cost dynamics. Furthermore, recent new-order data for agricultural equipment have slowed as US farmers take a wait- and-see approach on tariffs. Improving clarity on trade may drive new investment to augment existing replacement cycles.
Commercial aerospace. China is an important market for aerospace companies, responsible for some 18% of total deliveries over the next 20 years. Notably, while China has maintained a neutral response to the industry to date and placed no retaliatory tariffs on aircraft imports, new orders have slowed. With normalized new orders two-to-three times higher than the recent pace, we see nearterm opportunity for accelerated activity. This is because China needs to expand its aircraft fleet to support continued growth in air traffic. Longer term, Chinese demand for air travel and tourism should remain robust, given rising wealth levels.
Auto supply chain. Last year, Chinese passenger car sales fell to 23.7 million units, a 4.4% decline, due to restrictive financing standards, falling consumer confidence and tariff-related disruptions. However, as stimulus takes hold, we believe there are attractive recovery plays other than the automakers. We favor the higher-growth contributors to the auto supply chain—particularly makers of connectivity technology and glass-related products—as they should benefit not only from volume recovery but also from content gains longer term.
Please refer to important information, disclosures and qualifications at the end of this material. |
March 2019 |
5 |
vk.com/id446425943
ON THE MARKETS / THEMATIC INVESTING
Price Makers, Price Takers
And Technological
Deflation
SCOTT HELFSTEIN, PhD.
Senior Investment Strategist
Morgan Stanley Wealth Management
IAN P. MANLEY
Investment Strategist
Morgan Stanley Wealth Management
As consumers, we all recognize pricing power. Companies with pricing
power make goods—from mobile phones to athletic shoes and autos—that cost significantly more than their competitors and for which demand is so strong that they rarely go on sale. Companies that can set a price are “price makers,” while those with little ability to move prices are “price takers.” Investing in firms with pricing power while avoiding those with limited ability to influence prices could prove a lucrative strategy.
Firms with pricing power can often increase prices of final goods without losing significant market share or volume. Importantly, even firms with pricing power can’t raise prices indefinitely. At
some price, customers will either forego the product, or prices will reach levels generating sufficiently attractive returns to draw new competitors into the market.
Across a range of economic conditions, makers should be better positioned to provide the stable and growing profits likely to foster stronger investment returns. While there is nothing revolutionary about that statement in itself, structural economic changes make pricing power more important going forward, especially given the deflationary pressures of technology.
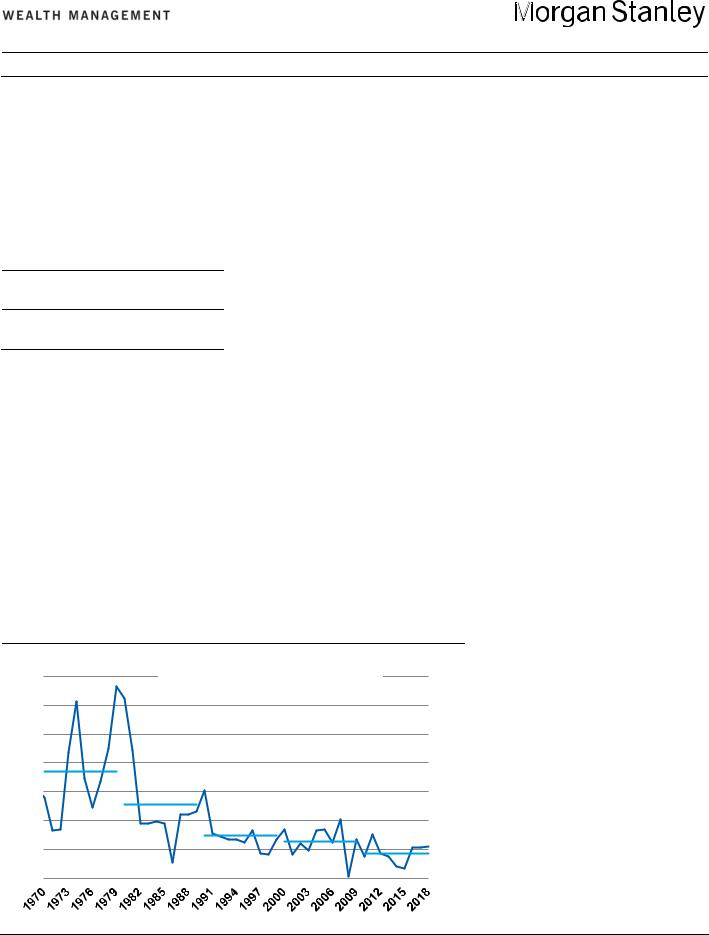
TECHNOLOGICAL DEFLATION. The technology-driven efficiency boom that helped drive a doubling in S&P 500 profit margins since 1990 does come with a cost frequently referred to as “technological deflation.” As companies innovate quicker and identify new cost savings, goods get cheaper. From 1950 to 1989, US inflation averaged 4.3%. Since 1990, it has dropped to 2.5%. Since the 1980s, inflation has
Secular Deflation in Decline for Nearly 50 Years
14% CPI, Year Over Year
CPI, Decade Average, Year Over Year
12
10
8
6
4
2
0
Source: Bloomberg, Morgan Stanley Wealth Management as of Dec. 31, 2018
fallen in subsequent decades (see chart). Since 2010, it has averaged only 1.9%.
In this environment, firms with pricing power have an extra lever to maintain or grow profits that price takers do not. This gives price makers more consistent profitability and growth as long as they maintain pricing power. The gradual increase in the value of intangible or nonphysical assets, like patents or brand value, reflects the importance of differentiation as a means to achieve pricing power. Makers can ride out a range of economic conditions better than other firms. Takers may look to overall price inflation to sustain and grow profits, but that is an unreliable strategy when under price deflation.
POWER SOURCES. Pricing power can be derived by external industry structure or the internal characteristics of a specific firm. Factors outside the firm that can impact pricing power include the competitiveness of the industry, barriers to entry and the concentration of suppliers and buyers. The unique nature of goods and services offerings such as quality or brand value is internal to the firm.
The structure of industries makes them more or less competitive. If there is only one player, the company has monopolistic pricing power and can charge whatever they want within broad limits. While monopoly market structures offer the most powerful pricing power, they are so easily abused that regulation often prevents their emergence or continuation. An industry may also have a small number of large players that dominate the market, known as an oligopoly. When there are only a few players, firms could formally or informally cooperate in setting prices. When there are a large number of firms offering similar goods, firms engage in price competition. Without anything to distinguish one product from another, these products become commoditized and the low-cost producer wins.
BARRIERS TO ENTRY. Industries with large barriers to entry will have fewer competitors than those that are easier to
Please refer to important information, disclosures and qualifications at the end of this material. |
March 2019 |
6 |

vk.com/id446425943
An Investment Framework for Identifying Pricing Power
External |
|
|
Power Over |
|
|
Buyers/Suppliers |
|
|
|
|
(percent of revenue to each) |
|
|
|
|
Gross Margins
(average postcrisis)
Internal |
|
|
Value of Marketing and |
|
|
Distribution |
|
|
|
|
(SG&A as a percent of sales) |
|
|
|
|
Note: Postcrisis margins are yearly averages from 2009 through 2018
Source: Bloomberg, Morgan Stanley Wealth Management
enter. Barriers can be funding, resources or technological expertise. Others may include regulatory guidelines, operating permits and intellectual property rights. As data-oriented firms become a larger part of the economy, an important barrier is the network effect: The more people that use a service, the more valuable it is.
Just as industry concentration affects pricing power, the availability of suppliers and customers matters, too. If a company’s suppliers are concentrated or if there is a high switching cost, suppliers can force a company to pay higher prices. The same rule applies to customers. The more concentrated a company’s set of buyers, the more power those buyers have.
PRODUCT DIFFERENTIATION. Many sources of pricing power lie beyond a firm’s control, but companies can focus on differentiating their product within an industry to capture pricing power. By creating a unique value proposition, firms reduce the risk associated with substitute goods. Firms can limit the impact of substitutes in several ways. The first is
high switching costs for goods or services. An alternative means of differentiating products is moving up the quality scale.
Finally, branding is critical for pricing power. Producing a higher-quality product will not provide companies pricing power if customers do not know there is a quality differential. Branding plays a critical part in signaling quality for products and services. Brand name products can usually charge a premium in the marketplace and are an important source of value for many firms. Companies can tie brands to a range of valuable attributes such as prestige in luxury or environmental sustainability.
MULTIPLE METRICS. Our investment thesis is relatively straightforward: Own firms with pricing power and avoid those without. That said, rigorously identifying firms with pricing power relative to those without is difficult and has received substantial attention in academic work. There is no easy answer. Instead of relying on a single approach, we attempt to identify pricing power using a series of metrics. There are several quantifiable
variables that help triangulate a firm’s pricing power based on industry concentration; intangible assets; power over buyers and suppliers; selling, general and administrative expense (SG&A) as a percent of sales; and gross margins (see chart).
Some industries that seem more likely to make prices are internet and direct marketing retail, pharmaceuticals, media, beverages, and interactive media and services. Takers are largely commodity based, such as metals and mining, construction and engineering, road and rail, auto components and paper and forest products. Investors should recognize that there are also firm-level idiosyncratic factors that can contribute to pricing power, and the industry classifications serve as one step in identifying pockets of potential price makers.
The above is an excerpt from the Jan. 16, 2019, issue of AlphaCurrents. For the full report, please contact your Financial Advisor.
Please refer to important information, disclosures and qualifications at the end of this material. |
March 2019 |
7 |
vk.com/id446425943
ON THE MARKETS / SHORT TAKES
Buybacks Important, but Not a Principal Driver of Equity Returns
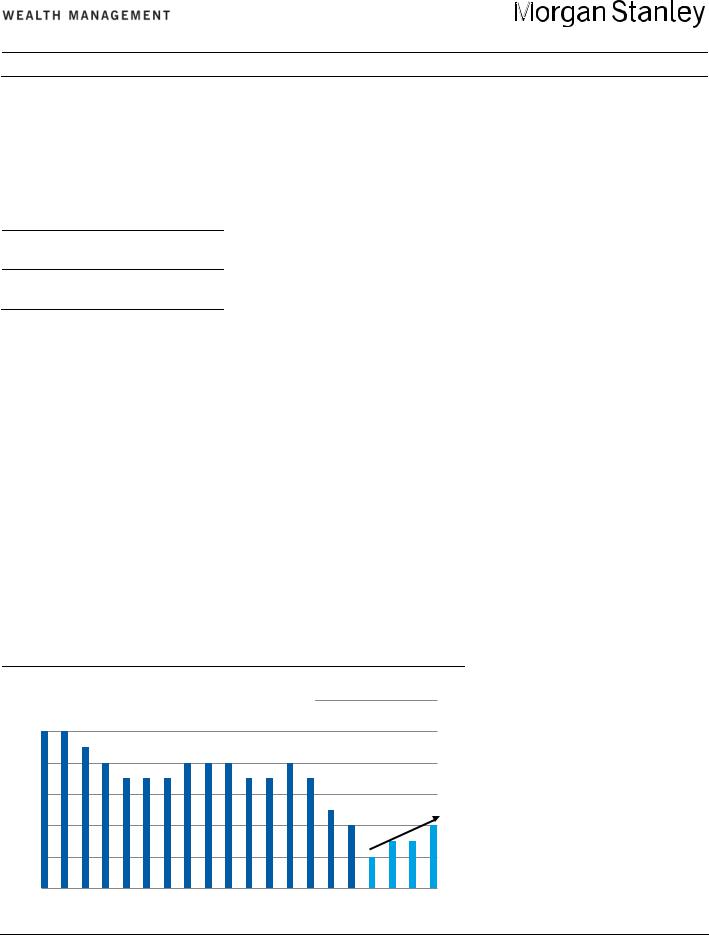
Political headlines about a potential change in the tax treatment of stock buybacks has raised questions about just how much they contribute to equity returns. While they have been a meaningful tailwind for returns since the financial crisis, they have not been a principal driver. In fact, we estimate, from January 2011 through the end of last year, buybacks have accounted for some 12 percentage points of the market’s 124% total return—less than half the contribution from dividends. Of course, the impact varies by sector. In buyback yield, or net buybacks as a percentage of market capitalization, communications services, at 6.2%, was the leader (see chart). That’s nearly three times the market’s buyback yield. For real estate investment trusts and utilities, the yield was negative, indicating companies in those sectors collectively issued more shares than they repurchased.—Michael Wilson
7% |
6.2% |
Average Trailing 12-Mo. Buyback Yield, 2011-2018 |
||||||||||
6 |
|
|||||||||||
|
|
|
|
|
|
|
|
|
|
|
||
5 |
|
|
|
|
|
|
|
|
|
|
|
|
|
|
|
|
|
|
|
|
|
|
|
||
4 |
|
3.3% |
2.7% |
2.7% |
|
|
|
|
|
|
|
|
3 |
|
|
2.2% |
2.1% |
2.0% |
1.8% |
|
|
|
|||
|
|
|
|
|
|
|
||||||
2 |
|
|
|
|
|
|
1.2% |
|
|
|||
|
|
|
|
|
|
|
|
|
|
|||
1 |
|
|
|
|
|
|
|
|
|
|
|
|
|
|
|
|
|
|
|
|
|
|
|
||
0 |
|
|
|
|
|
|
|
|
|
|
|
|
|
|
|
|
|
|
|
|
|
|
|
||
-1 |
|
|
|
|
|
|
|
|
|
|
|
|
|
|
|
|
|
|
|
|
|
-0.5% |
-1.0% |
||
-2 |
|
|
|
|
|
|
|
|
|
|||
Comm. Svs. |
Financials |
Industrials |
Cons. Disc. |
Health Care |
Top 500 |
Staples |
Materials |
Energy |
REITs |
Utilities |
||
|
||||||||||||
Source: ClariFi, Morgan Stanley Research as of Feb 19, 2019
Surprise Slump in Retail Sales Could Signal Fall-Off in GDP Growth
3 % US Retail Sales (month over month)
2
1
0
-1
-2
-3
'09 |
'10 |
'11 |
'12 |
'13 |
'14 |
'15 |
'16 |
'17 |
'18 |
Source: Bloomberg as of Feb. 15, 2019
The December US retail sales report, released Feb. 14, was a shocker. It showed the largest monthly decline in more than nine years (see chart). Compared with November’s results, headline sales fell 1.2%, and tumbled 1.8% when excluding autos, gas and building materials. Morgan Stanley & Co. economists’ retail control group, which also exclude autos, gas and building materials, fell 1.6%, in contrast with the firm’s forecast for a 0.3% gain. Retail sales are closely watched because the consumer accounts for about two-thirds of US GDP. This downside surprise lowers the tracking estimate for fourth-quarter 2018 GDP growth to 3.1% from 3.7%. In addition, MS & Co.’s retail sales tracker points toward a 0.3% decline in retail sales in January, suggesting that first-quarter GDP is now tracking as low as 1%. Late last year, the firm’s first-quarter 2019 forecast was for 2.2% growth. Also of concern is the Citi US Economic Surprise Index, which on Feb. 15 suffered the biggest one-day drop since 2006. That suggests slower growth, too.—Vibhor Dave and Chris Baxter
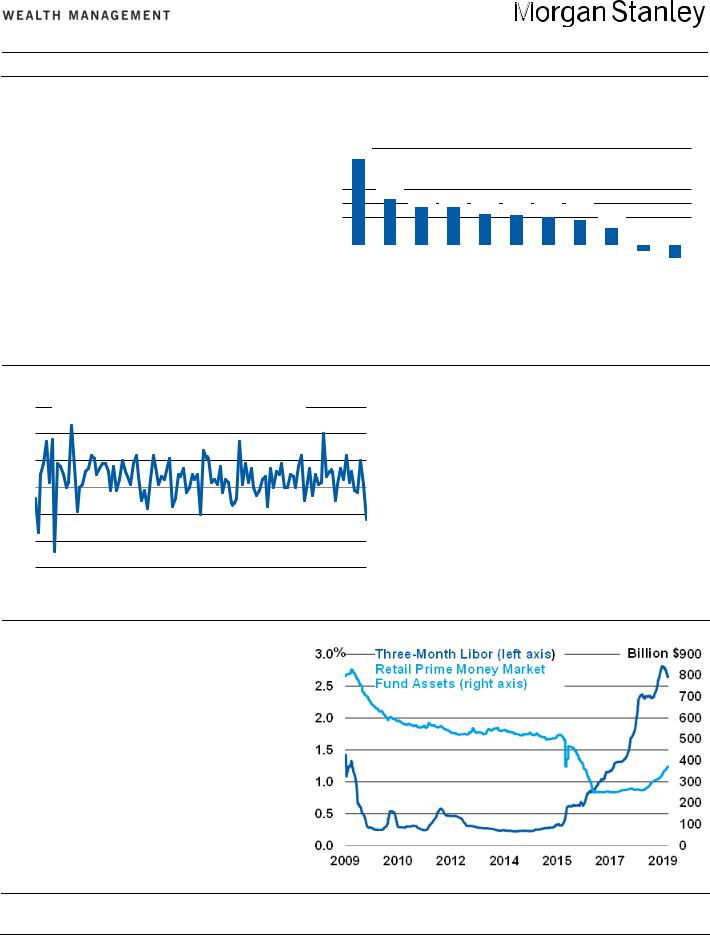
Investor Surge Into Money Market Funds May Be Pressuring Libor
The first rate hike of this tightening cycle was in December 2015. In the preceding three years, the three-month Libor rate averaged less than 30 basis points. Then, as the pace of rate hikes accelerated, Libor rose, too, reaching 2.82% by the end of last year (see chart). Since then, it has fallen to 2.65%, which is the sharpest reversal in years. Why? One reason may be that money market funds need to invest a surge in cash they have received from retail investors, perhaps in reaction to risk assets’ poor performance in the fourth quarter. Money market funds invest in high-quality, ultrashort investments that correlate with Libor. It is uncertain how long Libor will be under pressure but, should it remain around its current level, holders of Libor-linked floating-rate securities may not see as large an upward adjustment to their coupons as they would otherwise expect. —
Daryl Helsing
Source: Bloomberg as of Dec. 31, 2018
Please refer to important information, disclosures and qualifications at the end of this material. |
March 2019 |
8 |
vk.com/id446425943
ON THE MARKETS / CASH
Cash Matters: Managing
A Critical Asset
Cash is the most common source of liquid wealth on a household’s
balance sheet. Due to the different financial roles it plays and forms it takes, it is also one of the most misunderstood. Households use cash to pay bills, diversify portfolios and act as a source of security against the unknown. These different roles lead to confusion when making decisions about cash. Complicating matters further, the needs for cash in different contexts are interrelated. For example, the cash reserves a household should hold for emergencies are related to the cash on hand needed for payments, or the risk tolerance that helps to determine how aggressive a household’s portfolio strategy should be—and thus the cash portion of that strategy—is related to the cash balance it should hold over and above what it has budgeted for expenses, and so on. These dynamics increase the complexity in determining the appropriate amount and type of cash a household should hold.
Common Mistakes
Households often make material errors when it comes to cash. One is to hold too much cash out of concern about risks in the market or a source of income. While these are valid concerns, hedging such risks has costs, and holding excessive quantities of cash drags down a household’s overall return on savings, negatively impacting its ability to meet its long-term financial goals. The converse can also be a costly mistake: when households maintain too little cash due to the desire to boost returns. Such positioning may expose them to the risk of having to liquidate investments at inopportune times due to a personal emergency, a lack of rigorous budgeting or for unexpected expenses. It may also mean that the household is taking more risk than is appropriate or is insufficiently diversified in its investments.
Households often err in what form of cash they use. The most recognizable forms are physical currency and checking
account balances. In fact, cash comes in many flavors with varying attributes of yield and liquidity that make it more or less effective for specific functions.
Household decision-makers are often not aware of the breadth of cash options, nor do they always seek or receive advice in making the right choices.
A working definition for cash is any security that can be readily liquidated into physical currency or to banking balances at the moment of the holder’s choosing without loss of value. This definition means that savings accounts and money market accounts or funds, as well as the types of securities that underlie such investment products (e.g., commercial paper, US Treasury bills and other shortterm government bonds with a maturity generally less than a year) can be considered cash (see chart).
These different forms vary most notably in their yield, the degree to which their ready liquidation without loss can be relied upon and, therefore, the degree to which they deliver the features generally associated with the value of holding cash. In exchange for the assumption of risk, short-term certificates of deposit (CDs), US Treasury bills and commercial paper typically generate higher yields than deposit accounts. CDs can earn a higher yield than cash in a deposit account and
How Liquidity, Risk and Return Line Up on the Cash Spectrum
Risk / Illiquidity
Yield / Return
Source: Morgan Stanley Wealth Management GIC
Ultrashort Duration Fund
Long-Term CD
Stable Value Fund
Short-Term CD
Money Market Account
Savings Account
Checking Account
Please refer to important information, disclosures and qualifications at the end of this material. |
March 2019 |
9 |

vk.com/id446425943
also have no principal risk, as they are insured by the FDIC up to a maximum of $250,000. If cash is required prior to maturity, however, the proceeds may be subject to withdrawal penalties, which may eat into principal.
Similarly, US Treasury bills have higher yields than cash, but have minimal interest rate risk that can lower their market value. Commercial paper, shortterm corporate bonds and other nongovernment debt, in addition to interest rate risk, carry credit risk, which could result in loss if the issuer defaults. They also incur transaction costs in the form of bid/ask spreads if liquidated prior to maturity. Money market mutual funds, which invest in securities such as Treasuries, commercial paper, and shortterm corporate bonds, also typically earn a higher yield, reflecting the underlying investments. Depending on whether they are government or retail funds, they carry the risks of those individual securities and charge management fees.
In other words, while cash is generally liquid, low risk and generates low total returns primarily via interest income as opposed to capital gains, there is actually a continuum in which liquidity, risk and return vary considerably. That variation can be acutely consequential, as risks can manifest themselves at inopportune moments. Small differences in returns add up over extended periods of time to large differences that can materially impact the achievability of financial goals.
Start With Need
To understand how to size and manage cash, start by considering why you need it. There are three distinct sources of need for cash, which will vary in magnitude from one household to another. The first is spending money, and sizing the need can be done through budgeting. Much spending is regular and thus predictable— mortgage payments, utilities and insurance. Dining out, vacations and entertainment are variable and discretionary. Then, there are things that come up that might have been anticipated
Prioritized Features Vary by Cash Need
Spending |
Emergency |
Portfolio |
Money |
Savings |
Cash |
|
Liquidity |
|
|
Capital |
|
|
Preservation |
|
Yield
Source: Morgan Stanley Wealth Management
but not accounted for as expenses. As such, households should maintain sufficient balances to support projected spending with some buffer to minimize the potential for costs arising from late payment or overdraft penalties or the risks associated with an impromptu need to liquidate investments.
The second need for cash is as emergency savings to protect against adverse events that could affect the ability to meet financial obligations. If that can be done out of emergency cash, a household will not have to liquidate investments, which can have significantly adverse effects if sold at depressed prices or if the sale triggers steep transaction costs and/or taxes. The third need for cash is as part of an investment strategy. The relative amount of cash that an investment portfolio maintains should be determined according to a household’s financial goals, preferences and available resources. In some cases, cash can enhance a diversified investment strategy, especially for more conservative strategies.
Feature Importance Varies
Identifying need helps to illuminate which characteristics of cash are most valuable depending on how the cash will be used, and how that differs across needs (see chart). For spending money, the optimal solution is an account that supports transactions—typically a checking account. Physical currency, while a plausible way to make payments,
is an increasingly unrealistic method in a rapidly digitizing economy. Given that the average balances households need to cover expenses are an important portion of their wealth, the yield from these balances is an important consideration as well.
When it comes to emergency savings, the desirable features are less constrained by any single factor, and thus the tradeoffs are more complex. Because emergency savings are typically larger than for spending money, yield is even more important. However, capital preservation and reliability of liquidation without losses remain high priorities.
As part of a portfolio’s investment strategy, yield is on par with liquidity, which is somewhat more negotiable than for emergency savings. Yield is still important, especially to facilitate the deployment of capital for investment opportunities that may arise. However, the need for liquidity to facilitate portfolio tactics and yield to support income must be balanced against the more long-term need to provide diversification and total return, including returns sourced from capital appreciation.
The above is an excerpt from the February 2019 Special Report. “Cash Matters: A Framework for Managing a Critical Asset.” The authors are Lisa Shalett, Daniel C. Hunt, CFA, Suzanne Lindquist, Zi Ye, CFA, and Darren Bielawski, CFA. For the complete report, see your Financial Advisor.
Please refer to important information, disclosures and qualifications at the end of this material. |
March 2019 |
10 |
vk.com/id446425943
ON THE MARKETS / Q&A
Don’t Fight
The PBOC
The old adage, “Don’t fight the Fed,” advises investors to buy U.S. stocks
when the Federal Reserve is easing and sell during periods when the central bank is tightening monetary policy. Jan van Eck, CEO of VanEck, has a new twist on that mantra, advising: “Don’t fight the PBOC.” The People’s Bank of China (PBOC) cut short-term rates last year amid dismal performance for Chinese and other emerging markets (EM) equities. Now, van Eck believes that these stimulative actions could have positive aftereffects for investors this year. He recently shared his outlook with Morgan Stanley Wealth Management’s Tara Kalwarski. The following is an edited version of their conversation.
TARA KALWARSKI (TK): What’s your take on what has happened, and what will happen, in China?
JAN VAN ECK (JV): Taking a step back, what I think hurt China’s equity markets last year was a deleveraging campaign by the Chinese government to pull back and slow the explosion of credit that happened several years before. Primarily, they have what they call “social financing”—which I call “unsecured credit”—that goes, in many ways, just to the free enterprise or private sector, as opposed to state-owned enterprises (SOEs).
The effect of the deleveraging was a very tight monetary supply situation, and that’s what I think caused China’s equity markets to contract. It also caused a spike in interest rates for private enterprises. One nuance to understanding China is the fragmentation in credit availability between the SOEs and the private sector.
Interest rates for SOEs did not go up much.
I think there are three cases for China, but the base case is much more positive. I think the government is going to undertake a variety of what we call “drip stimulus” measures to try to make sure that economic growth continues and that credit filters through to the private sector, where it had been effectively almost cut off by the end of last year.
If you believe in this base case of slower-but-continued growth for China and positive, accommodative efforts by the PBOC, it should be good for EM equities as well.
TK: What do you see as the bull vs. bear case for China?
JV: In the bear case, the drip stimulus doesn’t work. They are either not stimulating enough, not using the right toolkit or, because the state-owned sector has easy access to credit, it’s not easy to get credit going back to private enterprises. A lot of private companies are choking from lack of credit. Just because you tell the state-owned banks to lend more, that doesn’t mean the money will go to the private sector. On the fiscal side, the 2018 deficit was the largest on record, so there are limits to how much more the Chinese government can do in terms of fiscal stimulus.
The overly bullish case is that a robust trade deal is struck and there’s continued integration of the supply chain and trade between China and the US
What I see happening is that the economy will continue to do okay, but a process of decoupling is going to start between the US and China. The Trump administration is obviously signaling to
companies to be careful about overinvesting in China, and the tariffs are giving them an economic disincentive to put their supply chain there.
On the Chinese side, I don’t think they are signaling an appetite for a very reformoriented trade deal. It doesn’t appear that they’ve been offering a lot of concessions to the US We also know that the Chinese have agreed to things before—in front of the World Trade Organization and others—and there have been major problems with implementation.
That level of frustration also suggests there won’t be one big kumbaya moment. More likely, we grind through the base case and maybe reach a trade deal, and there is no big political shock.
TK: How did the 2018 trade disputes affect investment opportunities?
JV: I don’t think that was the story, even though it got a lot of headlines. I know “trade talk” is shorthand for USChina tensions—and there are certainly tensions—but I think it was the deleveraging that hurt the Chinese equity and bond markets more than the trade talks.
Having said that, I believe those trade tensions are translating into a longer-term decoupling. There is real frustration on the Chinese side, especially with the Huawei case. The two countries look at the situation extremely differently. The US looks at it as a security issue; China sees it as the US ganging up on a successful Chinese company unfairly.
Whatever view is correct, enthusiasm for US products is at risk in China. We’ve seen that before in China with regard to Korea and Japan. The government is not encouraging it, but it’s just a reality on the ground until that situation is settled.
TK: Given China’s share of the global economy, what is its impact on investors?
JV: China has been a major contributor to global growth. It contributes over 1% to the world’s total growth every year, and
Please refer to important information, disclosures and qualifications at the end of this material. |
March 2019 |
11 |

vk.com/id446425943
our base case is that this continues. That’s why this question is so important.
The effects of China’s growth ripple through every asset class around the world. Directly, it affects emerging markets and commodity prices. Commodity prices and commodity-related equities took a hit in the third quarter of 2018, before it was clear that China was going to start stimulating again.
Other asset classes get hit indirectly. There are US companies doing business in China, so there is an impact on US equities and their supply chains. High yield bonds are affected because energy issues are a large part of that market. If a slowdown in China causes oil prices to go down, as we saw at the end of 2015, it affects the high yield market, too.
China is really part of the global risk on/risk off mechanism. That’s why there are two big questions for investors: China growth, and developed market central bank activity—the Fed and the European Central Bank.
The major risk factor in terms of the outlook for Chinese growth is whether the rate cuts will have the desired impact on credit creation in China. We haven’t seen much of an impact so far. Still, there are some green shoots in the economy. We’ve seen some improvements in construction and in manufacturing fixed investment.
TK: Last year, China experienced its slowest annual growth rate since 1990. Does that concern you?
JV: People have very different ideas in their minds when they think about Chinese growth. I think China’s growth in the medium term is going to slow to something like 4% a year—partially because its GDP per capita is so large that it would lead to huge imbalances if they keep trying to grow at 6% a year. If that’s the case, you could literally have the headline “China’s Growth the Slowest in 30 Years” for 36 straight months.
We generally favor active management for emerging markets, and there are companies that are growing nicely. A business can have 20% annualized profit
growth in China because the economy is so large. There’s so much happening that you don’t need high headline growth for health care companies, technology companies, and all kinds of services companies to potentially grow at very high rates.
In fact, investment in services is coming in at 60% to 70% profit growth, which is extremely high and on a par with a lot of developed economies. So the services sector is becoming important for the Chinese economy as a driver of, and contributor to, growth.
In general, the narrative around emerging markets should not be that 10% GDP growth translates into high stock prices. There isn’t that great a correlation between stock prices and GDP growth. Even in the US last year, we had good growth and bad equity returns.
TK: What’s the most common question you get from investors?
JV: Definitely trade war concerns. That’s why I try to refocus in terms of monetary policy. Politics in general makes investors nervous, but trade tensions make a lot of them question whether they even need emerging markets exposure in their portfolios.
I try to keep it simple. Look at what the Fed is doing. Look at what the PBOC is doing. If the Fed is stimulative now, that’s great—and if China’s central bank is stimulative, then you want to go with that flow, too.
TK: What are your thoughts on various ways to access China?
JV: Philosophically, we have an all-cap emerging markets approach. In the past, we had to look to smaller companies for higher growth rates but, as in the US, large-cap technology companies have been able to show potential for high profit growth. We look at structural growth. We stay away from SOEs, whether in China or elsewhere.
Short-term, though, February is a tough time to figure out what’s going on with China. Earlier in the month, the entire stock market closed because of the New
Year holiday. However, I think the fundamental trends will assert themselves. It also takes a while for central bank stimulus to filter through the Chinese economy. It may take until the second quarter before we see much movement.
TK: Any thoughts regarding China’s long-term growth versus the US?
JV: I would be hesitant today to predict if/when China becomes the world’s dominant economy. Their government very much favors SOEs right now, and that will continue to be a structural impediment. Free enterprise just works better at allocating capital, creating jobs and fostering new technology than do government-run institutions. That has been true in every country in every time period.
If China continues to follow that path, I think it will hurt growth by one to two percentage points a year. If they keep the disincentives for foreign businesses to do business there, I think that will slow their growth potential in the medium and long term and just make them a less important global player. They’ll be important for global growth—just not the dominant player.
Here’s a factoid: China opened its markets in the late 1980s, but they had decimated their economy before then. If their GDP per capita had started at even the level of Nicaragua, their growth since then would only be 4% a year. So this idea of a China miracle, I think, is not true. They’re subject to the same kind of constraints that every other economy is. If you put it in that context, I don’t think they’ll be dominating the world.
Jan van Eck and Van Eck Associates Corporation are not affiliated with Morgan Stanley Wealth Management. Opinions expressed by him are solely his own and may not necessarily reflect those of Morgan Stanley Wealth Management or its affiliates.
Please refer to important information, disclosures and qualifications at the end of this material. |
March 2019 |
12 |
vk.com/id446425943
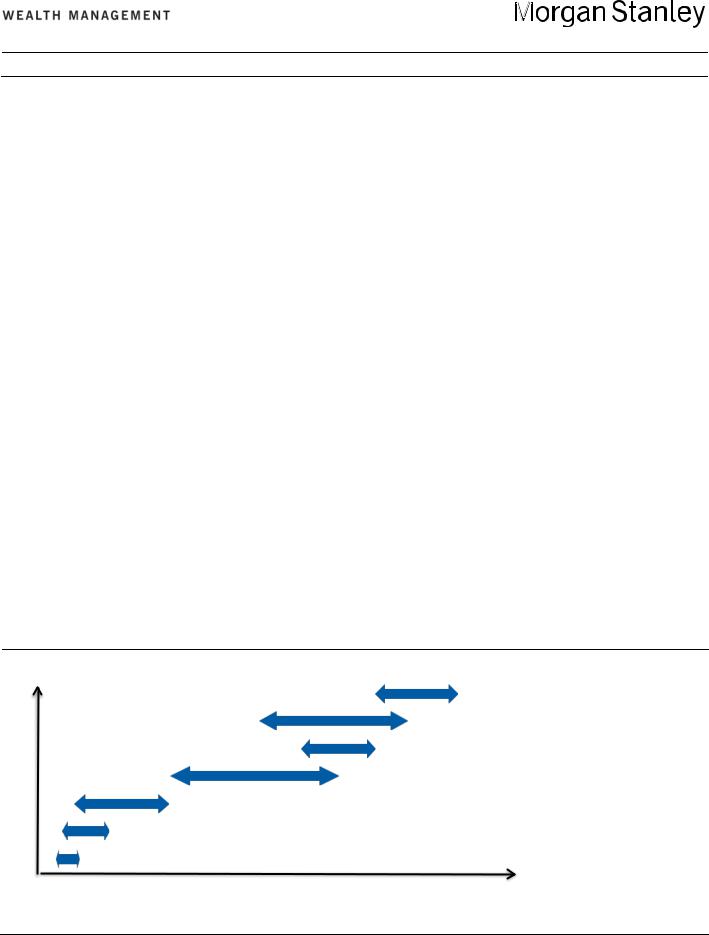
Global Investment Committee Tactical Asset Allocation
The Global Investment Committee provides guidance on asset allocation decisions through its various models. The five models below are recommended for investors with up to $25 million in investable assets. They are based on an increasing scale of risk (expected volatility) and expected return.
Wealth Conservation |
Income |
|
|
Balanced Growth |
Market Growth |
|
|
Opportunistic Growth |
Key |
|
|
Ultrashort Fixed Income
Fixed Income & Preferreds
Equities
Alternatives
Source: Morgan Stanley Wealth Management GIC as of Feb. 28, 2019
Please refer to important information, disclosures and qualifications at the end of this material. |
March 2019 |
13 |

vk.com/id446425943
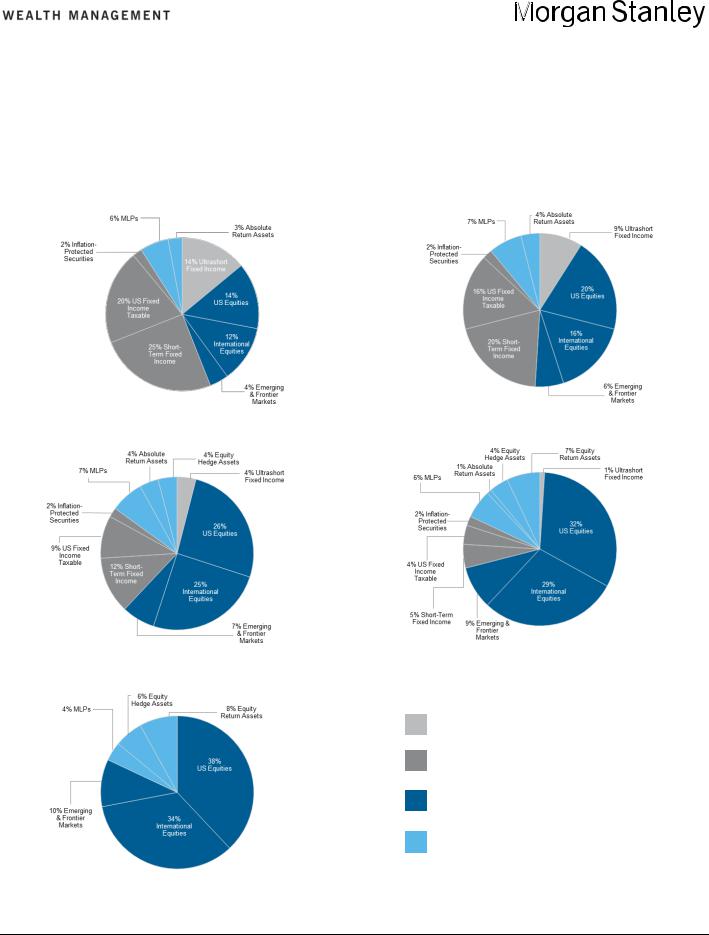
The Global Investment Committee provides guidance on asset allocation decisions through its various models. The five models below are recommended for investors with over $25 million in investable assets. They are based on an increasing scale of risk (expected volatility) and expected return.
Wealth Conservation |
Income |
|
|
Balanced Growth |
Market Growth |
|
|
Opportunistic Growth |
Key |
|
|
Ultrashort Fixed Income
Fixed Income & Preferreds
Equities
Alternatives
Source: Morgan Stanley Wealth Management GIC as of Feb. 28, 2019
Please refer to important information, disclosures and qualifications at the end of this material. |
March 2019 |
14 |

vk.com/id446425943
Tactical Asset Allocation Reasoning
Global Equities |
Relative Weight |
|
Within Equities |
|
|
|
|
After the worst December since 1931, the S&P 500 had its best January since 1987. This kind of volatility is |
|
|
unusual and was precipitated by a Federal Reserve that appeared too hawkish in December, only to reverse |
US |
Underweight |
course on its policy perhaps faster than we’ve ever witnessed. Meanwhile, economic and earnings fundamentals |
|
|
continue to deteriorate, leaving us with an unexciting target of just 2,750 for the S&P 500 this year. As a result, we |
|
|
remain underweight the US. |
International Equities
Overweight
(Developed Markets)
Emerging Markets |
Overweight |
We maintain a positive bias for Japanese and European equity markets. The populist movements around the world are likely to drive more fiscal policy action in both regions, especially in Europe, which will allow the central banks to exit their extraordinary monetary policies and help valuations to rise.
After a difficult first 10 months of 2018, emerging market (EM) equities have performed relatively well, a positive sign for future leadership. With the US dollar appearing to have made a cyclical top, global nominal GDP growth could trough in the first quarter as China’s fiscal stimulus takes hold. This should disproportionately benefit EM equities.
|
Global Fixed |
|
Relative Weight |
|
|
|
|
|
Within Fixed |
|
|
|
|
|
Income |
|
|
|
|
|
|
|
Income |
|
|
|
|
|
|
|
|
|
|
|
|
|
|
|
|
|
|
|
|
|
|
|
We have recommended shorter-duration* (maturities) since March 2013 given the extremely low yields and |
|
|
US Investment Grade |
|
Underweight |
|
potential capital losses associated with rising interest rates from such low levels. With the Quantitative Easing era |
|
|
|
|
now over, long-duration bonds are unlikely to provide the same level of portfolio diversification benefits as they |
|||
|
|
|
|
|
||
|
|
|
|
|
have in the past. Therefore, we remain underweight long-duration bonds. |
|
|
|
|
|
|
|
|
|
International |
|
|
|
Yields are even lower outside the US, leaving very little value in international fixed income, particularly as the |
|
|
|
Underweight |
|
global economy begins to recover more broadly. While interest rates are likely to stay low, the offsetting |
|
|
|
Investment Grade |
|
|
|
||
|
|
|
|
diversification benefits do not warrant much, if any, position, in our view. |
|
|
|
|
|
|
|
|
|
|
|
|
|
|
|
|
Inflation-Protected |
|
|
|
With the recent collapse in oil prices weighing on inflation expectations, these securities still offer relative value in |
||
|
Overweight |
|
the context of our expectations for global growth to accelerate, oil prices to trough and the US dollar to top. In |
|||
Securities |
|
|
||||
|
|
|
short, inflation risk is underpriced. |
|||
|
|
|
|
|
||
|
|
|
|
|
|
|
|
|
|
|
|
High yield bonds have recently fallen victim to the rolling bear market we predicted for global asset markets in |
|
|
High Yield |
|
Underweight |
|
2018. They now offer better risk/reward, but equities still look more attractive given their recent correction. With a |
|
|
|
|
zero weighting in high yield since January 2018, we will revisit our allocation to high yield bonds during 2019 if |
|||
|
|
|
|
|
||
|
|
|
|
|
spreads continue to widen. |
|
|
Alternative |
|
Relative Weight |
|
|
|
|
|
Within |
|
|
|
|
|
Investments |
|
Alternative |
|
|
|
|
|
|
Investments |
|
|
|
|
|
|
|
|
|
|
|
|
|
|
|
Real estate investment trusts (REITs) have rebounded in the second half of 2018 as global growth fears returned |
|
|
REITs |
|
Underweight |
|
and interest rates fell. However, REITs remain expensive and are vulnerable to credit risks. We will revisit our |
|
|
|
|
|
|
position as nominal GDP troughs and/or valuations become more attractive. |
|
|
|
|
|
|
|
|
|
|
|
|
|
Master limited partnerships (MLPs) rebounded sharply in the first half of 2018 only to give it all back as oil prices |
|
|
Master Limited |
|
|
|
collapsed in the fourth quarter. With oil prices recovering again and a more favorable regulatory environment, |
|
|
Partnerships/Energy |
|
Overweight |
|
MLPs should provide a reliable and attractive yield relative to high yield. The supply shortages from Iranian |
|
|
Infrastructure* |
|
|
|
sanctions should also be supportive for fracking activity and pipeline construction, both of which should lead to an |
|
|
|
|
|
|
acceleration in dividend growth. |
|
|
Hedged Strategies |
|
|
|
This asset category can provide uncorrelated exposure to traditional risk-asset markets. It tends to outperform |
|
|
(Hedge Funds and |
|
Equal Weight |
|
when traditional asset categories are challenged by growth scares and/or interest rate volatility spikes. With the |
|
|
Managed Futures) |
|
|
|
recent surge in volatility, these strategies could perform better on a relative basis. |
|
Source: Morgan Stanley Wealth Management GIC as of Feb. 28, 2019
*For more about the risks to Master Limited Partnerships (MLPs) and Duration, please see the Risk Considerations section beginning on page 16 of this report.
Please refer to important information, disclosures and qualifications at the end of this material. |
March 2019 |
15 |

vk.com/id446425943
ON THE MARKETS
The Global Investment Committee (GIC) is a group of seasoned investment professionals from Morgan Stanley & Co. and Morgan Stanley Wealth Management who meet regularly to discuss the global economy and markets. The committee determines the investment outlook that guides our advice to clients. They continually monitor developing economic and market conditions, review tactical outlooks and recommend asset allocation model weightings, as well as produce a suite of strategy, analysis, commentary, portfolio positioning suggestions and other reports and broadcasts.
Chris Baxter, Darren Bielawski Vibhor Dave, Kevin Demers, Scott Helfstein, Daryl Helsing, Daniel Hunt, Tara Kalwarski, Suzanne Lindquist, Ian Manley, Dan Skelly and Zi Ye are not members of the Global Investment Committee and any implementation strategies suggested have not been reviewed or approved by the Global Investment Committee.
Index Definitions
For index, indicator and survey definitions referenced in this report please visit the following:
http://www.morganstanleyfa.com/public/projectfiles/id.pdf
Risk Considerations
Alternative Investments
The sole purpose of this material is to inform, and it in no way is intended to be an offer or solicitation to purchase or sell any security, other investment or service, or to attract any funds or deposits. Investments mentioned may not be suitable for all clients. Any product discussed herein may be purchased only after a client has carefully reviewed the offering memorandum and executed the subscription documents. Morgan Stanley Wealth Management has not considered the actual or desired investment objectives, goals, strategies, guidelines, or factual circumstances of any investor in any fund(s). Before making any investment, each investor should carefully consider the risks associated with the investment, as discussed in the applicable offering memorandum, and make a determination based upon their own particular circumstances, that the investment is consistent with their investment objectives and risk tolerance.
Alternative investments often are speculative and include a high degree of risk. Investors could lose all or a substantial amount of their investment. Alternative investments are suitable only for eligible, long-term investors who are willing to forgo liquidity and put capital at risk for an indefinite period of time. They may be highly illiquid and can engage in leverage and other speculative practices that may increase the volatility and risk of loss. Alternative Investments typically have higher fees than traditional investments. Investors should carefully review and consider potential risks before investing.
Certain information contained herein may constitute forward-looking statements. Due to various risks and uncertainties, actual events, results or the performance of a fund may differ materially from those reflected or contemplated in such forward-looking statements. Clients should carefully consider the investment objectives, risks, charges, and expenses of a fund before investing.
Alternative investments involve complex tax structures, tax inefficient investing, and delays in distributing important tax information. Individual funds have specific risks related to their investment programs that will vary from fund to fund. Clients should consult their own tax and legal advisors as Morgan Stanley Wealth Management does not provide tax or legal advice.
Interests in alternative investment products are offered pursuant to the terms of the applicable offering memorandum, are distributed by Morgan Stanley Smith Barney LLC and certain of its affiliates, and (1) are not FDIC-insured, (2) are not deposits or other obligations of Morgan Stanley or any of its affiliates, (3) are not guaranteed by Morgan Stanley and its affiliates, and (4) involve investment risks, including possible loss of principal. Morgan Stanley Smith Barney LLC is a registered broker-dealer, not a bank.
Hypothetical Performance
General: Hypothetical performance should not be considered a guarantee of future performance or a guarantee of achieving overall financial objectives. Asset allocation and diversification do not assure a profit or protect against loss in declining financial markets.
Hypothetical performance results have inherent limitations. The performance shown here is simulated performance based on benchmark indices, not investment results from an actual portfolio or actual trading. There can be large differences between hypothetical and actual performance results achieved by a particular asset allocation.
Despite the limitations of hypothetical performance, these hypothetical performance results may allow clients and Financial Advisors to obtain a sense of the risk / return trade-off of different asset allocation constructs.
Investing in the market entails the risk of market volatility. The value of all types of securities may increase or decrease over varying time periods.
This analysis does not purport to recommend or implement an investment strategy. Financial forecasts, rates of return, risk, inflation, and other assumptions may be used as the basis for illustrations in this analysis. They should not be considered a guarantee of future performance or a guarantee of achieving overall financial objectives. No analysis has the ability to accurately predict the future, eliminate risk or guarantee investment results. As investment returns, inflation, taxes, and other economic conditions vary from the assumptions used in this analysis, your actual results will vary (perhaps significantly) from those presented in this analysis.
Please refer to important information, disclosures and qualifications at the end of this material. |
March 2019 |
16 |

vk.com/id446425943
ON THE MARKETS
The assumed return rates in this analysis are not reflective of any specific investment and do not include any fees or expenses that may be incurred by investing in specific products. The actual returns of a specific investment may be more or less than the returns used in this analysis. The return assumptions are based on hypothetical rates of return of securities indices, which serve as proxies for the asset classes. Moreover, different forecasts may choose different indices as a proxy for the same asset class, thus influencing the return of the asset class.
An investment in a money market fund is not insured or guaranteed by the Federal Deposit Insurance Corporation or any other government agency. Although the Fund seeks to preserve the value of your investment at $1.00 per share, it is possible to lose money by investing in the fund.
ETF Investing
An investment in an exchange-traded fund involves risks similar to those of investing in a broadly based portfolio of equity securities traded on an exchange in the relevant securities market, such as market fluctuations caused by such factors as economic and political developments, changes in interest rates and perceived trends in stock and bond prices. Investing in an international ETF also involves certain risks and considerations not typically associated with investing in an ETF that invests in the securities of U.S. issues, such as political, currency, economic and market risks. These risks are magnified in countries with emerging markets, since these countries may have relatively unstable governments and less established markets and economics. ETFs investing in physical commodities and commodity or currency futures have special tax considerations. Physical commodities may be treated as collectibles subject to a maximum 28% long-term capital gains rates, while futures are marked-to-market and may be subject to a blended 60% longand 40% short-term capital gains tax rate. Rolling futures positions may create taxable events. For specifics and a greater explanation of possible risks with ETFs¸ along with the ETF’s investment objectives, charges and expenses, please consult a copy of the ETF’s prospectus. Investing in sectors may be more volatile than diversifying across many industries. The investment return and principal value of ETF investments will fluctuate, so an investor’s ETF shares (Creation Units), if or when sold, may be worth more or less than the original cost. ETFs are redeemable only in Creation Unit size through an Authorized Participant and are not individually redeemable from an ETF.
Investors should carefully consider the investment objectives and risks as well as charges and expenses of an exchange-traded fund or mutual fund before investing. The prospectus contains this and other important information about the mutual fund. To obtain a prospectus, contact your Financial Advisor or visit the mutual fund company’s website. Please read the prospectus carefully before investing.
MLPs
Master Limited Partnerships (MLPs) are limited partnerships or limited liability companies that are taxed as partnerships and whose interests (limited partnership units or limited liability company units) are traded on securities exchanges like shares of common stock. Currently, most MLPs operate in the energy, natural resources or real estate sectors. Investments in MLP interests are subject to the risks generally applicable to companies in the energy and natural resources sectors, including commodity pricing risk, supply and demand risk, depletion risk and exploration risk.
Individual MLPs are publicly traded partnerships that have unique risks related to their structure. These include, but are not limited to, their reliance on the capital markets to fund growth, adverse ruling on the current tax treatment of distributions (typically mostly tax deferred), and commodity volume risk.
The potential tax benefits from investing in MLPs depend on their being treated as partnerships for federal income tax purposes and, if the MLP is deemed to be a corporation, then its income would be subject to federal taxation at the entity level, reducing the amount of cash available for distribution to the fund which could result in a reduction of the fund’s value.
MLPs carry interest rate risk and may underperform in a rising interest rate environment. MLP funds accrue deferred income taxes for future tax liabilities associated with the portion of MLP distributions considered to be a tax-deferred return of capital and for any net operating gains as well as capital appreciation of its investments; this deferred tax liability is reflected in the daily NAV; and, as a result, the MLP fund’s after-tax performance could differ significantly from the underlying assets even if the pre-tax performance is closely tracked.
Duration
Duration, the most commonly used measure of bond risk, quantifies the effect of changes in interest rates on the price of a bond or bond portfolio. The longer the duration, the more sensitive the bond or portfolio would be to changes in interest rates. Generally, if interest rates rise, bond prices fall and vice versa. Longer-term bonds carry a longer or higher duration than shorter-term bonds; as such, they would be affected by changing interest rates for a greater period of time if interest rates were to increase. Consequently, the price of a long-term bond would drop significantly as compared to the price of a short-term bond.
International investing entails greater risk, as well as greater potential rewards compared to U.S. investing. These risks include political and economic uncertainties of foreign countries as well as the risk of currency fluctuations. These risks are magnified in countries with emerging markets and frontier markets, since these countries may have relatively unstable governments and less established markets and economies.
Investing in currency involves additional special risks such as credit, interest rate fluctuations, derivative investment risk, and domestic and foreign inflation rates, which can be volatile and may be less liquid than other securities and more sensitive to the effect of varied economic conditions. In addition, international investing entails greater risk, as well as greater potential rewards compared to U.S. investing. These risks include political and economic uncertainties of foreign countries as well as the risk of currency fluctuations. These risks are magnified in countries with emerging markets, since these countries may have relatively unstable governments and less established markets and economies.
Please refer to important information, disclosures and qualifications at the end of this material. |
March 2019 |
17 |

vk.com/id446425943
ON THE MARKETS
Managed futures investments are speculative, involve a high degree of risk, use significant leverage, have limited liquidity and/or may be generally illiquid, may incur substantial charges, may subject investors to conflicts of interest, and are usually suitable only for the risk capital portion of an investor’s portfolio. Before investing in any partnership and in order to make an informed decision, investors should read the applicable prospectus and/or offering documents carefully for additional information, including charges, expenses, and risks. Managed futures investments are not intended to replace equities or fixed income securities but rather may act as a complement to these asset categories in a diversified portfolio.
Investing in commodities entails significant risks. Commodity prices may be affected by a variety of factors at any time, including but not limited to,
(i) changes in supply and demand relationships, (ii) governmental programs and policies, (iii) national and international political and economic events, war and terrorist events, (iv) changes in interest and exchange rates, (v) trading activities in commodities and related contracts, (vi) pestilence, technological change and weather, and (vii) the price volatility of a commodity. In addition, the commodities markets are subject to temporary distortions or other disruptions due to various factors, including lack of liquidity, participation of speculators and government intervention.
Physical precious metals are non-regulated products. Precious metals are speculative investments, which may experience short-term and long term price volatility. The value of precious metals investments may fluctuate and may appreciate or decline, depending on market conditions. If sold in a declining market, the price you receive may be less than your original investment. Unlike bonds and stocks, precious metals do not make interest or dividend payments. Therefore, precious metals may not be suitable for investors who require current income. Precious metals are commodities that should be safely stored, which may impose additional costs on the investor. The Securities Investor Protection Corporation (“SIPC”) provides certain protection for customers’ cash and securities in the event of a brokerage firm’s bankruptcy, other financial difficulties, or if customers’ assets are missing. SIPC insurance does not apply to precious metals or other commodities.
Bonds are subject to interest rate risk. When interest rates rise, bond prices fall; generally the longer a bond's maturity, the more sensitive it is to this risk. Bonds may also be subject to call risk, which is the risk that the issuer will redeem the debt at its option, fully or partially, before the scheduled maturity date. The market value of debt instruments may fluctuate, and proceeds from sales prior to maturity may be more or less than the amount originally invested or the maturity value due to changes in market conditions or changes in the credit quality of the issuer. Bonds are subject to the credit risk of the issuer. This is the risk that the issuer might be unable to make interest and/or principal payments on a timely basis. Bonds are also subject to reinvestment risk, which is the risk that principal and/or interest payments from a given investment may be reinvested at a lower interest rate.
Bonds rated below investment grade may have speculative characteristics and present significant risks beyond those of other securities, including greater credit risk and price volatility in the secondary market. Investors should be careful to consider these risks alongside their individual circumstances, objectives and risk tolerance before investing in high-yield bonds. High yield bonds should comprise only a limited portion of a balanced portfolio.
Interest on municipal bonds is generally exempt from federal income tax; however, some bonds may be subject to the alternative minimum tax (AMT). Typically, state tax-exemption applies if securities are issued within one's state of residence and, if applicable, local tax-exemption applies if securities are issued within one's city of residence.
Treasury Inflation Protection Securities’ (TIPS) coupon payments and underlying principal are automatically increased to compensate for inflation by tracking the consumer price index (CPI). While the real rate of return is guaranteed, TIPS tend to offer a low return. Because the return of TIPS is linked to inflation, TIPS may significantly underperform versus conventional U.S. Treasuries in times of low inflation.
Ultrashort-term fixed income asset class is comprised of fixed income securities with high quality, very short maturities. They are therefore subject to the risks associated with debt securities such as credit and interest rate risk.
Although they are backed by the full faith and credit of the U.S. Government as to timely payment of principal and interest, Treasury Bills are subject to interest rate and inflation risk, as well as the opportunity risk of other more potentially lucrative investment opportunities.
CDs are insured by the FDIC, an independent agency of the U.S. Government, up to a maximum of $250,000 (including principal and accrued interest) for all deposits held in the same insurable capacity (e.g. individual account, joint account, IRA etc.) per CD depository. Investors are responsible for monitoring the total amount held with each CD depository. All deposits at a single depository held in the same insurable capacity will be aggregated for the purposes of the applicable FDIC insurance limit, including deposits (such as bank accounts) maintained directly with the depository and CDs of the depository. For more information visit the FDIC website at www.fdic.gov.
The majority of $25 and $1000 par preferred securities are “callable” meaning that the issuer may retire the securities at specific prices and dates prior to maturity. Interest/dividend payments on certain preferred issues may be deferred by the issuer for periods of up to 5 to 10 years, depending on the particular issue. The investor would still have income tax liability even though payments would not have been received. Price quoted is per $25 or $1,000 share, unless otherwise specified. Current yield is calculated by multiplying the coupon by par value divided by the market price.
The initial interest rate on a floating-rate security may be lower than that of a fixed-rate security of the same maturity because investors expect to receive additional income due to future increases in the floating security’s underlying reference rate. The reference rate could be an index or an interest rate. However, there can be no assurance that the reference rate will increase. Some floating-rate securities may be subject to call risk.
The market value of convertible bonds and the underlying common stock(s) will fluctuate and after purchase may be worth more or less than original cost. If sold prior to maturity, investors may receive more or less than their original purchase price or maturity value, depending on market conditions. Callable bonds may be redeemed by the issuer prior to maturity. Additional call features may exist that could affect yield.
Some $25 or $1000 par preferred securities are QDI (Qualified Dividend Income) eligible. Information on QDI eligibility is obtained from third party sources. The dividend income on QDI eligible preferreds qualifies for a reduced tax rate. Many traditional ‘dividend paying’ perpetual preferred
Please refer to important information, disclosures and qualifications at the end of this material. |
March 2019 |
18 |