

McKinsey - Global gas and LNG outlook to 2035_watermark
.pdf
|
Executive summary Recap 2018–H1 2019 |
Gas demand outlook |
Gas supply outlook |
Infrastructure |
LNG outlook |
Business model |
11 |
vk.com/id446425943 |
|
|
|
|
|
|
|
|
|
|
|
|
|
|
|
B/C China gas demand expected to grow at ~4% p.a., driven by industry/building sector growth, but China’s dependence on imports expected to increase to 58% by 2035
Demand
•Gas demand in China is expected to grow at 4% p.a. mainly driven by the industrial and building sector, which is being driven by coal- to-gas policy
Supply
•China’s dependence on imports is expected to increase from 43% to 58%. The United States, Australia, Russia, and Turkmenistan are expected to be the key suppliers to China
•Central Asia is expected to double (i.e., 75 bcm) its piped gas exports, while Russia through Power of Siberia will add ~38 bcm of piped gas supply
•The United States and Australia are expected to be the largest LNG suppliers to China by 2035, making up ~75% of total LNG imports
Demand |
|
Other energy sector |
|
|
Transport |
Supply |
|
LNG imports |
|
Piped gas imports |
|||
|
|
|
|
|
|||||||||
bcm |
|
Building |
|
Industry |
|
|
|
Power |
bcm |
|
Domestic supply |
||
|
|
|
|
|
|||||||||
550 |
|
|
|
|
550 |
|
|
|
|
|
500 |
|
+4% |
|
|
500 |
|
|
|
|
|
|
|
p.a. |
|
|
|
|
|
|
|
|
450 |
|
|
|
|
450 |
|
|
|
|
|
400 |
|
|
|
|
400 |
|
|
|
|
|
350 |
|
|
|
|
350 |
|
|
|
|
|
300 |
|
|
|
|
300 |
|
|
|
|
|
250 |
|
|
|
|
250 |
|
|
|
|
|
200 |
|
|
|
|
200 |
|
|
|
|
2035 |
|
|
|
|
|
|
|
|
domestic |
||
150 |
|
|
|
|
150 |
|
|
|
|
|
|
|
|
|
|
2018 |
|
|
supply: |
||
100 |
|
|
|
|
100 |
domestic |
|
|
42% |
|
50 |
|
|
|
|
50 |
supply: |
|
|
|
|
|
|
|
|
|
57% |
|
|
|
||
0 |
2020 |
2025 |
2030 |
2035 |
0 |
|
2020 |
2025 |
2030 |
2035 |
2018 |
2018 |
|||||||||
Source: Energy Insights by McKinsey; press search |
|
|
|
|
|
|
|
|||

|
Executive summary Recap 2018–H1 2019 |
Gas demand outlook |
Gas supply outlook |
Infrastructure |
LNG outlook |
Business model |
12 |
vk.com/id446425943 |
|
|
|
|
|
|
|
|
|
|
|
|
|
|
|
B/C North American gas demand expected to grow ~2% p.a., driven by strong exports; Appalachian and Permian basins will supply ~53% of North American market by 2030
Demand |
North America gas demand |
|
CAGR |
North America gas supply |
|
|
|
|
||||||
|
|
|
|
|
|
|||||||||
• LNG exports: United States |
bcm |
Residential, commercial, industrial, and other |
2018–30, % |
bcm |
Shale gas production |
|
Appalachia |
|||||||
and Canadian LNG projects are |
|
Power |
LNG and Mexico export |
|
|
|
|
Canada Shale |
|
Haynesville |
Other US shale |
|||
|
|
|
|
|
|
Associated gas1 |
Niobrara |
SCOOP/STACK |
||||||
competitive even in a long global |
|
|
|
|
|
|
||||||||
|
|
|
|
|
|
|
Eagle Ford |
Permian |
Other associated gas |
|||||
LNG market, leading to a utilization |
|
|
|
|
|
|
|
|||||||
|
|
|
|
|
|
Other |
Conventional2 |
|
Tight and CBM |
|||||
rate maintained above 70% |
1,400 |
|
|
|
|
1,400 |
|
|
|
|
|
|
|
|
|
|
+2% |
|
|
|
|
|
|
|
|
|
|
||
• Power: Expected to grow another |
|
|
|
|
|
|
|
|
|
|
|
|
|
|
1,200 |
|
p.a. |
|
|
1,200 |
|
|
|
|
|
|
|
|
|
|
|
|
|
|
|
|
|
|
|
|
|
|||
~50 bcm as an additional ~70 GW of |
|
|
|
11.6% |
|
|
|
|
|
|
|
|
||
|
|
|
|
|
|
|
|
|
|
|
|
|
||
gas capacity comes online by 2025, |
1,000 |
|
|
|
|
1,000 |
|
|
|
|
|
|
|
|
but the sector will flatten from 2026 |
800 |
|
|
|
1.4% |
800 |
|
|
|
|
|
|
|
|
as it faces strong competition from |
|
|
|
|
|
|
|
|
|
|
|
|||
|
|
|
|
|
|
|
|
|
|
|
|
|||
renewables |
600 |
|
|
|
|
600 |
|
|
|
|
|
|
|
|
|
|
|
|
|
|
|
|
|
|
|
|
|
||
Supply |
400 |
|
|
|
|
400 |
|
|
|
|
|
|
|
|
|
|
|
|
0.6% |
|
|
|
|
|
|
|
|
||
• Appalachian: Production |
|
|
|
|
|
|
|
|
|
|
|
|
|
|
200 |
|
|
|
|
200 |
|
|
|
|
|
|
|
|
|
grows at 6% p.a. as the basin is |
|
|
|
|
|
|
|
|
|
|
|
|
||
|
|
|
|
|
|
|
|
|
|
|
|
|
|
|
debottlenecked in 2018-2019 |
0 |
2020 |
2025 |
2030 |
|
0 |
|
2020 |
|
|
2025 |
2030 |
||
|
2018 |
|
2018 |
|
|
|||||||||
•Permian: Production will increase by ~75 bcm from 2018 to 2030
1 Including conventional and unconventional 2 Including conventional gas basins, Alaska, and offshore Source: Energy Insights by McKinsey
Executive summary Recap 2018–H1 2019 Gas demand outlook Gas supply outlook |
Infrastructure |
LNG outlook |
Business model |
13 |
vk.com/id446425943 |
|
|
|
|
|
|
|
|
|
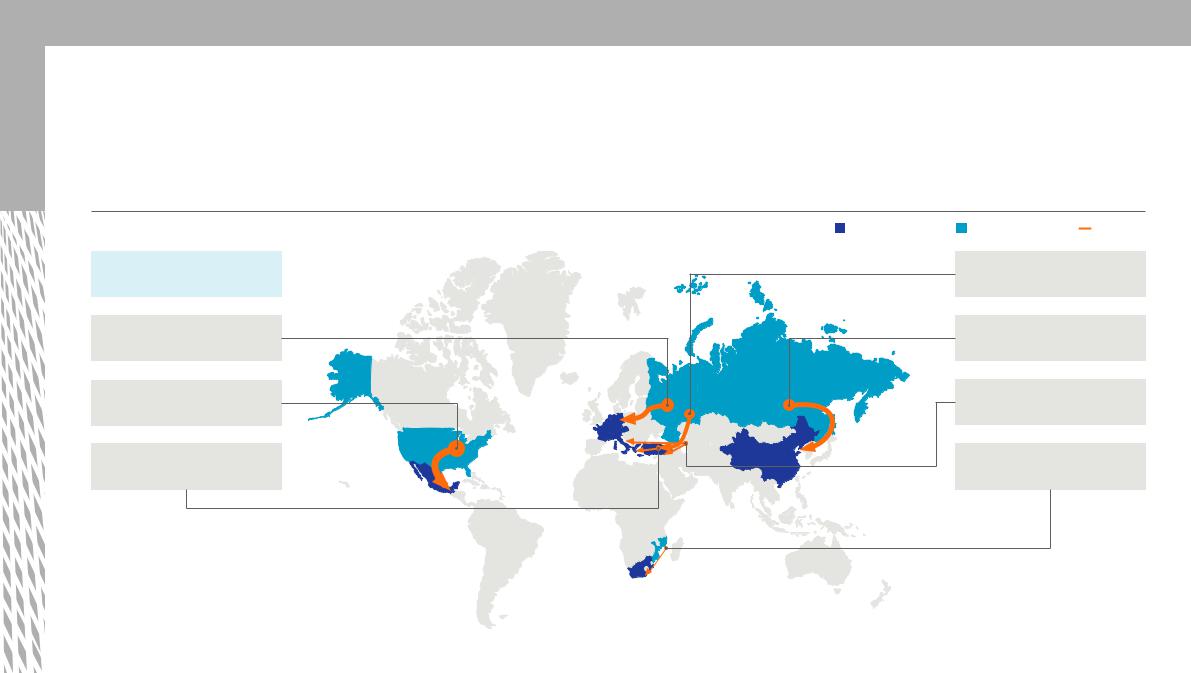
D New pipelines will add more than 200 bcm of cross-border capacity by 2025 with the United States and Russia retaining their positions as major piped gas exporters
Cross-border pipeline projects expected to come online by 2023 |
Importing country Exporting country |
Gas flow |
|
Pipeline |
Turkish Stream1 |
|
|
Expected completion | Capacity |
2020 |
| 31 bcm |
|
Nord Stream 21 |
Power of Siberia1 |
|
|
2020 | 55 bcm |
2020–25 | 38 bcm |
|
|
US–Mexico 3 projects |
SCP2 – expansion |
|
|
2018–19 | 60 bcm |
2019 |
| 16 bcm |
|
Trans-Anatolian Pipeline |
Mozambique and South Africa |
||
(Tanap) 2018 | 16 bcm |
2025 |
| 5 bcm |
|
1 Despite securing funding, the project remains geopolitically contentious |
|
2 South Caucasus pipeline |
Source: Energy Insights by McKinsey; press search |

Executive summary Recap 2018–H1 2019 Gas demand outlook Gas supply outlook |
Infrastructure |
LNG outlook |
Business model |
14 |
vk.com/id446425943 |
|
|
|
|
|
|
|
|
|
D Given recent project FIDs, we see oversupply returning to the market in 2024-2026, with new capacity required only from 2027-2028 onwards
•Our updated supply-demand balance reflects two key changes since previous reports:
•Supply from existing and under-construction facilities will peak around 2026 and then remain largely flat
•LNG demand growth will increase significantly at 4.3% p.a. over the next five years driven by Asia and then slow-down gradually driven by new pipeline additions and lower growth in gas demand
•Market tightness could emerge in 2022-2023 with higher than expected growth in LNG demand (e.g. if low LNG spot prices persist) or if there are project delays
Global LNG available supply capacity and demand to 20351,2 |
|
|
|
|
|
|
|
|
|
|
|
|||||||||||
bcm |
|
|
|
|
|
|
|
|
Qatar North Field Expansion |
|
Under construction |
|
|
Existing |
||||||||
|
|
|
|
|
|
|
|
|
|
|||||||||||||
|
|
|
|
|
|
|
|
|
|
|||||||||||||
|
|
|
|
|
|
|
|
|
|
|
LNG demand (reference case) |
|
LNG demand CAGR |
|||||||||
|
|
|
|
|
|
|
|
|
|
|
|
|||||||||||
900 |
|
|
2018–2025 |
|
|
|
|
|
2025–2030 |
|
|
|
2030–2035 |
|
|
|
|
|||||
800 |
|
|
4.3% |
|
|
|
|
|
3.8% |
|
|
|
|
2.6% |
|
|
|
|
||||
700 |
|
|
|
|
|
|
|
|
|
|
|
|
|
|
|
|
|
|
|
|
|
|
600 |
|
|
|
|
|
|
|
|
|
|
|
|
|
|
|
|
|
|
|
|
|
|
500 |
|
|
|
|
|
|
|
|
|
|
|
|
|
|
|
|
|
|
|
|
|
|
400 |
|
|
|
|
|
|
|
|
|
|
|
|
|
|
|
|
|
|
|
|
|
|
300 |
|
|
|
|
|
|
|
|
|
|
|
|
|
|
|
|
|
|
|
|
|
|
200 |
|
|
|
|
|
|
|
|
|
|
|
|
|
|
|
|
|
|
|
|
|
|
100 |
|
|
|
|
|
|
|
|
|
|
|
|
|
|
|
|
|
|
|
|
|
|
0 |
19 |
20 |
21 |
22 |
23 |
24 |
25 |
26 |
27 |
28 |
29 |
30 |
31 |
32 |
33 |
34 |
2035 |
|||||
2018 |
||||||||||||||||||||||
1 Qatar LNG expansion project (formally still pre-FID)
2 Existing supply increases in 2019 as we assume 90% availability from year two onwards of recently-commissioned plant versus 50% in year one Source: Energy Insights by McKinsey, Energy Insights Gas Intelligence Model, IHS Vantage

Executive summary Recap 2018–H1 2019 Gas demand outlook Gas supply outlook |
Infrastructure |
LNG outlook |
Business model |
15 |
vk.com/id446425943 |
|
|
|
|
|
|
|
|
|
D The long-term market clearing price for LNG is expected to be ~$7/MMBtu reflecting full cost of supply from US projects
•Latest project economics indicate a substantial amount of pre-FID projects below $7/MMBtu (DES Asia), in particular from Qatar, Iran, and Russia
•However around 50 bcm of low cost projects face major roadblocks that make FID unlikely
•Accordingly, the large block of US projects is expected to be the marginal supply
LNG cost curve of the future (LCF)1 |
|
|
|
|
|
|
|
DES to Asia, full cycle cost2 |
|
|
|
|
|
|
|
$/MMBtu |
|
|
US |
|
RoW |
|
RoW bottlenecked |
|
|
|
|
||||
|
|
|
|
||||
12 |
LNG supply gap (2035)3 |
||||||
10 |
|
|
|
|
|
|
|
|
|
|
|
|
8 |
|
|
|
|
|
|
|
|
|
|
|
|
|
|
|
|
|
|
|
|
|
|
|
|
7.0 |
6 |
|
|
|
|
|
|
|
|
|
|
|
|
4 |
|
|
|
|
|
|
|
|
|
|
|
|
2 |
|
|
|
|
|
|
|
|
|
|
|
|
0 |
0 |
50 |
100 |
150 |
200 |
250 |
300 |
350 |
400 |
450 |
500 |
550 |
|
|
|
|
|
|
|
|
|
|
|
|
bcm4 |
1 Includes only pre-FID projects selected in the funneling process 2 CAPEX costs included 3 Global LNG demand (ref case +/- 5%), minus available LNG sendout volumes as of 2035 4 Effective sendout capacity (nameplate capacity x 50% in 1st year of operations and 95% thereafter) Source: Energy Insights Gas Intelligence Model, LNG Cost Curve of the Present by Energy Insights

Executive summary Recap 2018–H1 2019 Gas demand outlook Gas supply outlook |
Infrastructure |
LNG outlook |
Business model |
16 |
vk.com/id446425943 |
|
|
|
|
|
|
|
|
|
D By 2035, new LNG demand growth is expected to come primarily from China, ASEAN, and South Asia
• China is expected to experience |
Key changes in LNG imports over 2018-35 |
Top LNG suppliers per country/region1 |
||
the largest growth in LNG |
||||
bcm |
|
2035 |
||
imports between 2018 and 2023 |
|
|||
|
|
|
||
adding 126 bcm |
China |
|
126 |
|
|
|
|||
• South Asia and South East Asia |
ASEAN |
|
76 |
|
will be relevant LNG demand |
|
|||
|
|
|
||
growth centers amid declining |
Pakistan, Bangladesh |
|
63 |
|
local supply and strong demand |
Thailand |
|
45 |
|
profile |
|
|||
|
|
|
||
• Japan will show an almost 32 |
India |
|
43 |
|
|
|
|
||
bcm LNG decline between |
Middle East |
|
16 |
|
2018 and 2035 amid growing |
South Korea, Taiwan |
|
13 |
|
competition from other fuels |
|
|||
|
|
|
||
(mainly the power sector) and |
Europe2 |
|
6 |
|
improving energy efficiency |
Latin America |
|
-10 |
|
|
|
|||
|
Japan |
-32 |
|
|
1 Suppliers which in aggregate supply more than 75% of LNG volumes 2 Including Iberia Source: Energy Insights by McKinsey, Energy Insights Gas Intelligence Model

|
Executive summary Recap 2018–H1 2019 Gas demand outlook Gas supply outlook |
Infrastructure |
LNG outlook |
Business model |
17 |
vk.com/id446425943 |
|
|
|
|
|
|
|
|
|
|
|
E A wide spectrum of LNG business models is emerging with increased competition between producers, portfolio players, traders, and utilities
Return
3 Portfolio optimizers and value chain integrators
Building/optimizing equity LNG portfolio
•Basin swaps to capture arbitrage
•Contract flexibility/optionality e.g., volume
•Originate, optimize, and sell third party gas
volumes
Expand along value chain, for instance:
•Shipping: Maximizing utilization and margin
•Storage: Seasonal physical arbitrage
•Downstream: Regas and LNG for transport, power assets
8 Storage/regas specialists
•Operate/build storage and regas facilities in key strategic hubs
•Benefit from economies of scale and open access model
•Serves players who require supply security or arbitrage in growing gas market
5 Expanding utilities
•Core utility business is static/ shrinking so seeking growth markets and greater supply chain integration
•Looking to secure supply security, flexibility, and better terms from
sellers
1 LNG tollers
Midstream margin capture (“tolling model”)
•Generate margins through liquefaction tolling arrangement (based on feed gas from liquid US gas market)
6 Shipowners
•Specialize in midstream regas and/or floating LNG, offering speed to market and flexible buy-or-lease model
•Selective investments to open new markets for LNG supply/regas (e.g., Golar Power)
•Traditionally independent of LNG supply, but players like Excelerate offer LNG sourcing
7 Independent downstream players
•Contract independent LNG supply through own or third party re-gas facilities serving gas to power, transport, and city-gas markets
•Aim to lock in a structural price advantage vs local LNG incumbents or competing fuel sources
•More nimble than traditional players, supplying smaller projects over shorter lead times
•China, North Asia, India, and Caribbean
2 Upstream monetizers
Upstream margin capture (“volume placing”)
•Line up purchases/sales with low risk
•Add market liquidity by connecting buyers and sellers Optimization of long-term contracts
•Renegotiation/arbitration of terms, prices, indexations
•Reallocation volumes to markets, segments, customers
4 Traders
•Originate, optimize, and sell third-party gas volumes (arbitrage)
•Taking bets on the market using financial derivatives
 Risk
Risk
Source: Expert interviews; team analysis

|
Executive summary Recap 2018–H1 2019 Gas demand outlook Gas supply outlook |
Infrastructure |
LNG outlook |
Business model |
18 |
vk.com/id446425943 |
|
|
|
|
|
|
|
|
|
|
|
Emerging themes and key decisions: LNG marketers and buyers face distinct choices about how to respond
Emerging themes
Gas price
Global LNG price indicators have converged and differentials between US, Europe, and Asia are smallest in more than a decade. Will we see sustained LNG prices below $6/MMBtu in the future?
Market liberalization
Asia now leads the next wave of market liberalization. What learnings from US and Europe can be applied to Asian markets?
Contract pricing outlook
Long-term contract pricing mechanisms are evolving as buyer preferences change and new supplies become available. How will the gas/LNG contract pricing mechanism evolve in different geographies?
CAPEX investment
LNG demand is expected to increase 3.6% p.a. from 2018 to 2035. Which parts of the LNG value chain and which geographies will require the most investment?
Changing business models
Market changes pose significant challenges for traditional LNG business models. What new business models are required to compete in future market conditions?
Distinct choices
|
|
|
Become a low-cost LNG supplier |
|
|
|
• Deliver upstream operations excellence |
|
|
|
• Limit investments in trading, optimization, risk management |
|
|
|
• Be a “price taker” for LNG sales |
LNG |
|
||
|
|
||
|
|
||
marketers |
|
Become a flexible portfolio optimizer |
|
|
|
|
|
|
|
|
• Ensure portfolio scale and diversity |
|
|
|
• Build trading, optimization, and risk capabilities |
|
|
|
|
|
|
|
• Integrate across value chain |
|
|
|
• Offer structured pricing and flexibility to third parties |
|
|
|
|
|
|
|
|
|
|
|
Protect margin |
LNG |
|
• Focus on retaining “sticky” customers |
|
buyers |
|
• Buildcustomerloyaltythroughimprovedexperienceandvalueaddedservices |
|
|
|
|
• Renegotiate legacy contracts to maintain margins |
|
|
||
|
|
|
|
Protect market share
•Compete aggressively with new entrants on price
•Access new markets to offset loss of share in core
•Shift to short-term/spot-priced supply (or lowest source of supply)

vk.com/id446425943
About us
We are a global market intelligence and analytics group focused on the energy sector. We enable organizations to make well-informed strategic, tactical, and operational decisions, using an integrated suite of market models, proprietary industry data, and a global network of industry experts. We work with leading companies across the entire energy value chain to help them manage risk, optimize their organizations, and improve performance.
For more information about our global gas perspectives, please contact: info_energyinsights@mckinsey.com
www.mckinsey.com/gasoutlook
Methodology
The global gas & LNG outlook provides projections of the key trends in the global gas market through 2035. These projections represent a reference case of the future market developed by specialists at Energy Insights with input from the experts and practitioners of McKinsey & Company’s Global Oil & Gas Practice. The projections are not statements of what will happen but are the result of the modeling simulations of the integrated gas market system, based on a set of specific assumptions derived from the current legal, technological, and demographic trends.
© Copyright 2019 McKinsey Solutions Sprl
This document contains proprietary information of McKinsey & Company and is intended for internal use by you and your company. Please do not reproduce, disclose, or distribute the information contained herein without McKinsey & Company’s express prior written consent. Nothing herein is intended to serve as investment advice or a recommendation of any particular transaction or investment, the merits of purchasing or selling securities, or an invitation or inducement to engage in investment activity. While this document is based on sources believed to be reliable, McKinsey & Company does not warrant its completeness or accuracy.