

Knight Frank - the wealth report 2019_watermark
.pdfvk.com/id446425943
Single malt whisky is increasingly seen as an investment of passion by high-net-worth collectors, particularly in Asia. The Wealth Report heads to Scotland to get the lowdown for would-be investors
Words: Andrew Shirley, Editor, The Wealth Report
New traditions above: Made in traditional cooperages near Jerez de la Frontera, The Macallan’s barrels are imbued with the flavours and aromas of sherry opposite: Lindores Abbey – the spiritual home of Scotch whisky – is one of the new generation of craft distillers
Image: Steve McCurry, courtesy The Macallan
Pop stars and actors might have groupies, but whisky experts? Seriously? I wouldn’t have believed it either until I witnessed first-hand the adoration reserved for Charles Maclean, the “godfather” of whisky and author
of numerous books on the subject.
I’m with Mr Maclean and Charlie Beamish, a former investment banker who now runs a private client business that brings together high-end single malt brand owners and wealthy collectors, on a private tour of the Glenfiddich distillery in Speyside when two other visitors run up excitedly. They chat animatedly to Charles for a few minutes before, visibly star-struck, continuing with their tour.
It turns out they are visiting from Asia where Mr Maclean frequently does speaking tours. When I ask if this is a common occurrence he demurs modestly – but I later find out that there is a chain of whisky-themed bars named after him being developed in China.
Perhaps I shouldn’t have been so surprised. After all, the value of the new Knight Frank Rare Whisky 100 Index, compiled for us by consultancy Rare Whisky 101 and featured for the first time in the latest Knight Frank Luxury Investment Index (see page 73 for more details), has risen by almost 600% over the past ten years.
Investments of passion
Some of the world’s wealthiest people, including Amazon’s Jeff Bezos, are reportedly big collectors. But it’s in Asia where the trend seems to be accelerating fastest. Chinese tech entrepreneur Jack Ma’s private jet has been spotted at Aberdeen airport, while whisky tourism was apparently one of the drivers behind the launch of a new non-stop flight from Edinburgh to Beijing in 2018. Sales of Scotch whisky to India, China and Singapore rose by 44%, 35% and 24% respectively in the first half of 2018 according to the Scotch Whisky Association, with single malts totalling almost 30% of total exports.
“It seems single malts have taken over from wine,” confirms Sami Robertson, a Knight Frank
global property ambassador who works closely with clients based in Singapore. “People are spending huge amounts on their cellars. I was talking to one of my contacts recently who paid well over £100,000 for a single bottle.”
But even that sum looks like pocket money compared with the record £1.2 million paid for a unique bottle of The Macallan 1926, hand painted by Irish artist Michael Dillon and sold by Christie’s at its November 2018 whisky sale in London.
The Macallan 1926 enjoys legendary status among collectors. Only 40 bottles of the record-breaking whisky, 60 years old at the time of bottling, were produced, the mostfamousbeingtheeditions
–12 of each – illustrated by artists Peter Blake and Valerio Adami. Sukhinder Singh, who started his career working in his family’s
west London off-licence, probably knows more than anybody about rare whiskies and has amassed one of the world’s largest collections
– 10,000, he tells me – as well as creating The Whisky Exchange, an online trading platform and chain of shops. We meet at his newly opened store on Great Portland Street, surrounded by thousands of different types of whisky from all over the world. It’s not just Scotch that is in demand, he points out: a bottle of 50-year-old Japanese Yamakazi fetched US$343,318 at Bonhams in Hong Kong in August 2018.
Mr Singh has just returned from the Christie’s sale and recounts how he sold a bottle of The Macallan 1926 for “just” £5,000 about 20 years ago. He must wish he’d hung on to it, I sympathise. “I don’t
feel too bad; I’ve still got a few bottles. We’re not in a hurry to sell. It’s important to us that they’re placed in the hands of customers who will appreciate them. It’s amazing how quickly prices and demand have risen over the last few years in particular.”
This explains why distilleries like Glenfiddich and The Macallan are investing heavily to boost production and why a select band of advisers such as Mr Beamish are increasingly criss-crossing the world helping collectors to source hard-to-find whiskies.
For some collectors, however, tracking down individual bottles is not enough. They want their own casks, and are prepared to pay sixor even seven-figure sums to get them. “Putting your own whisky into customised decanters created for you by a premium crystal-maker and giving them to your friends in a stunning presentation box really is the ultimate gift,”
points out Mr Beamish.
But even for those with the deepest pockets that’s easier said than done. Given the rising value of rare whisky, selling older casks is now viewed by most distilleries as a bit like selling the family silver. “If you know the right people it is possible to track down casks, but distilleries are generally very reluctant to sell,” says Mr Beamish. “You can’t just turn up on the doorstepwavingyourchequebook.”
Diageo, which owns 28 single malt whisky distilleries in Scotland, is unusual in that it runs a formal programme called
Casks of Distinction. But this is open only to selected private clients and involves a very limited number of casks, emphasises James Mackay, Head of Rare and Collectable Spirits. “It offers our most passionate customers a very special opportunity to share a stake in some of our most iconic brands such as Brora, a ‘silent distillery’ that shut in 1983, but which we’re reopening next year,” he says.
“We are often approached, but our response is always a polite ‘no’,” Stuart Cassells, Prestige Channel Development Manager at The Macallan, tells me during a visit to the company’s recently opened £140 million distillery and visitor experience.
The Macallan does, however, “sell” a limited number of casks of newly-distilledspiritthroughitsnewEnPrimeurprogramme.Legally,
78 | KNIGHTFRANK.COM |
79 | KNIGHTFRANK.COM |
vk.com/id446425943
RARE WHISKY
Image: Paolo Pellegrin, courtesy The Macallan
Where the magic happens The relatively small size of The Macallan’s stills helps to create a robust, heavy whisky with huge ageing potential
all Scotch whisky must be matured for a minimum of three years, but the En Primeur casks must be matured for a minimum of 12 years.
Costs start at £35,000 for the invitation-only programme, which is available only to selected clients. “The programme was created to encourage enjoyment of The Macallan Single Malt, rather than as an investment or speculation opportunity,” explains Mr Cassells. “At the end of maturation, clients have the rights to the spirit in the cask and will also be offered the opportunity to collaborate with us on a customised design for their unique collection of The Macallan that they can enjoy, share and give away.”
A more cost-effective option for investors or aficionados unable to get their hands on a cask of aged whisky or new spirit from a brand like The Macallan is to head to one of the new generation of craft distilleries opening across Scotland and hope that one day their whisky becomes collectable.
The distillery, for example, set up in 2017 by the McKenzie-Smith family on the site of Lindores Abbey, which some historians believe to be the spiritual home of Scotch whisky, sells a small number of casks of new spirit each year, starting from around £1,100 for a 50-litre firkin to almost £10,000 for a 500-litre butt.
“It helps to maintain cash flow and build brand awareness until we can begin bottling our whisky in a few years’ time,” explains Drew McKenzie-Smith as he proudly shows off his new stills.
“We get a lot of visitors and have sold casks to people from all over the world. Although it’s still early days, we’re confident our whisky is going to taste pretty good.”
There is also a secondary market for casks sold off by distilleries before the value of single malt whisky started to rocket, but buyers should exercise caution, says Andy Simpson of Rare Whisky 101. “We’ve helped people to acquire some amazing casks, but there is no guarantee that just because a barrel is old or from a well-known maker that the whisky will taste amazing or even be drinkable.”
For pure investors it’s the age and rarity of a bottle, rather than the contents, that counts. But most collectors are also passionate about drinking whisky, says Cecily Chappel, Commercial Director of the Last Drop, a company that over the past ten years has been doing the hard work for collectors by scouring distilleries for old casks that are then bottled and sold as limited releases for upwards of £2,400 per bottle. “The youngest whisky we’ve bottled was 45 years, but it’s not just about age – it has to taste delicious,” she enthuses.
But as I’m fast discovering, gaining access to the rarest whiskies is not easy. “Our smallest release was just 32 bottles and was offered to only our most loyal buyers,” confides Mrs Chappel. Clearly, it’s not what you know, it’s who you know that matters in this rarefied world
– which explains why experts like Charles Maclean are so revered by their fans around the world.
COLLECTING
with the ANGELS
Thinking of starting a whisky collection, whether for passion, investment or a bit of both? The Wealth Report brings together some leading industry experts to point you in the right direction
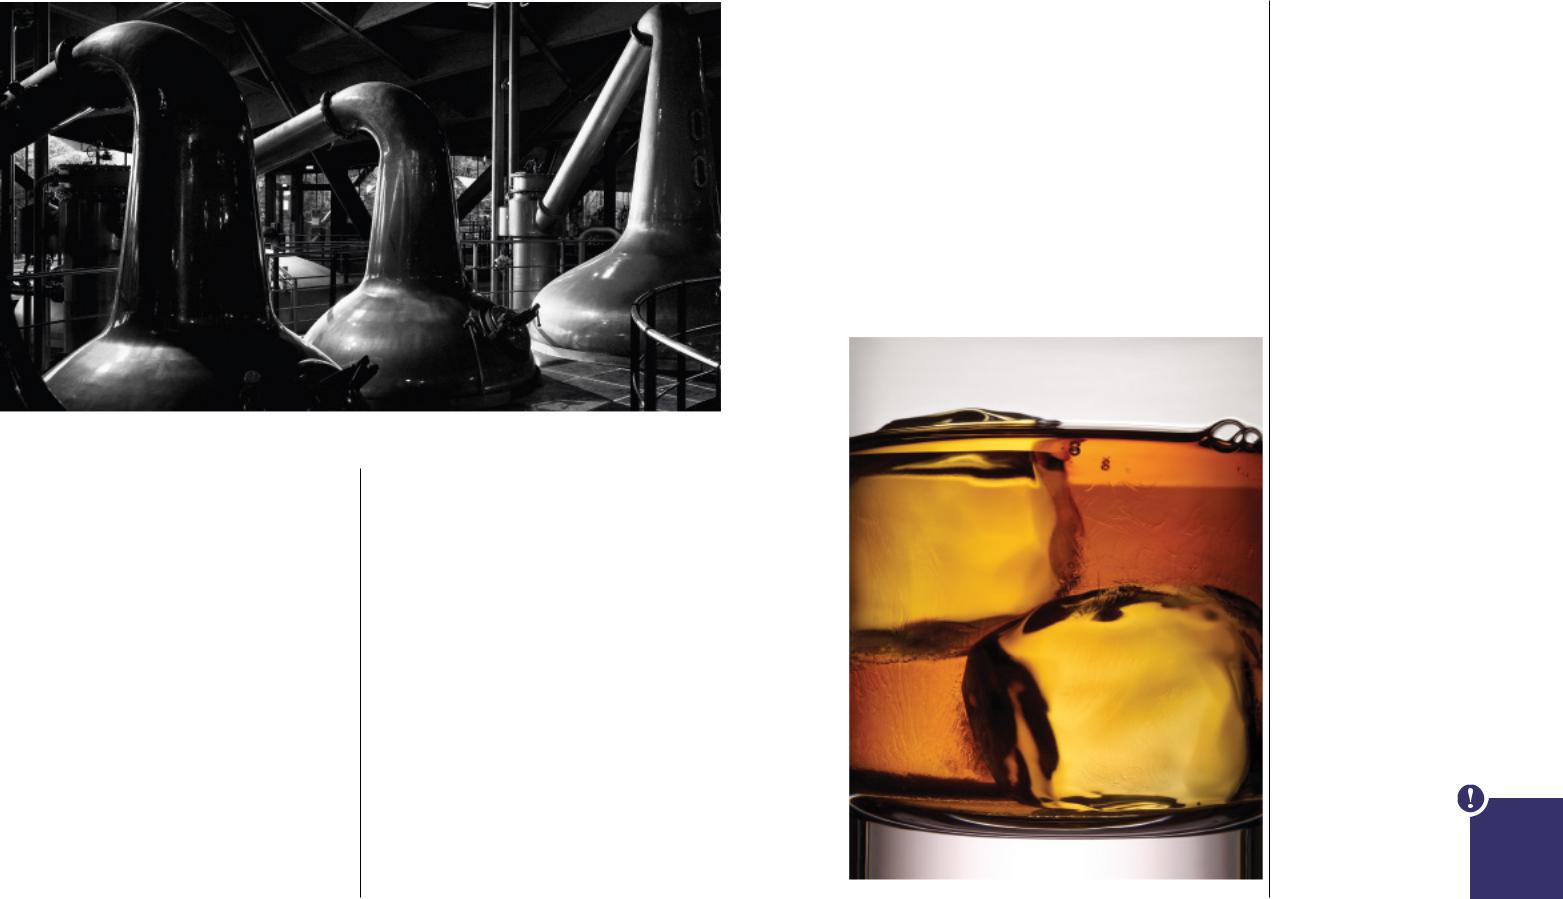
Raise your glass Canny whisky collectors are blending serious investment with pure pleasure
Investments of passion
For some, investing in whisky rather than drinking it might be considered a cardinal sin. But with prices rising rapidly, many collectors are choosing to combine their passion for the
spirit with a spot of speculation.
Charlie Beamish of Beamish International, a private client business focused on alternative investments and specialising in whisky, offers some suggestions on how to hunt out the best prospects.
Genuine enthusiasts are more likely to be offered a rare bottle by a specialist retailer or distiller, he says. “Go to tastings and auctions, attend shows and get to know as many people as possible. If you’re really lucky you might even get the opportunity to purchase a cask.
“These very rarely come up for sale, but when they do, they are highly sought after. Having access to rare casks directly from brand owners with the option of an originalbottlingistheultimateinrarewhiskycollecting.” Therearearound 120maltwhiskydistilleriesoperating in Scotland and 40 or so “ghost” or “silent” distilleries that have shut, but whose aged whisky is still being released as it matures. “The romance and rarity factor makes bottles from these distilleries highly sought
after,” says Mr Beamish.
When it comes to tracking the market, auction data, such as the Knight Frank Rare Whisky 100 index compiled by Rare Whisky 101, is important as it provides a benchmark for future bidding, privately or at auction
– and can also help to identify the next emerging trend. However, data can only tell part of the story, explains Mr Beamish. “The most crucial intelligence we gather is from the private marketplace. For example, knowing how many bottles of a very limited edition whisky have been drunk gives us a good idea of the potential value
of the bottles that remain.”
Finally, it’s time to solve the mystery: what’s the link between angels and whisky? “The alcohol that evaporates while the whisky is in the cask
is called the angel’s share,” says Mr Beamish. “If the alcohol by volume of a cask drops below 40% it can no longer be sold as whisky. So if the angels take too much, it’s pretty serious.”
80 | KNIGHTFRANK.COM |
81 | KNIGHTFRANK.COM |

vk.com/id446425943
RARE WHISKY
Charles Maclean
How to enjoy whisky and know what you’re drinking
Author of 17 books on the topic, Charles Maclean is often referred to as the godfather of Scotch whisky. He took a break from his busy schedule of tasting and touring to share his tips on where to start your whisky journey with The Wealth Report.
There are so many whiskies and styles to choose from. How do you find out what suits your palate?
The best thing to do is find a bar with a good selection of malt whiskies and a knowledgeable bartender and go there when it’s not too busy. Ask the bartender to choose three whiskies of different styles – I’d suggest a sweet Speyside, a smoky Islay and a sherried-style Highland – and see which you like best. Then ask for three different types of your favourite to narrow it down further. Drink and repeat! (To get you started see Sukhinder Singh’s ten picks, opposite.) It’s all about becoming aware that each malt is different.
What’s the best way to taste whisky?
If you’re drinking purely for pleasure, particularly a blended whisky, anything that you enjoy goes – ice, water, even mixers – although I wouldn’t advise
adding a mixer to an expensive single malt. However,
if you really want to appreciate a whisky there are a few things to bear in mind. The first is that flavour is a combination of three things – smell, taste and texture – so using the right sort of glass is important. A tumbler is great for drinking, but no good for tasting. A whisky nosing glass such as a Glencairn glass has a decent bowl that narrows and tapers towards the rim, allowing you to swirl the whisky and catch the vapours. A white wine glass or small brandy snifter will also work. Always take time to smell before you taste and don’t be afraid to add a little water. This will open up the aroma and make it easier to hold the whisky in your mouth so you can appreciate all the different flavours.
What part of the manufacturing process has the biggest impact on taste?
The type of water, barley and still used, plus the intricacies of the distillation process, will all have an impact, but I’d say as much as 85% of a malt whisky’s flavour comes from the time it spends being matured in its cask. The type of oak, European or American, used to make the cask, what was in the barrel before (generally sherry or bourbon – malt whisky is rarely matured in new barrels), whether the cask has already been used to mature whisky (first fill or refill), and how long the whisky has spent in the cask will all have an impact
on taste, texture and colour.
How important is age? Is older always better?
This is a tricky one. Long-aged whiskies are generally more expensive and can taste more interesting and complex, but age is no guarantee of quality. You can produce a very good whisky in 12 years, but I’d say at
18 years you’re getting a good balance between taste and price. If the bottle bears an age statement, it relates to the youngest component. The received wisdom is that whisky stops maturing once it’s bottled but I’d say that once you’re halfway down a bottle you should finish it within four months as it will change when exposed to air.
Does the true connoisseur only drink single malt whisky from Scotland?
Absolutely not. Although malt whisky is universally recognised as being the most complex spirit, I drink blended whisky for pleasure and there are some amazing whiskies being produced all around the world. They may be quite different to Scotch, but they are different by design.
Sukhinder Singh
How to start building a collection
With literally thousands of bottles for the budding whisky enthusiast to choose from, it would be easy to start a collection by going for the famous names.
But to help burnish your credentials as a connoisseur, The Wealth Report asked leading collector, retailer and educator Sukhinder Singh to share his top tips and choose ten lesser known options, all priced at about £50, from the regions of Scotland and the rest of the world.
Sukhinder’s top tips
 Don’t restrict yourself to one whisky. Whisky is all about emotion and feeling, so you’ll need at least five to suit your different moods.
 Bear in mind that whisky is produced in batches, so even the same brand can vary in taste over time. You may find yourself falling in and out of love, even with your favourites.
 Learn to read labels, as they are very often a mine of information. This is particularly the case for those bottles produced by independent bottlers.
 Keep educating yourself. Go to whisky shows and seek out specialist retailers. The best will want you to learn as well as buy.
 Don’t assume that all special editions are actually special. Some are great, but some are just cashing in on the surge in demand.
Investments of passion
SUKHINDER’S STARTERS FOR 10
CAOL ILA 12-YEAR ISLAY SINGLE MALT
This is a good entry level Islay whisky. Not too peaty, but lots of punch and fruity flavours.
TALISKER 10-YEAR SINGLE MALT FROM SKYE
This is a step up from Speyside malts with a smokier, more coastal salty character and notes of seaweed.
THE ARRAN 14-YEAR SINGLE MALT
Lovingly made by a family-owned distillery, it has a distinct coastal flavour, balanced by the sweetness of vanilla and peaches.
THE BALVENIE 14-YEAR CARIBBEAN CASK SINGLE MALT
A Speyside whisky that has been finished in rum casks for around six months to give lovely vanilla and toffee notes.
GLENFARCLAS 15-YEAR HIGHLAND SINGLE MALT
Christmas cake in a glass. Matured in well-chosen sherry casks by a family-owned distillery, this is great value for money.
CLYNELISH 14-YEAR COASTAL HIGHLAND SINGLE MALT
Produced opposite the legendary “silent” Brora distillery in the far north of Scotland, this is a rich, honeyed, waxy dram.
REDBREAST 12-YEAR SINGLE POT STILL IRISH WHISKEY
Made with both malted and unmalted grain this offers something slightly different from a typical single malt and has elements of tropical fruit. I love it.
KAVALAN CLASSIC TAIWANESE SINGLE MALT
Very young but equivalent to a much older Scotch as it matures more quickly in the hotter Asian climate. Light, sweet and oaky; how some Scottish single malts used to taste.
HIBIKI JAPANESE HARMONY BLENDED MALT AND GRAIN WHISKY
This is a lovely, easy drinking Japanese whisky with soft notes of orange peel and white chocolate.
MICHTERS SOUR MASH AMERICAN WHISKEY
The epitome of American whiskey with cinnamon, butter and nutty notes. This is our 2019 whisky of the year.
82 | KNIGHTFRANK.COM |
83 | KNIGHTFRANK.COM |

vk.com/id446425943
LUXURY ASSET MANAGEMENT
Keeping a cool head
Five top tips for getting the most out of investments of the heart
Words: Nic Arnold, Private Client Director and Head of Luxury Asset Advisory, PwC
 01 02 03
04  05
05
Read the full list of ten tips at knightfrank.com/wealthreport
The decision to buy a yacht or invest in art is often driven by the heart, rather than the head. And it is fair to say that the heart is unlikely to be thinking of tax reporting or penalties for inadvertently failing to understand tax rules when experiencing the joy of a favourite painting or using a private jet. But investors
would do well to put the same level of tax consideration into the purchase of a luxury asset as they do into investing in a business or investment portfolio. Below are five issues for investors to consider.*
Corporate jets
Since UK income tax changes in April 2017 the private use of corporate jets has become increasingly complex, with individuals finding themselves subject to high “benefit in kind” income tax charges – even, in some circumstances, where they have paid for use of the aircraft. As a result, individuals owning their own jets need to review how they own and use their aircraft, and company directors using corporate jets should ensure that company policies are updated to ensure compliance and prevent unexpected tax bills.
Enjoying art worldwide
While many yacht owners wish to enjoy valuable artwork by bringing it on board, this has hidden risks when sailing to multiple destinations. It is important to know the tax status of both the yacht and the art – and how this will be treated by different tax authorities.
The business of art
Most art collections evolve over time and, despite the large values often involved, planning and governance around a collection can be minimal, leading to unexpected tax charges or missed tax reliefs. In some cases, the level of turnover in an art collection may mean it is considered for tax purposes as an art trade. This has different VAT implications and may mean that VAT can be reclaimed and tax deductions obtained, but along with this will come other potential tax implications together with increased reporting and compliance requirements.
Moving to the UK
Those moving to the UK to live there temporarily may qualify for the so-called “nondom” tax regime. Designed to recognise the international lives of individuals visiting and investing, the tax regime seeks only to tax non-UK wealth to the extent that it is brought to the UK (taking into account certain exemptions). However, non-dom clients should always take tax advice before bringing assets such as cars, yachts, aircraft, art and antiques into the UK as tax may be payable on these assets.
Visiting the EU
Those living outside the EU may not be required to pay tax when sailing yachts and flying aircraft into the region. “Temporary admission” relief enables owners resident in non-EU countries to “just visit” the EU without being charged VAT on the import of their asset. However, strict conditions apply, and there are many nuances within the rules, so care must be taken.
*Individual advice should always be sought
Databank
The numbers behind
The Wealth Report
Global wealth distribution
High-net-worth populations at regional, country/territory and city level
The Attitudes Survey
The hopes, fears, aspirations and investment plans of UHNWIs around the world
84 | KNIGHTFRANK.COM

vk.com/id446425943 |
|
|
|
|
|
|
|
|
|
|
|
|
|
|
|
|
|
|
|
|
|
|
|
|
|
|
||
WHERE THE WEALTHY LIVE |
|
|
|
|
|
|
|
|
|
|
|
|
|
|
|
|
|
|
|
|
|
|
|
|
Databank |
|
||
Global, regional and country/territory wealth distribution |
|
|
|
|
|
|
|
|
|
|
|
|
|
|
|
|
City-level wealth distribution |
|
|
|
||||||||
|
|
MILLIONAIRES |
|
|
%CHANGE |
|
|
UHNWIS(US$30M+) |
|
|
%CHANGE |
|
|
|
BILLIONAIRES |
|
|
%CHANGE |
|
|
|
UHNWIS |
|
%CHANGE |
|
|||
|
|
|
|
|
|
|
|
|
|
|
|
|
|
|
|
|
|
|||||||||||
|
|
|
|
|
|
|
|
|
|
|
|
|
|
|
|
|
|
|
|
|
|
|
|
|
|
|
|
|
TERRITORY |
2013 |
2017 |
2018 |
2023 |
2013–2018 |
2017–2018 |
2018–2023 |
2013 |
2017 |
2018 |
2023 |
2013–2018 |
2017–2018 |
2018–2023 |
|
2013 |
2017 |
2018 |
2023 |
2013–2018 |
2017–2018 |
2018–2023 |
COUNTRY |
CITY |
2018 |
2023 |
2018–2023 |
|
WORLD |
17,330,650 |
18,985,606 |
19,603,681 |
23,404,810 |
13% |
3% |
19% |
167,669 |
191,251 |
198,342 |
241,053 |
18% |
4% |
22% |
|
1,440 |
2,057 |
2,229 |
2,696 |
55% |
8% |
21% |
ARGENTINA |
BUENOS AIRES |
281 |
334 |
19% |
|
|
|
|
|
|
|
|
|
|
|
|
|
|
|
|
|
|
|
|
|
|
|
|
AUSTRALIA |
MELBOURNE |
519 |
626 |
21% |
|
AFRICA |
164,000 |
172,694 |
177,265 |
208,713 |
8% |
3% |
18% |
1,868 |
1,991 |
2,050 |
2,450 |
10% |
3% |
20% |
|
20 |
28 |
23 |
29 |
15% |
-18% |
26% |
AUSTRALIA |
PERTH |
318 |
385 |
21% |
|
ASIA |
4,933,277 |
5,475,383 |
5,645,171 |
6,806,689 |
14% |
3% |
21% |
40,853 |
46,661 |
48,245 |
59,116 |
18% |
3% |
23% |
|
363 |
694 |
787 |
1,003 |
117% |
13% |
27% |
AUSTRALIA |
SYDNEY |
875 |
1,054 |
20% |
|
AUSTRALASIA |
350,500 |
376,230 |
389,529 |
463,076 |
11% |
4% |
19% |
3,828 |
4,230 |
4,400 |
5,360 |
15% |
4% |
22% |
|
25 |
35 |
45 |
52 |
80% |
29% |
16% |
AUSTRIA |
VIENNA |
440 |
539 |
23% |
|
EUROPE |
5,027,747 |
5,524,792 |
5,716,306 |
6,980,398 |
14% |
3% |
22% |
58,731 |
67,867 |
70,627 |
87,400 |
20% |
4% |
24% |
|
255 |
427 |
452 |
533 |
77% |
6% |
18% |
BAHRAIN |
MANAMA |
101 |
116 |
15% |
|
LATIN AMERICA |
580,700 |
590,306 |
610,123 |
727,683 |
5% |
3% |
19% |
9,677 |
10,077 |
10,457 |
12,676 |
8% |
4% |
21% |
|
98 |
87 |
89 |
108 |
-9% |
2% |
21% |
BRAZIL |
SÃO PAULO |
1,352 |
1,426 |
5% |
|
MIDDLE EAST |
426,100 |
446,384 |
459,937 |
541,311 |
8% |
3% |
18% |
7,052 |
8,019 |
8,301 |
9,997 |
18% |
4% |
20% |
|
83 |
75 |
89 |
99 |
7% |
19% |
11% |
CANADA |
MONTREAL |
582 |
689 |
18% |
|
NORTH AMERICA |
5,653,100 |
6,208,369 |
6,403,326 |
7,430,812 |
13% |
3% |
16% |
43,626 |
50,184 |
51,912 |
61,119 |
19% |
3% |
18% |
|
471 |
604 |
631 |
736 |
34% |
4% |
17% |
CANADA |
TORONTO |
1,328 |
1,570 |
18% |
|
RUSSIA & CIS |
195,226 |
191,448 |
202,024 |
246,128 |
3% |
6% |
22% |
2,034 |
2,222 |
2,350 |
2,935 |
16% |
6% |
25% |
|
125 |
107 |
113 |
136 |
-10% |
6% |
20% |
CANADA |
VANCOUVER |
293 |
347 |
18% |
|
|
|
|
|
|
|
|
|
|
|
|
|
|
|
|
|
|
|
|
|
|
|
|
CHINA |
BEIJING |
1,673 |
2,247 |
34% |
|
ARGENTINA |
35,000 |
31,868 |
32,547 |
37,903 |
-7% |
2% |
16% |
483 |
434 |
444 |
525 |
-8% |
2% |
18% |
|
5 |
7 |
9 |
9 |
80% |
29% |
0% |
CHINA |
GUANGZHOU |
394 |
529 |
34% |
|
AUSTRALIA |
302,000 |
318,737 |
329,643 |
389,303 |
9% |
3% |
18% |
2,740 |
2,951 |
3,062 |
3,675 |
12% |
4% |
20% |
|
22 |
33 |
43 |
49 |
95% |
30% |
14% |
CHINA |
SHANGHAI |
1,263 |
1,690 |
34% |
|
AUSTRIA |
108,900 |
120,443 |
125,043 |
153,181 |
15% |
4% |
23% |
1,429 |
1,653 |
1,722 |
2,150 |
21% |
4% |
25% |
|
8 |
8 |
8 |
8 |
0% |
0% |
0% |
CHINA |
SHENZHEN |
527 |
708 |
34% |
|
BRAZIL |
194,300 |
180,531 |
179,628 |
188,674 |
-8% |
-1% |
5% |
4,122 |
3,775 |
3,754 |
3,962 |
-9% |
-1% |
6% |
|
46 |
31 |
31 |
37 |
-33% |
0% |
19% |
EGYPT |
CAIRO |
160 |
195 |
22% |
|
CANADA |
422,000 |
447,046 |
459,319 |
528,249 |
9% |
3% |
15% |
4,248 |
4,645 |
4,785 |
5,580 |
13% |
3% |
17% |
|
29 |
39 |
46 |
56 |
59% |
18% |
22% |
FRANCE |
PARIS |
1,667 |
2,031 |
22% |
|
CHINESE MAINLAND |
1,279,800 |
1,469,846 |
1,535,473 |
2,017,514 |
20% |
4% |
31% |
7,905 |
9,487 |
9,953 |
13,429 |
26% |
5% |
35% |
|
122 |
319 |
373 |
481 |
206% |
17% |
29% |
GERMANY |
BERLIN |
531 |
658 |
24% |
|
FRANCE |
555,000 |
587,977 |
610,831 |
745,324 |
10% |
4% |
22% |
3,800 |
4,320 |
4,505 |
5,605 |
19% |
4% |
24% |
|
24 |
38 |
40 |
49 |
67% |
5% |
23% |
GERMANY |
HAMBURG |
963 |
1,180 |
23% |
|
GERMANY |
1,326,200 |
1,466,121 |
1,530,348 |
1,904,069 |
15% |
4% |
24% |
11,392 |
13,401 |
14,047 |
17,854 |
23% |
5% |
27% |
|
58 |
114 |
123 |
148 |
112% |
8% |
20% |
GERMANY |
MUNICH |
1,290 |
1,607 |
25% |
|
GREECE |
66,100 |
65,757 |
65,821 |
69,869 |
0% |
0% |
6% |
721 |
703 |
704 |
751 |
-2% |
0% |
7% |
|
3 |
3 |
4 |
4 |
33% |
33% |
0% |
GREECE |
ATHENS |
292 |
313 |
7% |
|
HONG KONG |
189,234 |
213,504 |
223,223 |
280,374 |
18% |
5% |
26% |
2,469 |
2,880 |
3,010 |
3,821 |
22% |
5% |
27% |
|
40 |
72 |
64 |
77 |
60% |
-11% |
20% |
INDIA |
DELHI |
211 |
291 |
38% |
|
INDIA |
251,000 |
307,700 |
326,052 |
438,779 |
30% |
6% |
35% |
1,576 |
1,827 |
1,947 |
2,697 |
24% |
7% |
39% |
|
55 |
101 |
119 |
163 |
116% |
18% |
37% |
INDIA |
MUMBAI |
797 |
1,101 |
38% |
|
INDONESIA |
37,000 |
41,205 |
43,118 |
55,353 |
17% |
5% |
28% |
626 |
719 |
756 |
995 |
21% |
5% |
32% |
|
25 |
20 |
20 |
25 |
-20% |
0% |
25% |
INDONESIA |
JAKARTA |
401 |
529 |
32% |
|
IRELAND |
59,100 |
75,042 |
77,984 |
95,817 |
32% |
4% |
23% |
811 |
986 |
1,029 |
1,289 |
27% |
4% |
25% |
|
5 |
8 |
9 |
9 |
80% |
13% |
0% |
IRELAND |
DUBLIN |
444 |
549 |
24% |
|
ITALY |
259,000 |
273,020 |
282,580 |
337,863 |
9% |
4% |
20% |
3,650 |
3,932 |
4,083 |
4,968 |
12% |
4% |
22% |
|
23 |
42 |
43 |
53 |
87% |
2% |
23% |
ISRAEL |
TEL AVIV |
585 |
682 |
17% |
|
JAPAN |
2,150,000 |
2,292,204 |
2,326,522 |
2,558,032 |
8% |
1% |
10% |
16,450 |
18,234 |
18,534 |
20,570 |
13% |
2% |
11% |
|
22 |
33 |
35 |
40 |
59% |
6% |
14% |
ITALY |
MILAN |
253 |
302 |
19% |
|
KENYA |
8,400 |
9,176 |
9,482 |
11,584 |
13% |
3% |
22% |
110 |
121 |
125 |
155 |
14% |
3% |
24% |
|
0 |
0 |
0 |
0 |
N/A |
N/A |
N/A |
ITALY |
ROME |
1,015 |
1,198 |
18% |
|
MALAYSIA |
26,000 |
28,210 |
29,272 |
37,315 |
13% |
4% |
27% |
557 |
611 |
636 |
830 |
14% |
4% |
31% |
|
10 |
12 |
14 |
19 |
40% |
17% |
36% |
JAPAN |
TOKYO |
3,732 |
4,125 |
11% |
|
MEXICO |
145,000 |
154,409 |
158,901 |
192,393 |
10% |
3% |
21% |
2,540 |
2,692 |
2,778 |
3,427 |
9% |
3% |
23% |
|
15 |
15 |
16 |
20 |
7% |
7% |
25% |
KENYA |
NAIROBI |
82 |
102 |
24% |
|
MONACO |
10,975 |
12,069 |
12,261 |
13,494 |
12% |
2% |
10% |
200 |
219 |
223 |
247 |
12% |
2% |
11% |
|
14 |
12 |
12 |
14 |
-14% |
0% |
16% |
MALAYSIA |
KUALA LUMPUR |
376 |
496 |
32% |
|
NEW ZEALAND |
45,000 |
53,539 |
55,792 |
68,907 |
24% |
4% |
24% |
1,050 |
1,235 |
1,292 |
1,629 |
23% |
5% |
26% |
|
3 |
2 |
2 |
3 |
-33% |
0% |
50% |
MEXICO |
MEXICO CITY |
1,256 |
1,519 |
21% |
|
PHILIPPINES |
21,000 |
23,059 |
24,162 |
32,363 |
15% |
5% |
34% |
171 |
204 |
215 |
296 |
26% |
5% |
38% |
|
11 |
14 |
12 |
17 |
9% |
-14% |
42% |
NEW ZEALAND |
AUCKLAND |
669 |
839 |
25% |
|
POLAND |
28,400 |
31,848 |
33,205 |
41,760 |
17% |
4% |
26% |
487 |
563 |
589 |
757 |
21% |
5% |
29% |
|
4 |
4 |
6 |
6 |
50% |
50% |
0% |
PHILIPPINES |
MANILA |
115 |
157 |
37% |
|
ROMANIA |
19,800 |
22,639 |
23,713 |
29,935 |
20% |
5% |
26% |
172 |
204 |
215 |
278 |
25% |
5% |
29% |
|
1 |
1 |
1 |
1 |
0% |
0% |
0% |
RUSSIA |
MOSCOW |
1,021 |
1,242 |
22% |
|
RUSSIA |
159,600 |
153,959 |
163,176 |
198,524 |
2% |
6% |
22% |
1,292 |
1,407 |
1,500 |
1,861 |
16% |
7% |
24% |
|
110 |
96 |
101 |
124 |
-8% |
5% |
23% |
SAUDI ARABIA |
RIYADH |
622 |
709 |
14% |
|
SAUDI ARABIA |
48,000 |
50,348 |
51,360 |
58,510 |
7% |
2% |
14% |
851 |
929 |
950 |
1,097 |
12% |
2% |
15% |
|
8 |
10 |
10 |
10 |
25% |
0% |
0% |
SINGAPORE |
SINGAPORE |
3,598 |
4,393 |
22% |
|
SINGAPORE |
149,446 |
164,230 |
171,559 |
206,782 |
15% |
4% |
21% |
3,124 |
3,458 |
3,598 |
4,393 |
15% |
4% |
22% |
|
15 |
28 |
33 |
39 |
120% |
18% |
18% |
SOUTH AFRICA |
CAPE TOWN |
131 |
151 |
15% |
|
SOUTH AFRICA |
48,800 |
51,110 |
52,926 |
61,474 |
8% |
4% |
16% |
594 |
636 |
661 |
780 |
11% |
4% |
18% |
|
6 |
8 |
7 |
8 |
17% |
-13% |
14% |
SOUTH AFRICA |
JOHANNESBURG |
339 |
391 |
15% |
|
SOUTH KOREA |
157,000 |
177,254 |
185,257 |
234,825 |
18% |
5% |
27% |
1,565 |
1,803 |
1,893 |
2,456 |
21% |
5% |
30% |
|
24 |
38 |
44 |
56 |
83% |
16% |
27% |
SOUTH KOREA |
SEOUL |
1,594 |
2,020 |
27% |
|
SPAIN |
225,000 |
250,691 |
261,435 |
323,920 |
16% |
4% |
24% |
3,475 |
3,926 |
4,111 |
5,202 |
18% |
5% |
27% |
|
20 |
25 |
29 |
34 |
45% |
16% |
17% |
SPAIN |
MADRID |
613 |
764 |
25% |
|
SWEDEN |
170,900 |
193,094 |
200,530 |
245,127 |
17% |
4% |
22% |
3,147 |
3,669 |
3,824 |
4,767 |
22% |
4% |
25% |
|
14 |
31 |
32 |
37 |
129% |
3% |
16% |
SWEDEN |
STOCKHOLM |
559 |
689 |
23% |
|
SWITZERLAND |
297,000 |
322,245 |
331,686 |
392,959 |
12% |
3% |
18% |
4,137 |
4,619 |
4,768 |
5,743 |
15% |
3% |
20% |
|
13 |
36 |
36 |
41 |
177% |
0% |
14% |
SWITZERLAND |
GENEVA |
1,344 |
1,599 |
19% |
|
TAIWAN |
118,000 |
130,868 |
135,689 |
166,771 |
15% |
4% |
23% |
1,503 |
1,712 |
1,781 |
2,233 |
18% |
4% |
25% |
|
26 |
31 |
35 |
44 |
35% |
13% |
26% |
SWITZERLAND |
ZURICH |
1,507 |
1,796 |
19% |
|
TANZANIA |
5,700 |
6,216 |
6,429 |
7,616 |
13% |
3% |
18% |
75 |
85 |
88 |
107 |
17% |
4% |
22% |
|
0 |
1 |
1 |
2 |
N/A |
0% |
100% |
TAIWAN |
TAIPEI |
1,519 |
1,864 |
23% |
|
THAILAND |
56,000 |
61,247 |
64,131 |
80,875 |
15% |
5% |
26% |
527 |
600 |
631 |
814 |
20% |
5% |
29% |
|
10 |
20 |
30 |
34 |
200% |
50% |
13% |
TURKEY |
ISTANBUL |
991 |
1,011 |
2% |
|
TURKEY |
94,100 |
85,225 |
83,947 |
86,467 |
-11% |
-1% |
3% |
1,923 |
1,723 |
1,695 |
1,752 |
-12% |
-2% |
3% |
|
43 |
29 |
29 |
29 |
-33% |
0% |
0% |
UAE |
ABU DHABI |
192 |
223 |
16% |
|
UAE |
48,300 |
52,344 |
53,798 |
61,292 |
11% |
3% |
14% |
625 |
672 |
693 |
799 |
11% |
3% |
15% |
|
4 |
5 |
7 |
7 |
75% |
40% |
0% |
UAE |
DUBAI |
440 |
511 |
16% |
|
UGANDA |
1,500 |
1,606 |
1,639 |
1,904 |
9% |
2% |
16% |
20 |
22 |
22 |
27 |
10% |
0% |
23% |
|
0 |
0 |
0 |
0 |
N/A |
N/A |
N/A |
UK |
EDINBURGH |
125 |
150 |
20% |
|
UK |
675,100 |
735,420 |
759,354 |
905,227 |
12% |
3% |
19% |
10,149 |
12,125 |
12,559 |
15,233 |
24% |
4% |
21% |
|
37 |
54 |
54 |
67 |
46% |
0% |
24% |
UK |
LONDON |
4,944 |
6,015 |
22% |
|
US |
5,231,100 |
5,761,323 |
5,944,007 |
6,902,563 |
14% |
3% |
16% |
39,378 |
45,539 |
47,127 |
55,539 |
20% |
3% |
18% |
|
442 |
565 |
585 |
680 |
32% |
4% |
16% |
US |
LOS ANGELES |
1,075 |
1,239 |
15% |
|
VIETNAM |
10,000 |
11,786 |
12,327 |
15,776 |
23% |
5% |
28% |
110 |
135 |
142 |
186 |
29% |
5% |
31% |
|
1 |
2 |
4 |
4 |
300% |
100% |
0% |
US |
MIAMI |
253 |
296 |
17% |
|
ZAMBIA |
900 |
938 |
974 |
1,106 |
8% |
4% |
14% |
15 |
16 |
17 |
17 |
13% |
6% |
0% |
|
0 |
0 |
0 |
0 |
N/A |
N/A |
N/A |
US |
NEW YORK |
3,378 |
3,891 |
15% |
|
Data for further countries, cities and years available. Please contact siobhan.leahy@knightfrank.com |
|
|
|
|
|
|
|
|
|
|
|
|
|
|
|
|
|
Source: GlobalData WealthInsight |
|
|
|
|
||||||
|
|
|
|
|
|
|
|
|
|
|
|
|
|
|
|
|
|
|
|
|
|
|
For more information please |
|
|
|
|
|
contact info@wealthinsight.com
86 | KNIGHTFRANK.COM |
87 | KNIGHTFRANK.COM |

vk.com/id446425943
INVESTING, SPENDING AND GIVING TRENDS
The Attitudes Survey 2019
Wealth creation
ON BALANCE, HOW DID THE WEALTH OF YOUR CLIENTS CHANGE IN 2018?
% WHO CHOSE EACH OPTION |
AFRICA |
ASIA |
AUSTRALASIA |
EUROPE |
LATINAMERICA |
MIDDLEEAST |
NORTHAMERICA |
RUSSIA&CIS |
GLOBAL |
|
AVERAGE |
||||||||||
|
|
|
|
|
|
|
|
|
||
|
|
|
|
|
|
|
|
|
|
|
INCREASED |
54% |
58% |
93% |
76% |
45% |
47% |
92% |
40% |
63% |
|
NO CHANGE |
12% |
18% |
6% |
20% |
27% |
33% |
8% |
40% |
21% |
|
DECREASED |
34% |
23% |
1% |
3% |
27% |
20% |
0% |
20% |
16% |
|
ON BALANCE, HOW DO YOU THINK YOUR CLIENTS’ WEALTH IS LIKELY TO CHANGE IN 2019? |
|
|
|
|
|
|
||||
|
|
|
|
|
|
|
|
|
|
|
% WHO CHOSE EACH OPTION |
AFRICA |
ASIA |
AUSTRALASIA |
EUROPE |
LATINAMERICA |
MIDDLEEAST |
NORTHAMERICA |
RUSSIA&CIS |
GLOBAL |
|
AVERAGE |
||||||||||
|
|
|
|
|
|
|
|
|
||
|
|
|
|
|
|
|
|
|
|
|
INCREASE |
68% |
64% |
72% |
64% |
45% |
50% |
81% |
65% |
64% |
|
NO CHANGE |
15% |
18% |
24% |
25% |
55% |
33% |
5% |
20% |
25% |
|
DECREASE |
17% |
18% |
4% |
11% |
0% |
17% |
14% |
15% |
12% |
|
DID THE POLITICAL AND ECONOMIC ENVIRONMENT WITHIN THEIR COUNTRY OF RESIDENCE AND GLOBALLY MAKE IT MORE DIFFICULT FOR YOUR CLIENTS TO CREATE AND PROTECT WEALTH IN 2018 COMPARED WITH 2017? |
||||||||||
|
|
|
|
|
|
|
|
|
|
|
% OF RESPONDENTS |
AFRICA |
ASIA |
AUSTRALASIA |
EUROPE |
LATINAMERICA |
MIDDLEEAST |
NORTHAMERICA |
RUSSIA&CIS |
GLOBAL |
|
WHO SAID YES |
AVERAGE |
|||||||||
|
|
|
|
|
|
|
|
|||
|
|
|
|
|
|
|
|
|
|
|
WITHIN THEIR COUNTRY |
92% |
71% |
63% |
64% |
64% |
66% |
62% |
80% |
70% |
|
OF RESIDENCE |
||||||||||
GLOBALLY |
66% |
69% |
51% |
48% |
45% |
59% |
59% |
70% |
58% |
|
DO YOU THINK THE POLITICAL AND ECONOMIC ENVIRONMENT WITHIN THEIR COUNTRY OF RESIDENCE AND GLOBALLY WILL MAKE IT MORE DIFFICULT FOR YOUR CLIENTS TO CREATE AND PROTECT WEALTH IN 2019?
% OF RESPONDENTS AFRICA ASIA AUSTRALASIA EUROPE LATINAMERICA MIDDLEEAST NORTHAMERICA RUSSIA&CIS
WHO SAID YES
WITHIN THEIR COUNTRY |
66% |
65% |
76% |
65% |
64% |
72% |
59% |
80% |
68% |
OF RESIDENCE |
|||||||||
GLOBALLY |
58% |
69% |
70% |
56% |
55% |
59% |
62% |
65% |
62% |
Investment trends
ON BALANCE, HOW HAS YOUR CLIENTS’ ATTITUDE TO INVESTMENT RISK CHANGED OVER THE PAST 12 MONTHS?
|
AFRICA |
ASIA |
AUSTRALASIA |
EUROPE |
LATINAMERICA |
MIDDLEEAST |
NORTHAMERICA |
RUSSIA&CIS |
GLOBAL |
|
AVERAGE |
||||||||
|
|
|
|
|
|
|
|
|
|
|
|
|
|
|
|
|
|
|
|
BECOME LESS RISK AVERSE |
22% |
42% |
30% |
23% |
40% |
29% |
26% |
21% |
29% |
NO CHANGE |
20% |
19% |
36% |
38% |
20% |
32% |
32% |
37% |
29% |
BECOME MORE RISK AVERSE |
57% |
39% |
34% |
38% |
40% |
39% |
41% |
42% |
42% |
|
|
|
|
|
|||||
HOW PREPARED ARE GOVERNMENTS AND CENTRAL BANKS AROUND THE WORLD FOR A FINANCIAL CRISIS COMPARED WITH 10 YEARS AGO? |
|
|
|
|
|||||
|
|
|
|
|
|
|
|
|
|
|
AFRICA |
ASIA |
AUSTRALASIA |
EUROPE |
LATINAMERICA |
MIDDLEEAST |
NORTHAMERICA |
RUSSIA&CIS |
GLOBAL |
|
AVERAGE |
||||||||
|
|
|
|
|
|
|
|
|
|
|
|
|
|
|
|
|
|
|
|
MORE PREPARED |
67% |
70% |
81% |
67% |
60% |
78% |
68% |
63% |
69% |
NO CHANGE |
7% |
15% |
6% |
21% |
30% |
11% |
26% |
32% |
19% |
LESS PREPARED |
26% |
15% |
13% |
12% |
10% |
11% |
6% |
5% |
12% |
|
|
|
|
|
|||||
ON AVERAGE, WHAT % OF YOUR CLIENTS’ INVESTMENT PORTFOLIOS IS ALLOCATED TO THE FOLLOWING ASSET CLASSES? |
|
|
|
|
|||||
|
|
|
|
|
|
|
|
|
|
|
AFRICA |
ASIA |
AUSTRALASIA |
EUROPE |
LATINAMERICA |
MIDDLEEAST |
NORTHAMERICA |
RUSSIA&CIS |
GLOBAL |
|
AVERAGE |
||||||||
|
|
|
|
|
|
|
|
|
|
|
|
|
|
|
|
|
|
|
|
EQUITIES |
30% |
25% |
35% |
28% |
12% |
25% |
40% |
16% |
27% |
PROPERTY |
22% |
23% |
22% |
27% |
17% |
22% |
17% |
20% |
21% |
(OWNED AS AN INVESTMENT) |
|||||||||
BONDS |
14% |
24% |
19% |
14% |
22% |
19% |
18% |
27% |
20% |
CASH |
24% |
18% |
16% |
12% |
16% |
14% |
9% |
26% |
17% |
PRIVATE EQUITY |
4% |
4% |
4% |
10% |
9% |
10% |
12% |
7% |
7% |
LUXURY INVESTMENTS |
3% |
2% |
2% |
5% |
11% |
3% |
1% |
3% |
4% |
(ART, WINE, CARS, ETC) |
|||||||||
GOLD |
1% |
3% |
1% |
2% |
8% |
1% |
1% |
1% |
2% |
OTHER |
2% |
1% |
1% |
2% |
6% |
3% |
0% |
1% |
2% |
The Attitudes Survey is based on responses from 600 private bankers and wealth advisers managing over US$3 trillion of wealth for UHNWI clients. The survey was taken during October and November 2018
Databank
ON BALANCE, HOW DID YOUR CLIENTS’ ALLOCATION TO THE FOLLOWING ASSET CLASSES CHANGE IN 2018?*
|
|
AFRICA |
ASIA |
AUSTRALASIA |
EUROPE |
LATINAMERICA |
MIDDLEEAST |
NORTHAMERICA |
RUSSIA&CIS |
GLOBAL |
|
|
AVERAGE |
||||||||
|
|
|
|
|
|
|
|
|
|
|
|
|
|
|
|
|
|
|
|
|
|
CASH |
52% |
56% |
59% |
39% |
50% |
50% |
44% |
12% |
45% |
|
PROPERTY |
4% |
14% |
0% |
19% |
50% |
21% |
31% |
29% |
21% |
|
(OWNED AS AN INVESTMENT) |
||||||||||
PRIVATE EQUITY |
-7% |
4% |
30% |
21% |
-13% |
29% |
31% |
12% |
14% |
|
LUXURY INVESTMENTS |
-9% |
1% |
0% |
17% |
13% |
4% |
6% |
6% |
5% |
|
(ART, WINE, CARS, ETC) |
|
|
|
|
|
|
|
|
|
|
GOLD |
-11% |
12% |
3% |
-1% |
0% |
13% |
3% |
6% |
3% |
|
BONDS |
28% |
-8% |
-11% |
-23% |
-25% |
-16% |
-19% |
41% |
-4% |
|
EQUITIES |
-35% |
-25% |
8% |
5% |
-13% |
4% |
-9% |
6% |
-7% |
|
*= Difference between those reporting an increase and those reporting a decrease |
|
|
|
|
|
|
|
|||
|
|
|
|
|
|
|||||
HOW DO YOU EXPECT YOUR CLIENTS’ ALLOCATION TO THE FOLLOWING ASSET CLASSES TO CHANGE IN 2019?* |
|
|
|
|
|
|||||
|
|
|
|
|
|
|
|
|
|
|
|
|
AFRICA |
ASIA |
AUSTRALASIA |
EUROPE |
LATINAMERICA |
MIDDLEEAST |
NORTHAMERICA |
RUSSIA&CIS |
GLOBAL |
|
|
AVERAGE |
||||||||
|
|
|
|
|
|
|
|
|
|
|
|
|
|
|
|
|
|
|
|
|
|
CASH |
28% |
36% |
37% |
25% |
38% |
13% |
41% |
0% |
27% |
|
PROPERTY |
35% |
8% |
-14% |
13% |
38% |
38% |
25% |
24% |
21% |
|
(OWNED AS AN INVESTMENT) |
||||||||||
PRIVATE EQUITY |
22% |
14% |
30% |
28% |
13% |
24% |
22% |
6% |
20% |
|
BONDS |
41% |
16% |
35% |
-8% |
-38% |
21% |
28% |
41% |
17% |
|
GOLD |
7% |
20% |
19% |
13% |
25% |
8% |
13% |
12% |
15% |
|
LUXURY INVESTMENTS |
2% |
5% |
-3% |
21% |
13% |
0% |
6% |
-12% |
4% |
|
(ART, WINE, CARS, ETC) |
|
|
|
|
|
|
|
|
|
|
EQUITIES |
22% |
4% |
-37% |
-19% |
-25% |
-21% |
-50% |
47% |
-10% |
|
*= Difference between those reporting an increase and those reporting a decrease |
|
|
|
|
|
|
|
|||
WHAT % OF YOUR CLIENTS HAVE A ROBUST SUCCESSION PLAN IN PLACE TO PASS THEIR WEALTH TO THE NEXT GENERATION? |
|
|
|
|
||||||
|
|
|
|
|
|
|
|
|
|
|
|
|
AFRICA |
ASIA |
AUSTRALASIA |
EUROPE |
LATINAMERICA |
MIDDLEEAST |
NORTHAMERICA |
RUSSIA&CIS |
GLOBAL |
|
|
AVERAGE |
||||||||
|
|
|
|
|
|
|
|
|
|
|
|
|
|
|
|
|
|
|
|
|
|
|
|
52% |
46% |
51% |
57% |
55% |
55% |
56% |
32% |
51% |
UHNWI mobility |
|
|
|
|
|
|
|
|
|
|
WHAT % OF YOUR CLIENTS HAVE A SECOND PASSPORT OR DUAL NATIONALITY? |
|
|
|
|
|
|
|
|||
|
|
|
|
|
|
|
|
|
|
|
|
|
AFRICA |
ASIA |
AUSTRALASIA |
EUROPE |
LATINAMERICA |
MIDDLEEAST |
NORTHAMERICA |
RUSSIA&CIS |
GLOBAL |
|
|
|
|
|
|
|
|
|
|
AVERAGE |
|
|
|
|
|
|
|
|
|
|
|
|
|
29% |
26% |
24% |
32% |
71% |
41% |
30% |
39% |
36% |
WHAT % OF YOUR CLIENTS ARE CONSIDERING ACQUIRING A SECOND PASSPORT/DUAL NATIONALITY? |
|
|
|
|
|
|
||||
|
|
|
|
|
|
|
|
|
|
|
|
|
AFRICA |
ASIA |
AUSTRALASIA |
EUROPE |
LATINAMERICA |
MIDDLEEAST |
NORTHAMERICA |
RUSSIA&CIS |
GLOBAL |
|
|
|
|
|
|
|
|
|
|
AVERAGE |
|
|
|
|
|
|
|
|
|
|
|
|
|
32% |
27% |
8% |
21% |
54% |
29% |
22% |
42% |
29% |
WHAT % OF YOUR CLIENTS ARE CONSIDERING EMIGRATING PERMANENTLY TO ANOTHER COUNTRY? |
|
|
|
|
|
|
||||
|
|
|
|
|
|
|
|
|
|
|
|
|
AFRICA |
ASIA |
AUSTRALASIA |
EUROPE |
LATINAMERICA |
MIDDLEEAST |
NORTHAMERICA |
RUSSIA&CIS |
GLOBAL |
|
|
|
|
|
|
|
|
|
|
AVERAGE |
|
|
|
|
|
|
|
|
|
|
|
|
|
23% |
25% |
6% |
21% |
65% |
24% |
17% |
31% |
26% |
WHERE ARE THOSE CONSIDERING EMIGRATING MOST LIKELY TO MOVE TO? (TOP FIVE DESTINATIONS) |
|
|
|
|
|
|
||||
|
|
|
|
|
|
|
|
|
|
|
|
|
AFRICA |
ASIA |
AUSTRALASIA |
EUROPE |
LATINAMERICA |
MIDDLEEAST |
NORTHAMERICA |
RUSSIA&CIS |
GLOBAL |
|
|
AVERAGE |
||||||||
|
|
|
|
|
|
|
|
|
|
|
|
|
|
|
|
|
|
|
|
|
|
1 |
|
UK |
Australia |
Australia |
Switzerland |
Spain |
UK |
US |
US |
US |
2 |
|
Australia |
Canada |
US |
US |
US |
Canada |
Caribbean |
Spain |
UK |
3 |
|
Canada |
US |
UK |
Portugal |
Switzerland |
US |
Canada |
UK |
Canada |
4 |
|
US |
Singapore |
Singapore |
Monaco |
Caribbean |
UAE |
UK |
Switzerland |
Australia |
5 |
|
New Zealand |
UK |
New Zealand |
France |
Canada |
Switzerland |
Switzerland |
Germany |
Switzerland |
88 | KNIGHTFRANK.COM |
89 | KNIGHTFRANK.COM |

vk.com/id446425943 |
|
|
|
|
|
|
|
|
|||
INVESTING, SPENDING AND GIVING TRENDS |
|
|
|
|
|
|
|
||||
Residential property |
|
|
|
|
|
|
|
|
|
||
|
WHAT % OF YOUR CLIENTS’ TOTAL WEALTH IS ALLOCATED TO THE PROPERTIES THEY LIVE IN (FIRST AND SECOND HOMES)? |
|
|
|
|
||||||
|
|
|
|
|
|
|
|
|
|
|
|
|
|
|
AFRICA |
ASIA |
AUSTRALASIA |
EUROPE |
LATINAMERICA |
MIDDLEEAST |
NORTHAMERICA |
RUSSIA&CIS |
GLOBAL |
|
|
|
|
|
|
|
|
|
|
|
AVERAGE |
|
|
|
|
|
|
|
|
|
|
|
|
|
|
|
41% |
39% |
37% |
27% |
38% |
21% |
31% |
23% |
32% |
|
HOW MANY RESIDENCES (INCLUDING THEIR PRIMARY RESIDENCE) DO THEY HAVE ON AVERAGE? |
|
|
|
|
|
|
||||
|
|
|
|
|
|
|
|
|
|
|
|
|
|
|
AFRICA |
ASIA |
AUSTRALASIA |
EUROPE |
LATINAMERICA |
MIDDLEEAST |
NORTHAMERICA |
RUSSIA&CIS |
GLOBAL |
|
|
|
|
|
|
|
|
|
|
|
AVERAGE |
|
|
|
|
|
|
|
|
|
|
|
|
|
|
|
3.40 |
3.92 |
2.71 |
3.35 |
4.71 |
4.63 |
3.17 |
3.13 |
3.63 |
|
WHAT % HAVE SECOND HOMES OUTSIDE THEIR MAIN COUNTRY OF RESIDENCE? |
|
|
|
|
|
|
||||
|
|
|
|
|
|
|
|
|
|
|
|
|
|
|
AFRICA |
ASIA |
AUSTRALASIA |
EUROPE |
LATINAMERICA |
MIDDLEEAST |
NORTHAMERICA |
RUSSIA&CIS |
GLOBAL |
|
|
|
|
|
|
|
|
|
|
|
AVERAGE |
|
|
|
|
|
|
|
|
|
|
|
|
|
|
|
17% |
35% |
15% |
49% |
65% |
74% |
35% |
46% |
42% |
|
WHAT % OF YOUR CLIENTS BOUGHT A NEW HOME IN THEIR COUNTRY OF RESIDENCE IN 2018? |
|
|
|
|
|
|
||||
|
|
|
|
|
|
|
|
|
|
|
|
|
|
|
AFRICA |
ASIA |
AUSTRALASIA |
EUROPE |
LATINAMERICA |
MIDDLEEAST |
NORTHAMERICA |
RUSSIA&CIS |
GLOBAL |
|
|
|
|
|
|
|
|
|
|
|
AVERAGE |
|
|
|
|
|
|
|
|
|
|
|
|
|
|
|
15% |
27% |
16% |
15% |
38% |
15% |
14% |
16% |
19% |
|
WHAT % OF YOUR CLIENTS BOUGHT A NEW HOME OUTSIDE THEIR COUNTRY OF RESIDENCE IN 2018? |
|
|
|
|
|
|
||||
|
|
|
|
|
|
|
|
|
|
|
|
|
|
|
AFRICA |
ASIA |
AUSTRALASIA |
EUROPE |
LATINAMERICA |
MIDDLEEAST |
NORTHAMERICA |
RUSSIA&CIS |
GLOBAL |
|
|
|
|
|
|
|
|
|
|
|
AVERAGE |
|
|
|
|
|
|
|
|
|
|
|
|
|
|
|
10% |
23% |
6% |
20% |
62% |
27% |
12% |
19% |
22% |
|
WHAT % OF YOUR CLIENTS ARE PLANNING TO BUY A NEW HOME IN THEIR COUNTRY OF RESIDENCE IN 2019/20? |
|
|
|
|
|
|||||
|
|
|
|
|
|
|
|
|
|
|
|
|
|
|
AFRICA |
ASIA |
AUSTRALASIA |
EUROPE |
LATINAMERICA |
MIDDLEEAST |
NORTHAMERICA |
RUSSIA&CIS |
GLOBAL |
|
|
|
|
|
|
|
|
|
|
|
AVERAGE |
|
|
|
|
|
|
|
|
|
|
|
|
|
|
|
17% |
26% |
15% |
15% |
23% |
13% |
14% |
16% |
18% |
|
WHAT % OF YOUR CLIENTS ARE PLANNING TO BUY A NEW HOME OUTSIDE THEIR COUNTRY OF RESIDENCE IN 2019/20? |
|
|
|
|
|
|||||
|
|
|
|
|
|
|
|
|
|
|
|
|
|
|
AFRICA |
ASIA |
AUSTRALASIA |
EUROPE |
LATINAMERICA |
MIDDLEEAST |
NORTHAMERICA |
RUSSIA&CIS |
GLOBAL |
|
|
|
|
|
|
|
|
|
|
|
AVERAGE |
|
|
|
|
|
|
|
|
|
|
|
|
|
|
|
11% |
25% |
4% |
21% |
56% |
27% |
11% |
23% |
22% |
|
IN WHICH COUNTRIES OR TERRITORIES ARE THOSE PLANNING A PURCHASE MOST LIKELY TO BUY? (TOP FIVE DESTINATIONS) |
|
|
|
|
||||||
|
|
|
|
|
|
|
|
|
|
|
|
|
|
|
AFRICA |
ASIA |
AUSTRALASIA |
EUROPE |
LATINAMERICA |
MIDDLEEAST |
NORTHAMERICA |
RUSSIA&CIS |
GLOBAL |
|
|
|
AVERAGE |
||||||||
|
|
|
|
|
|
|
|
|
|
|
|
|
|
|
|
|
|
|
|
|
|
|
|
1 |
|
UK |
Australia |
Australia |
France |
Spain |
UK |
US |
Spain |
US |
|
2 |
|
Australia |
UK |
UK |
Spain |
US |
US |
Canada |
France |
UK |
|
3 |
|
US |
Canada |
New Zealand |
US |
Caribbean |
France |
Mexico |
US |
Australia |
|
4 |
|
Canada |
US |
US |
UK |
France |
UAE |
Caribbean |
UK |
Spain |
|
5 |
|
Mauritius |
Singapore |
France |
Switzerland |
Switzerland |
Switzerland |
Spain |
Switzerland |
Canada |
|
Property investments |
|
|
|
|
|
|
|
|
|
||
|
WHAT % OF YOUR CLIENTS HAVE PROPERTY INVESTMENTS (EXCLUDING FIRST AND SECOND HOMES) IN THEIR COUNTRY OF RESIDENCE? |
|
|
|
|
||||||
|
|
|
|
|
|
|
|
|
|
|
|
|
|
|
AFRICA |
ASIA |
AUSTRALASIA |
EUROPE |
LATINAMERICA |
MIDDLEEAST |
NORTHAMERICA |
RUSSIA&CIS |
GLOBAL |
|
|
|
|
|
|
|
|
|
|
|
AVERAGE |
|
|
|
|
|
|
|
|
|
|
|
|
|
|
|
40% |
53% |
63% |
53% |
57% |
63% |
56% |
33% |
52% |
|
WHAT % OF YOUR CLIENTS HAVE PROPERTY INVESTMENTS (EXCLUDING FIRST AND SECOND HOMES) OUTSIDE THEIR COUNTRY OF RESIDENCE? |
|
|
|
|
||||||
|
|
|
|
|
|
|
|
|
|
|
|
|
|
|
AFRICA |
ASIA |
AUSTRALASIA |
EUROPE |
LATINAMERICA |
MIDDLEEAST |
NORTHAMERICA |
RUSSIA&CIS |
GLOBAL |
|
|
|
|
|
|
|
|
|
|
|
AVERAGE |
|
|
|
|
|
|
|
|
|
|
|
|
|
|
|
19% |
32% |
18% |
34% |
69% |
55% |
22% |
19% |
33% |
|
WHAT % OF YOUR CLIENTS INVESTED IN PROPERTY (EXCLUDING FIRST AND SECOND HOMES) IN THEIR COUNTRY OF RESIDENCE IN 2018? |
|
|
|
|
||||||
|
|
|
|
|
|
|
|
|
|
|
|
|
|
|
AFRICA |
ASIA |
AUSTRALASIA |
EUROPE |
LATINAMERICA |
MIDDLEEAST |
NORTHAMERICA |
RUSSIA&CIS |
GLOBAL |
|
|
|
|
|
|
|
|
|
|
|
AVERAGE |
|
|
|
|
|
|
|
|
|
|
|
|
|
|
|
20% |
34% |
27% |
25% |
30% |
20% |
25% |
13% |
24% |
|
|
|
|
|
|
|
|
|
Databank |
WHAT % OF YOUR CLIENTS INVESTED IN PROPERTY (EXCLUDING FIRST AND SECOND HOMES) OUTSIDE THEIR COUNTRY OF RESIDENCE IN 2018? |
|
|
|
|
|||||
|
|
|
|
|
|
|
|
|
|
|
AFRICA |
ASIA |
AUSTRALASIA |
EUROPE |
LATINAMERICA |
MIDDLEEAST |
NORTHAMERICA |
RUSSIA&CIS |
GLOBAL |
|
|
|
|
|
|
|
|
|
AVERAGE |
|
|
|
|
|
|
|
|
|
|
|
14% |
24% |
9% |
18% |
59% |
42% |
13% |
17% |
25% |
WHAT % OF YOUR CLIENTS ARE PLANNING TO INVEST IN PROPERTY (EXCLUDING FIRST AND SECOND HOMES) IN THEIR COUNTRY OF RESIDENCE IN 2019/20? |
|
|
|
||||||
|
|
|
|
|
|
|
|
|
|
|
AFRICA |
ASIA |
AUSTRALASIA |
EUROPE |
LATINAMERICA |
MIDDLEEAST |
NORTHAMERICA |
RUSSIA&CIS |
GLOBAL |
|
|
|
|
|
|
|
|
|
AVERAGE |
|
|
|
|
|
|
|
|
|
|
|
23% |
33% |
25% |
27% |
17% |
21% |
20% |
18% |
23% |
WHAT % OF YOUR CLIENTS ARE PLANNING TO INVEST IN PROPERTY (EXCLUDING FIRST AND SECOND HOMES) OUTSIDE THEIR COUNTRY OF RESIDENCE IN 2019/20? |
|
|
|||||||
|
|
|
|
|
|
|
|
|
|
|
AFRICA |
ASIA |
AUSTRALASIA |
EUROPE |
LATINAMERICA |
MIDDLEEAST |
NORTHAMERICA |
RUSSIA&CIS |
GLOBAL |
|
|
|
|
|
|
|
|
|
AVERAGE |
|
|
|
|
|
|
|
|
|
|
|
17% |
27% |
10% |
24% |
61% |
46% |
12% |
19% |
27% |
IN WHICH COUNTRIES ARE THEY MOST LIKELY TO INVEST? (TOP FIVE DESTINATIONS) |
|
|
|
|
|
|
|||
|
|
|
|
|
|
|
|
|
|
|
AFRICA |
ASIA |
AUSTRALASIA |
EUROPE |
LATINAMERICA |
MIDDLEEAST |
NORTHAMERICA |
RUSSIA&CIS |
GLOBAL |
|
AVERAGE |
||||||||
|
|
|
|
|
|
|
|
|
|
|
|
|
|
|
|
|
|
|
|
1 |
UK |
Australia |
Australia |
US |
US |
UK |
US |
France |
US |
2 |
Australia |
US |
UK |
France |
Spain |
US |
Canada |
US |
UK |
3 |
US |
UK |
US |
UK |
Caribbean |
UAE |
Caribbean |
UK |
Spain |
4 |
Canada |
Canada |
New Zealand |
Spain |
France |
France |
Australia |
Spain |
Australia |
5 |
Mauritius |
Singapore |
Canada |
Italy |
Italy |
Canada |
Italy |
Switzerland |
France |
Philanthropy, investments of passion and education
HOW HAVE YOUR CLIENTS’ PHILANTHROPIC ACTIVITIES CHANGED IN 2018?
|
AFRICA |
ASIA |
AUSTRALASIA |
EUROPE |
LATINAMERICA |
MIDDLEEAST |
NORTHAMERICA |
RUSSIA&CIS |
GLOBAL |
|
|
AVERAGE |
|||||||||
|
|
|
|
|
|
|
|
|
||
|
|
|
|
|
|
|
|
|
|
|
INCREASED |
12% |
28% |
53% |
29% |
20% |
33% |
44% |
14% |
29% |
|
NO CHANGE |
64% |
61% |
47% |
66% |
60% |
62% |
44% |
50% |
57% |
|
DECREASED |
24% |
11% |
0% |
5% |
20% |
5% |
12% |
36% |
14% |
|
WHAT % OF YOUR CLIENTS ACTIVELY COLLECT AN INVESTMENT OF PASSION SUCH AS ART, WINE OR CLASSIC CARS? |
|
|
|
|
|
|||||
|
|
|
|
|
|
|
|
|
|
|
|
AFRICA |
ASIA |
AUSTRALASIA |
EUROPE |
LATINAMERICA |
MIDDLEEAST |
NORTHAMERICA |
RUSSIA&CIS |
GLOBAL |
|
|
|
|
|
|
|
|
|
|
AVERAGE |
|
|
|
|
|
|
|
|
|
|
|
|
|
18% |
25% |
31% |
33% |
37% |
26% |
25% |
30% |
28% |
|
ARE MORE OF YOUR CLIENTS STARTING TO COLLECT INVESTMENTS OF PASSION? |
|
|
|
|
|
|
||||
|
|
|
|
|
|
|
|
|
|
|
|
AFRICA |
ASIA |
AUSTRALASIA |
EUROPE |
LATINAMERICA |
MIDDLEEAST |
NORTHAMERICA |
RUSSIA&CIS |
GLOBAL |
|
|
AVERAGE |
|||||||||
|
|
|
|
|
|
|
|
|
||
|
|
|
|
|
|
|
|
|
|
|
YES |
29% |
39% |
40% |
44% |
60% |
29% |
24% |
50% |
39% |
|
NO |
71% |
62% |
60% |
56% |
40% |
71% |
76% |
50% |
61% |
|
WHICH INVESTMENTS OF PASSION DO THEY MOST COMMONLY COLLECT? (TOP FIVE CHOICES) |
|
|
|
|
|
|
||||
|
|
|
|
|
|
|
|
|
|
|
|
AFRICA |
ASIA |
AUSTRALASIA |
EUROPE |
LATINAMERICA |
MIDDLEEAST |
NORTHAMERICA |
RUSSIA&CIS |
GLOBAL |
|
|
AVERAGE |
|||||||||
|
|
|
|
|
|
|
|
|
||
|
|
|
|
|
|
|
|
|
|
|
1 |
Cars |
Art |
Art |
Art |
Art |
Watches |
Art |
Art |
Art |
|
2 |
Art |
Watches |
Cars |
Cars |
Wine |
Art |
Cars |
Cars |
Cars |
|
3 |
Watches |
Cars |
Wine |
Wine |
Watches |
Cars |
Wine |
Watches |
Watches |
|
4 |
Wine |
Jewellery |
Watches |
Watches |
Cars |
Wine |
Watches |
Jewellery |
Wine |
|
5 |
Jewellery |
Wine |
Jewellery |
Jewellery |
Jewellery |
Jewellery |
Jewellery |
Wine |
Jewellery |
|
WHAT % OF YOUR CLIENTS SEND THEIR CHILDREN OVERSEAS FOR THEIR EDUCATION? |
|
|
|
|
|
|
||||
|
|
|
|
|
|
|
|
|
|
|
|
AFRICA |
ASIA |
AUSTRALASIA |
EUROPE |
LATINAMERICA |
MIDDLEEAST |
NORTHAMERICA |
RUSSIA&CIS |
GLOBAL |
|
|
AVERAGE |
|||||||||
|
|
|
|
|
|
|
|
|
||
|
|
|
|
|
|
|
|
|
|
|
SCHOOL |
34% |
46% |
8% |
20% |
48% |
49% |
13% |
31% |
31% |
|
UNIVERSITY |
50% |
64% |
17% |
31% |
85% |
74% |
17% |
47% |
48% |
|
DO YOU EXPECT THIS % TO INCREASE OVER THE NEXT FEW YEARS? |
|
|
|
|
|
|
|
|||
|
|
|
|
|
|
|
|
|
|
|
% OF RESPONDENTS |
AFRICA |
ASIA |
AUSTRALASIA |
EUROPE |
LATINAMERICA |
MIDDLEEAST |
NORTHAMERICA |
RUSSIA&CIS |
GLOBAL |
|
WHO SAID YES |
AVERAGE |
|||||||||
|
|
|
|
|
|
|
|
|||
|
|
|
|
|
|
|
|
|
|
|
SCHOOL |
86% |
84% |
13% |
40% |
80% |
70% |
28% |
86% |
61% |
|
UNIVERSITY |
95% |
84% |
32% |
51% |
60% |
80% |
28% |
79% |
64% |
|
90 | KNIGHTFRANK.COM |
91 | KNIGHTFRANK.COM |

vk.com/id446425943
LETTER FROM THE EDITOR
A wider horizon
ANDREW SHIRLEY
EDITOR, THE WEALTH REPORT
|
|
|
|
|
F |
or those of you who, like me, |
This year has been no exception. I’ve been |
ever more crucial to fill the policy vacuum |
|
|
|
|||
|
|
tend to start reading their maga- |
lucky enough to visit some amazing places |
left by governments around the world that |
|
|
zinesfromtheback,welcome.For |
and interview some incredible visionaries |
seem increasingly unable to cope with the |
|
|
those who prefer to adopt a more |
who are using their wealth to make the world |
demands of their citizens. |
|
conventionalapproach,thankyouformaking |
a better place for future generations. People |
To put things into perspective, on the same |
|
|
it through to the end. |
like Jochen Zeitz, Sir Richard Branson and |
evening (15 January 2019) as politicians in |
|
|
I won’t use this note to summarise our key |
Dr Lisbet Rausing to name just three. |
Westminster were gathering for the vote that |
|
|
findings – my colleague Liam Bailey hasdone |
But it was my visit to Samara, a conserva- |
saw Prime Minister Theresa May’s Brexit deal |
|
|
an excellent job of that on pages 4 and 5 – but |
tion reserve in South Africa owned by the |
defeated by an unpredecedented margin, |
|
|
rather to share a few thoughts that have |
Tompkins family, with my son that really |
I received confirmation that my colleagues |
|
|
come to me as we’ve been putting this edition |
emphasised the invaluable role that private |
in Nairobi were all safe following the latest |
|
|
of the report together. |
individuals and their families can play. As |
lethal terrorist attack, this time on a hotel |
|
|
Editing The Wealth Report over the past |
you can read on page 66, the family has |
close to where I spoke at a launch event for |
|
|
11 years has undoubtedly been the highlight |
worked tirelessly and passionately to rewild |
The Wealth Report last year. |
|
|
of my time at Knight Frank. First, because |
a vast swathe of the Karoo region, provide |
An uncomfortable thought, perhaps, but |
|
|
the feedback we get from our readers and |
employment for the local community and |
one that highlights the need for a glob- |
|
|
teams around the world suggests that they |
educate visitors from across the globe about |
al perspective when looking at the issues |
|
|
find it incredibly useful, which is always |
the value of the environment. |
that affect wealth creation and the impact |
|
|
gratifying. And second because, without |
As leading political risk analyst Dr Ian |
wealth has on economic outcomes for all of |
|
|
fail, the process of compiling every edition |
Bremmer points out on page 16, this role, |
us. I hope you feel that The Wealth Report |
|
|
has given me a broader perspective on the |
whether it covers the environment or any |
delivers that perspective. It would be great |
|
|
big issues facing us all. |
other issues facing society, will become |
to hear your thoughts. |
|
The Wealth Report is just one of a series of publications and reports published by Knight Frank throughout the year.
Subscribe at the URL below to receive our publications, either by email or post:
knightfrank.com/publications
For interactive data and more information on The Wealth Report, please follow us on:
@ knightfrank |
@knightfrank |
/KnightFrankLLP |
Important notice
SENIOR PARTNER AND GROUP CHAIRMAN
Alistair Elliott +44 20 7861 1141 alistair.elliott@knightfrank.com
PRIVATE OFFICE
Rory Penn +44 20 7861 1150 rory.penn@knightfrank.com
COMMERCIAL PROPERTY ENQUIRIES
Alex James +44 20 3967 7118 alex.james@knightfrank.com
GLOBAL PROPERTY SERVICES
Lord Andrew Hay Residential +44 20 7861 1071
andrew.hay@knightfrank.com
Andrew Sim Capital Markets +44 20 7861 1193
andrew.sim@knightfrank.com
William Beardmore-Gray Occupier Services & Commercial Agency +44 20 7861 1308 william.beardmore-gray@knightfrank.com
Rupert Johnson Valuation & Advisory +44 20 7861 1284
rupert.johnson@knightfrank.com
The Wealth Report (© Knight Frank LLP 2019) is produced for general interest only; it is not definitive and is not intended to give advice. It must not be relied upon in any way. Although we believe that high standards have been used in the preparation of the information, analysis and views presented in The Wealth Report, no responsibility or liability whatsoever can be accepted by Knight Frank for the contents. We make no express or implied warranty or guarantee of the accuracy of any of the contents. As far as applicable laws allow, we do not accept responsibility for errors, inaccuracies or omissions, nor for loss or damage that may result directly or indirectly from reliance on or use of its contents. The Wealth Report does not necessarily reflect the view of Knight Frank in any respect. Information may have been provided by others without verification. Readers should not take or omit to take any action as a result of information in The Wealth Report. Reproduction of this report in whole or in part is not permitted without the prior written approval of Knight Frank LLP. In preparing The Wealth Report, Knight Frank does not imply or establish any client, advisory, financial or professional relationship. Through The Wealth Report, neither Knight Frank nor any other person is providing advisory, financial or other services. In particular, Knight Frank LLP is not authorised by the Financial Services Authority to undertake regulated activities (other than limited insurance intermediation activity in connection with property management). Knight Frank LLP also trades as Knight Frank. Knight Frank LLP is a limited liability partnership registered in England with registered number OC305934. Our registered office is 55 Baker Street, London, W1U 8AN, where you may look at a list of members’ names. The Wealth Report is compiled from information contributed by various sources including Knight Frank LLP, its direct UK subsidiaries and a network of separate and independent overseas entities or practices offering property services. Together these are generally known as “the Knight Frank global network”. Each entity or practice in the Knight Frank global network is a distinct and separate legal entity. Its ownership and management is distinct from that of any other entity or practice, whether operating under the name Knight Frank or otherwise. In any event, no entity or practice operating under the name Knight Frank (including Knight Frank LLP) is liable for the acts or omissions of any other entity or practice. Nor does it act as an agent for or have any authority (whether actual, apparent, implied or otherwise) to represent, bind or oblige in any way any other entity or practice that operates under the name Knight Frank (including Knight Frank LLP). Where applicable, references to Knight Frank include the Knight Frank global network.
92 | KNIGHTFRANK.COM

vk.com/id446425943
Computer generated image for indicative purposes only
One Blackfriars, London
KNIGHT FRANK GLOBAL WEALTH ADVISORY
Helping you navigate the world’s prime property markets
Knight Frank’s Global Wealth Advisory team leverages market-leading research and best-in-class advice to provide exceptional service to our global private clients
Connecting people & property, perfectly.
knightfrank.com