

JPM EM Corporate Fundamentals Checkup_watermark
.pdfvk.com/id446425943 |
Global Credit Research |
|
17 December 2018 |
EM Corporate Fundamentals Checkup
2018 marks another year of deleveraging; 2019 subject to macro developments
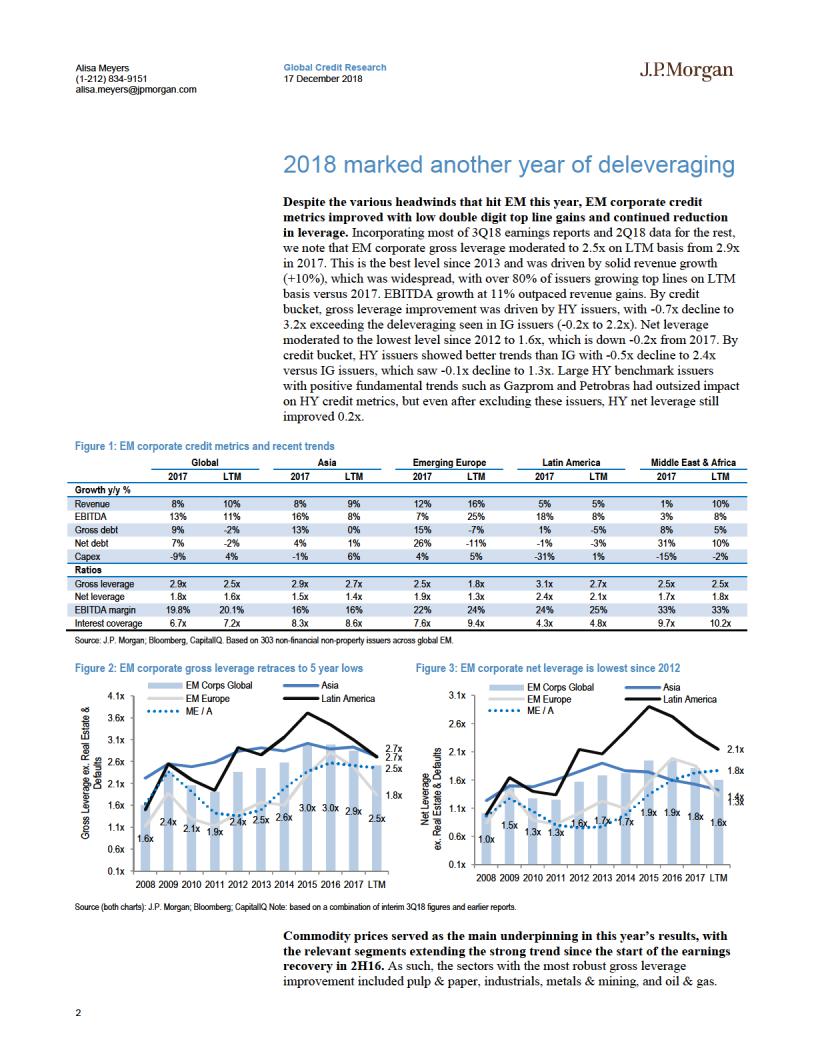
Despite the various headwinds that hit EM this year, EM corporate credit metrics improved this year with low double digit top line gains and continued reduction in leverage.
EM corporate gross leverage moderated to 2.5x on LTM basis from 2.9x in 2017. This is the best level since 2013 and was driven by solid revenue growth (+10%), which was widespread, with over 80% of issuers growing top lines on LTM basis versus 2017. EBITDA growth at 11% outpaced revenue gains. By credit bucket, HY issuers showed more improvement than IG with -0.5x decline to 2.4x versus IG issuers, which saw -0.1x decline to 1.3x.
Commodity prices served as the main underpinning in this year’s operating performance, with the relevant segments extending the strong trend since the start of the earnings recovery in 2H16. On the flip side, there was a modest pick-up in leverage across domestic sectors.
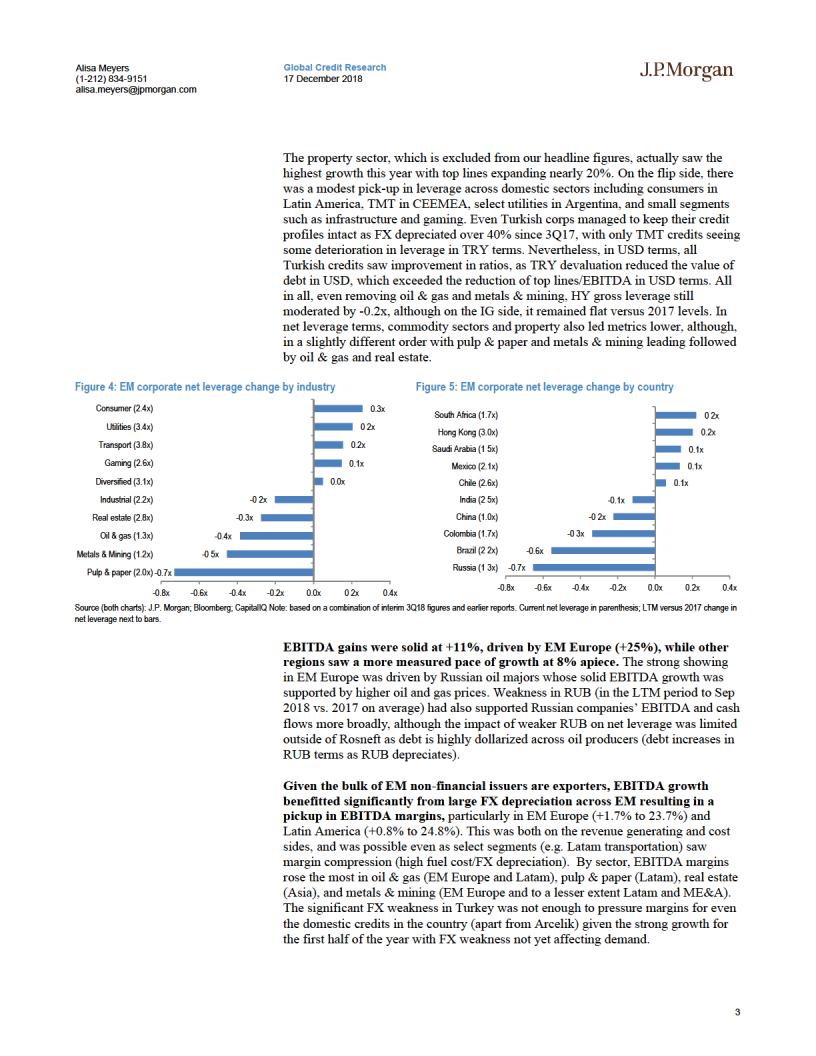
Given the bulk of EM non-financial issuers are exporters, EBITDA growth benefitted significantly from large FX depreciation across EM resulting in a modest pickup in EBITDA margins.
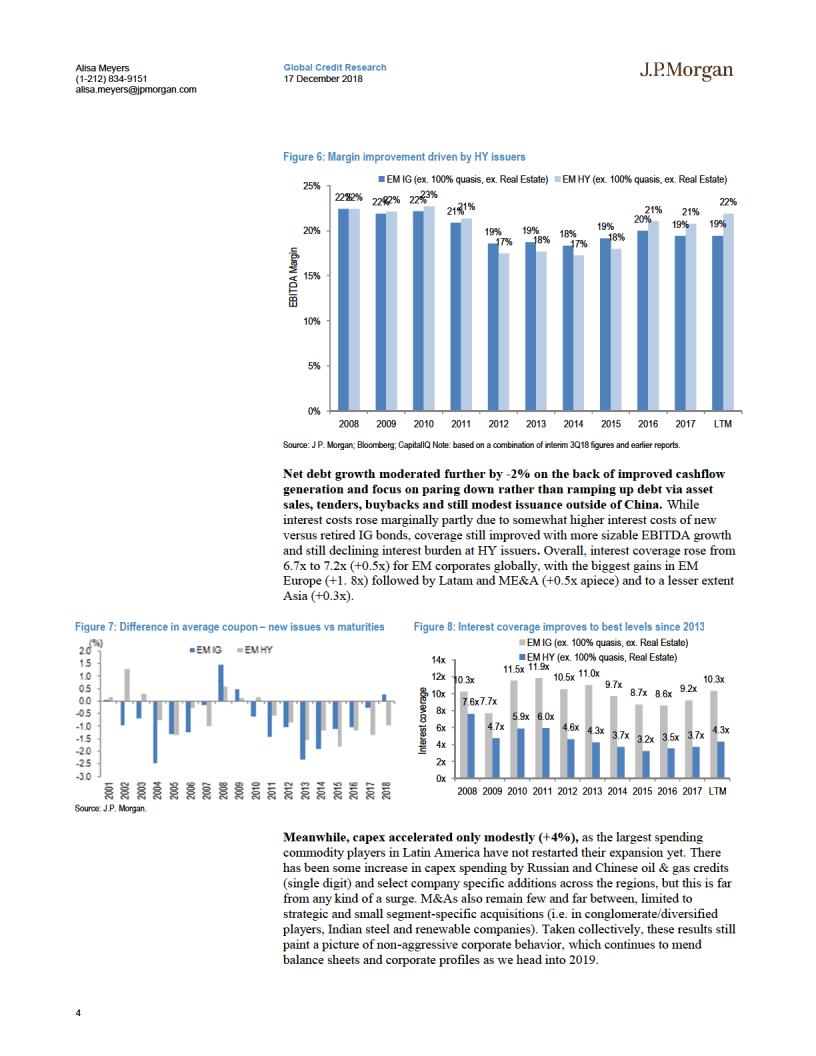
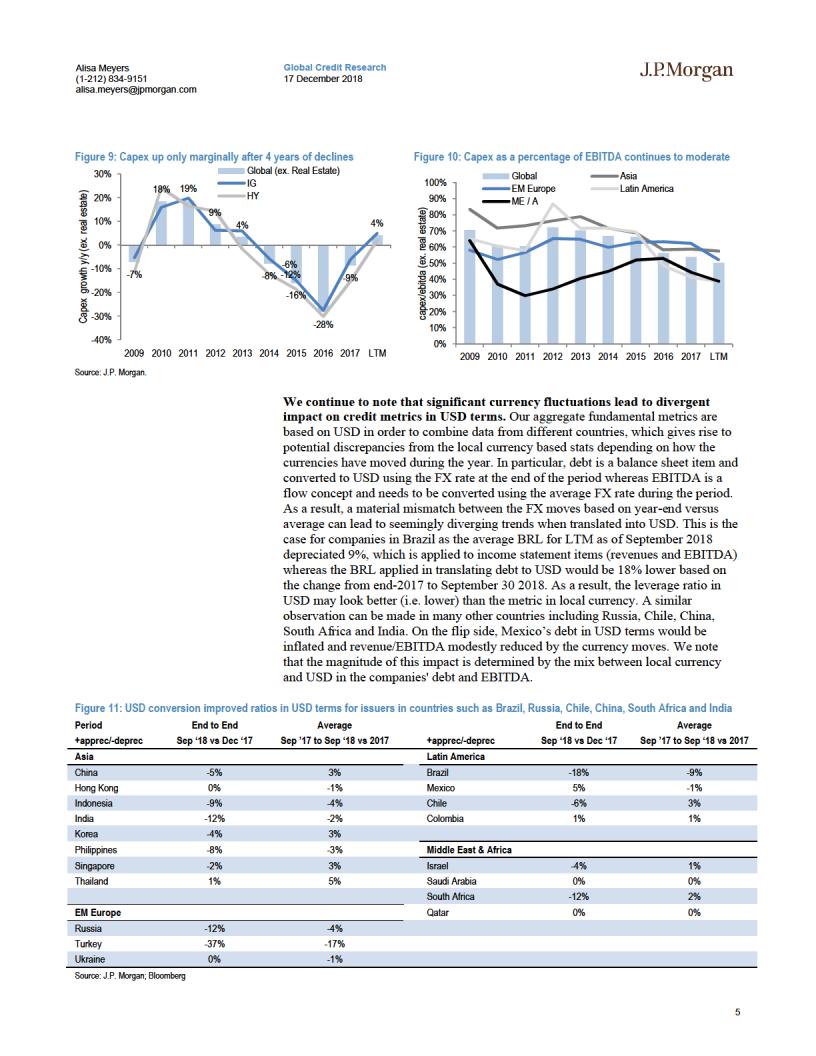
On the debt side, improved cashflow generation and focus on paring down debt via asset sales, tenders, buybacks and still modest issuance outside of China kept net debt growth moderating further by -2%. Lastly, capex accelerated only modestly (+4%), as the largest spending commodity players in Latin America have not restarted their expansion yet.
The trend in leverage between EM and US IG has diverged sharply in recent years, with EM IG net leverage recovering from conservative behavior whereas US IG remains elevated at almost 1x higher following shareholder friendly activities and M&A. On the HY side, both US and EM HY credits generally saw deleveraging this year but the pace of improvement has been more pronounced in EM HY. European issuers have seen leverage creep up in both IG and HY this year.
Spread per Turn of Leverage (STNL) rose for EM corporates as fundamentals improved and spreads widened, but EM attractiveness has not necessarily improved as STNL for global comparables also rose following the correction in DM. Indeed STNL improved for EM only versus US HY.
We think EM corporate fundamentals are in good shape as we head into 2019, but a big swing factor would be the intensification of trade wars, which could materially impact the trajectory of commodity prices and GDP growth as well as policy developments in the large economies with newly appointed presidents. We believe EM corporates could still have single-digit EBITDA gains and further reduction in leverage in 2019 but macro factors will be important to watch.
See page 21 for analyst certification and important disclosures.
Emerging Markets Corporate Strategy
Alisa Meyers AC
(1-212) 834-9151 alisa.meyers@jpmorgan.com
Yang-Myung Hong
(1-212) 834-4274 ym.hong@jpmorgan.com
Zubair K Syed
(1-212) 834-5230
zubair.k syed@jpmorgan.com J.P. Morgan Securities LLC
J.P. Morgan does and seeks to do business with companies covered in its research reports. As a result, investors should be aware that the firm may have a conflict of interest that could affect the objectivity of this report. Investors should consider this report as only a single factor in making their investment decision.
www.jpmorganmarkets.com
vk.com/id446425943
vk.com/id446425943
vk.com/id446425943
vk.com/id446425943

vk.com/id446425943
Alisa Meyers |
Global Credit Research |
(1-212) 834-9151 |
17 December 2018 |
alisa.meyers@jpmorgan.com |
|
Regional dynamics
In Asia, revenues rose 9% from 2017, representing a modest acceleration from last year (+8%). Oil & gas credits across China, India and Thailand saw the largest gains (note that a sizable portion of Indian credits still reflect LTM figures through March 2018) but in aggregate 82% of companies saw a rise in revenues versus 2017 figures. Larger scale declines were more idiosyncratic/name specific including Baosteel, Bharti, Chalco, and Li & Fung. While revenues were up 9%, EBITDA was up a touch lower at 8%, driven by KORELE and select TMT issuers where EBITDA declined. As such, EBITDA margins were down modestly to 16.3% (-0.2%), driven by utilities and to a lesser extent TMT. Gross and net debt moderated, in line with the trend we have seen in the external primary market, which has been down 22% y/y. While overall debt levels declined, this was driven by the larger capital structures, as a slightly larger portion of companies actually saw gross and net debt levels pick up (56% and 61%, respectively). Capex picked up 6% from 2017 levels, driven by oil & gas credits.
Latin America corporate revenues pickup up for the majority of issuers and declines were generally limited to low single digits, resulting in 5% gains from 2017 levels in aggregate (in line with 2017 growth). EBITDA picked up 8%, which enabled margins to improve +0.8% to 24.8%. Still, only 65% of companies in the region posted an increase in EBITDA with underperformance by locally focused segments including consumer/utilities whereas larger commodity players/exporters had stronger trends. The improvement in revenues was broader based at 74%. Gross debt moderated further, declining -5% LTM versus 2017. This was disproportionately driven by larger Brazilian corporates, which continued liability management programmes, while elsewhere, the share of companies increasing and reducing debt was balanced. Net debt moderated -3% after dropping -1% last year. Given the rise in EBITDA and decline in debt, gross and net leverage in the region declined 0.4x and 0.2, to 2.7x and 2.1x, respectively. Interest coverage increased for over 60% of issuers, with the ratio improving +0.5x to 4.8x. Capex picked up a touch (+1%) in LTM figures after declining -31% last year with the Brazilian commodity/exporting companies once again seeing more outsized reductions while other sectors have been more balanced. One of the exceptions was TMT, where expansions throughout the region resulted in a pick-up in capex.
The improvement in EM Europe credit metrics and profitability was driven by higher oil prices and benefited from RUB depreciation. Overall, EM Europe net leverage dropped -0.5x to 1.3x as EBITDA surged +25% on higher oil prices and still solid Turkish growth for the LTM period. The depreciating RUB led to improved profitability for exporting credits. On the debt side, the RUB portion of Russian companies' debt declined in USD terms as RUB depreciated. All else equal, the RUB portion of Russian companies’ debt declined in USD terms by -12% from 2017 levels. Assuming half of Russian companies’ debt is RUB denominated, that would translate into -6% decline in debt from RUB depreciation specifically. This is particularly the case for Rosneft, whereas other companies’ RUB denominated debt is likely much lower. Nevertheless, we have been hearing that Russian issuers have focused on de-dollarizing, so incrementally, weaker RUB should have led to lower debt in USD terms. Specifically for Rosneft, around half of net debt decline could have been due to RUB depreciation this year. Notably, Rosneft is a significant contributor to overall EM European metrics given its size, but even excluding the name, overall net leverage for EM European HY companies declined by -0.3x to 1.8x from 2017 (versus -0.8x decline with Rosneft). Turkish companies have continued to show strong EBITDA growth in local currency terms, which was still positive when
6

vk.com/id446425943
Alisa Meyers |
Global Credit Research |
(1-212) 834-9151 |
17 December 2018 |
alisa.meyers@jpmorgan.com |
|
translated to USD. Overall, Turkish companies have been able to increase prices and pass on inflation in their costs, so EBITDA margins have not been come under pressure just yet.
In Middle East & Africa, the improvement in metrics appears more muted due to select issuer specific drivers. Overall, net leverage for the region remained about flat at 1.8x although interest coverage continued to improve given still modest interest costs and 8% rise in EBITDA. Some one-off drivers in the region included SECO, which is a disproportionate contributor to the region's metrics given its size. The issuer had a one off impact in 2017, which inflated margins and EBITDA, with 2018 figures reflecting more normalized trends. SECO has also been posting increases to debt levels on the back of ongoing capex for the past few years, which combined with lower EBITDA resulted in leverage picking up y/y. Others such as Kosmos Energy had leverage go up somewhat on acquisitions.
For more color on fundamentals trends in each of EM regions, please see the regional sections of our EM Corporate 2019 Outlook report.
7

vk.com/id446425943

vk.com/id446425943
vk.com/id446425943