

GS Top Ten Market Themes for 2019_watermark
.pdfvk.com/id446425943
Goldman Sachs
Global Markets Analyst
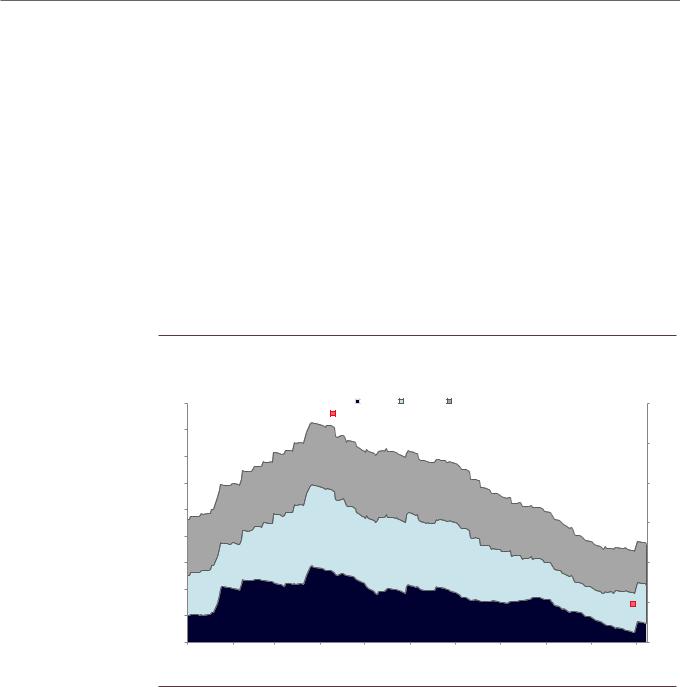
Exhibit 8: Net Leverage Metrics Also Paint a Much Healthier Picture For Households Relative to Non-financial Corporations
%
130
120
110
100
90
Debt to income ratio for households |
Ratio |
Net debt to EBITDA ratio for IG non-financial issuers (RHS) |
2.4 |
|
2.2 |
|
2.0 |
|
1.8 |
|
1.6 |
|
1.4 |
80 |
|
|
|
|
|
|
1.2 |
|
|
|
|
|
|
||
1998 |
2002 |
2006 |
2010 |
2014 |
2018 |
|
|
Source: Bloomberg, FactSet, Federal Reserve Board, Goldman Sachs Global Investment Research
Within the corporate credit space, concerns among regulators and market commentators have revolved around the following areas: the leveraged loan market, BBB-rated corporate bonds, and the commercial real estate market (CRE). While risks have unambiguously increased over the past few years, there are mitigating factors, in our view. This is particularly the case for (1) leveraged loans, where stretched valuations and excessive issuer-friendliness are balanced by the strong debt servicing capacity of borrowers, (2) BBB-rated bonds, where in the absence of a recession, the risk of a wave of downgrades remains low, and (3) the CRE market, where stretched valuations are offset by the notable tightening of lending standards of the past few years as well as stronger bank capital positions relative to the pre-crisis period.
From a portfolio allocation standpoint, the continued “outperformance” of households vs. corporations leaves us comfortable owning high-quality consumer ABS tranches vs. IG-rated corporate bonds—a theme that has performed well in 2018 but still has room to run, in our view (Exhibit 9). Despite stretched valuations in the CRE market, we also think high-quality CMBS tranches will likely outperform IG corporate bonds, given better underwriting standards and more supportive new issue technicals. For corporations, time is likely their most valuable asset at this stage of the cycle. The longer the expansion extends, the more time over-leveraged corporations will have to improve their credit quality. But an unexpected shock would likely prove damaging for firms with fragile balance sheets.
15 November 2018 |
11 |

vk.com/id446425943
Goldman Sachs
Global Markets Analyst
Exhibit 9: We Expect Consumer ABS to Continue to Outperform IG Corporate Credit
bp |
|
|
|
bp |
140 |
IG Corporate OAS |
|
AA-BBB rated ABS OAS (RHS) |
200 |
|
|
|
||
130 |
|
|
|
|
|
|
|
|
180 |
120 |
|
|
|
|
|
|
|
|
160 |
110 |
|
|
|
|
|
|
|
|
140 |
100 |
|
|
|
|
90 |
|
|
|
120 |
Nov-16 |
May-17 |
Nov-17 |
May-18 |
Nov-18 |
Source: ICE-BAML, Haver Analytics, Goldman Sachs Global Investment Research
6. Europe: Italy Casts a Dark Cloud
nWe expect risk appetite to remain constrained until the Italian budget crisis is resolved, which may be deep into next year.
nIn fixed income, we prefer the US Dollar corporate credit market vs. its Euro counterpart, while on the sovereign side we favor paying UK rates vs. receiving Euro area rates.
nIn FX, we ultimately see upside to the Euro. But the risk/reward looks poor over the short run.
In sharp contrast to 2017 and most of 2016, 2018 has been a tough year for European risk assets. Equity returns across all countries have been deeply negative, bond spreads to German Bunds have moved significantly wider (especially in corporate credit markets), and the Euro retreated meaningfully vs. the Dollar. Weaker growth, an escalating budget crisis in Italy, lingering uncertainty in the Brexit negotiations and the prospect of the ECB’s stimulus withdrawal have all been interacting negatively.
We expect risk appetite to remain constrained until the Italian budget crisis is resolved, which may be deep into next year. While we continue to take comfort from the limited spillover from the Italian market into other areas of the Euro fixed income complex, the murkiness of the forward policy path in Italy combined with the mediocre growth backdrop will limit upside. Our European economists remain skeptical vis-à-vis the ability of EU institutions or Italian political stakeholders to trigger a change of course in the current fiscal policy backdrop. Rather, they think further market pressure is the more likely catalyst for a return to fiscal discipline. So things may need to get worse before they get better. In credit, we recommend a tactical overweight allocation on the US Dollar market vs. its Euro counterpart, while on the sovereign side we favor paying UK
15 November 2018 |
12 |

vk.com/id446425943
Goldman Sachs
Global Markets Analyst
rates vs. receiving Euro area rates. While we ultimately see upside to the Euro, the risk/reward looks poor over the short run, and it could be a possible funding currency given high Dollar carry.
Once the smoke clears in Italy, we see plenty of reasons to remain strategically constructive. First, valuations in the equity and credit markets have reset to attractive levels. Second, the overall stance of monetary policy will remain accommodative even after the end of the ECB’s bond purchases. Our economists project no policy rate increase until the second half of 2019, with risks skewed to a later hike. Third, while growth disappointed in 2018, it likely remained above-trend for the year as a whole.
Lastly, we expect that the UK will “Brexit” on 29 March 2019. For markets, the formal exit is less important than whether the UK secures a status quo transition deal late this year, which keeps its trading rules with EU-27 unchanged until at least end-2020. Since late summer, negotiations between the two parties have trended in a favorable direction, albeit with plenty of volatility along the way. As is the case with most European negotiations, “nothing is agreed till everything is agreed”, and as we enter the endgame of securing and ratifying a deal between the UK and EU-27, the parliamentary arithmetic is daunting. We have expected a positive outcome for UK assets on the expectation of a smooth transition, although visibility is likely to remain poor and volatility is likely to remain high until we get there.
7. Small Open Economies: Tightening With Imbalances
nMonetary policy tightening should provide macro trading opportunities among the small open economies of G10 and EM.
nWe think the best prospects for paying rates and/or expressing currency longs on a sustained basis should be Canada, Norway, Israel, Hungary and New Zealand.
The small open economies of the G10 and CEE region have faced a challenging monetary policy environment since the Global Financial Crisis. Economic activity in these markets generally held up better than in the US and the Euro area. But this led to an uncomfortable choice for their central banks: raise interest rates and risk excessive currency appreciation, resulting in low domestic inflation, but limiting other types of imbalances; or “import” easy monetary policy, holding exchange rates more stable and helping to achieve inflation targets, but at the risk of contributing to other domestic imbalances. On average policymakers chose to focus on their inflation targets, and held policy rates low despite above-trend activity (Exhibit 10). But this has come at the cost of various imbalances in a number of these economies—including high house prices, debt accumulation, and wider current account deficits. How these central banks respond to these trade-offs next year should create macro trading opportunities.
15 November 2018 |
13 |

vk.com/id446425943
Goldman Sachs
Global Markets Analyst
Exhibit 10: Low Real Policy Rates Despite Positive Output Gaps
% |
Output Gaps and Policy Rates for Small Open Economies* |
% |
|||||
6 |
6 |
||||||
|
|
Output Gap |
|
Real Policy Rate |
|||
|
|
|
|
|
|||
5 |
|
|
|
|
|
|
|
|
|
|
|
5 |
4 |
|
|
|
|
|
|
|
|
|
|
|
4 |
3 |
|
|
|
|
|
|
|
|
|
|
|
3 |
2 |
|
|
|
|
|
|
|
|
|
|
|
2 |
1 |
|
|
|
|
|
|
|
|
|
|
|
1 |
0 |
|
|
|
|
|
|
|
|
|
|
|
0 |
-1 |
|
|
|
|
|
|
|
|
|
|
|
-1 |
-2 |
|
|
|
|
|
|
|
|
|
|
|
-2 |
06 |
07 |
08 |
09 |
10 |
11 |
12 |
13 |
14 |
15 |
16 |
17 |
18 |
*Sweden, Norway, Switzerland, Australia, New Zealand, Canada, Poland, Hungary, Czech Republic, and Israel.
Source: Goldman Sachs Global Investment Research
We will be focused on two questions. First, has inflation moved convincingly in the direction of the target? This is most clearly the case for Canada and the Czech Republic, where policymakers have already tightened (Exhibit 11). But it also appears to be the case for New Zealand, Sweden, Norway, and Hungary; Israel, Switzerland and Poland have seen more limited evidence of convergence of inflation towards target; Australia falls somewhere in the middle. Second, are domestic imbalances limited enough that the economy could withstand a sustained period of central bank tightening and currency appreciation? While each country has some evidence of imbalances, we think the sturdiest markets are arguably Hungary (which has already gone through a long period of deleveraging), Canada (where the housing market seems to be achieving a soft landing), plus the Czech Republic, Norway, Israel and, perhaps, New Zealand (although high house price inflation poses a downside risk). Putting these groups together, the best opportunities for paying rates and/or expressing currency longs on a sustained basis should be Canada, Norway, Israel, Hungary and New Zealand. That said, we expect all of these central banks (save Switzerland’s) to raise rates during 2019, so each could present tactical opportunities.
15 November 2018 |
14 |

vk.com/id446425943
Goldman Sachs
Global Markets Analyst
Exhibit 11: Core Inflation Approaching Target in Some Markets
pp |
Core Inflation* Relative to Target |
pp |
0.0 |
0.0 |
|
|
|
|
0.0 |
|
0.0 |
|
|
|
|
|
|
|
|
|
|
|
|
-0.2 |
|
|
|
|
|
-0.2 |
-0.4 |
|
-0.3 |
|
|
|
-0.4 |
|
-0.4 |
-0.4 |
-0.4 |
|
||
|
|
|
|
|||
|
|
|
|
|
|
|
-0.6 |
|
|
|
|
|
-0.6 |
-0.8 |
|
|
|
-0.7 |
|
-0.8 |
|
|
|
|
|
||
-1.0 |
|
|
|
|
|
-1.0 |
-1.2 |
|
|
|
|
|
-1.2 |
-1.4 |
|
|
|
|
-1.3 |
-1.4 |
|
|
|
|
|
||
|
|
|
|
|
|
-1.4 |
-1.6 |
|
|
|
|
|
-1.6 |
|
|
|
|
|
|
-1.6 |
-1.8 |
|
|
|
|
|
-1.8 |
Canada |
Czech |
New |
Sweden |
Norway |
Hungary |
Australia |
Israel |
Swizterland Poland |
|
Republic |
Zealand |
|
|
|
|
|
|
*Central banks’ preferred measure.
Source: Haver Analytics, Goldman Sachs Global Investment Research
8. China: A Controlled Easing
nChina’s bumpy slowdown is likely to extend, but the recent deceleration may be too far, too fast for policymakers’ comfort.
nWe expect USD/CNY to breach 7.00 if there is no truce on trade.
nLong CLP or AUD (funded out of CNY or proxies such as KRW) could provide exposure to a stabilization in Chinese activity.
Growth in China slowed sharply in 2018, with our CAI falling by more than 1pp since the start of the year. In addition to the restrictive impulse from monetary, regulatory and credit tightening early in the year, the confidence shock as a result of trade tensions with the US has caused the run-rate of activity to slow to a pace below 6% (based on the preliminary October CAI) (Exhibit 12). In response, the government has eased policy on a number of fronts: reserve rate requirements have been cut and the 7-day repo rate guided lower, the currency has depreciated, the pace of credit contraction appears to have stabilized, fiscal policy may be moving in a more supportive direction and, in recent weeks, a number of high-level policymakers have emphasized the need to ensure funding for the private sector. So even if trade tensions persist or escalate further and trade data start to crack, Chinese policymakers appear to be indicating that growth momentum is decelerating to levels that will soon be unacceptable—even if we are not there yet.
15 November 2018 |
15 |

vk.com/id446425943
Goldman Sachs
Global Markets Analyst
Exhibit 12: Markets have priced a sharp deceleration in China’s growth momentum
% |
|
|
Composite China market-implied growth indicator |
|
% |
||
11 |
|
|
(based on investor sentiment in rates, FX and Equity markets)* |
11 |
|||
|
|
|
|
|
|
||
|
|
|
China CAI |
|
|
|
|
10 |
|
|
(month-over-month annualized, 3mma) |
|
|
10 |
|
|
|
|
|
|
|
||
9 |
|
|
|
|
|
|
9 |
8 |
|
|
|
|
|
|
8 |
7 |
|
|
|
|
|
|
7 |
6 |
|
|
|
|
|
|
6 |
5 |
|
|
|
|
|
|
5 |
4 |
|
|
|
|
|
|
4 |
11 |
12 |
13 |
14 |
15 |
16 |
17 |
18 |
* Specifically, we used CNH 25 delta 1-yr risk reversals, 2-yr forward vs current 6m IRS rate, and the relative performance of "cyclical " vs "defensive" sector in the offshore equity market
Source: Goldman Sachs Global Investment Research
For the year ahead that implies that even as China’s bumpy slowdown extends—and there will be month-to-month volatility—it would be wrong to extrapolate the deceleration we have witnessed. Indeed, for 2019 our economists expect GDP growth to come in at around 6.2%. From a market standpoint, we have argued that USD/CNY was likely to oscillate around the 6.90 level ahead of the Trump-Xi meeting on the sidelines of the G20 later this month, but that the 7.00 level was not sacrosanct and we would envisage a gradual move through that if there is no truce on trade and if Chinese authorities judge that on-shore confidence would not be significantly hit—USD/CNY call spreads may be reasonable structures to express that view.
However, in our view, it would be a mistake to focus on trade alone as a driver of Chinese assets. As our strategists have written, Chinese stocks and corporate credits now embody decent value, and if Chinese growth stabilizes in line with policymakers’ aims on the back of a renewed focus on infrastructure investment, there is likely to be upside here. And currencies such as AUD or CLP—which are exposed to China’s economic activity and commodities—funded out of CNY may provide an interesting relative value expression that avoids direct exposure to further CNY weakness.
9. Emerging Markets: Narrow Path to Performance
nEM asset valuations look more attractive after a challenging 2018, and positive returns seem likely under a modal view of more stable growth in the EM world.
nBut risks from lower growth momentum and higher US rates argue for relative implementations and hedges.
nWe prefer EM equities relative to Europe or Japan, and local rates (and FX) among select high-yielders versus paying low-yielders.
15 November 2018 |
16 |

vk.com/id446425943
Goldman Sachs
Global Markets Analyst
After six months of challenging performance between April and October, combined with currency crises in Argentina and Turkey over the summer, investor sentiment on EM economies and asset markets is negative as we end 2018. Weak growth momentum, trade tensions and higher rates are certainly legitimate grounds for caution. But, in our view, a lot of these concerns are reasonably well discounted in market pricing: (i) EM stocks in local currency terms have fallen 10% from the start of the year, and relative to US stocks are back at their cheapest levels in a decade (Exhibit 13); (ii) on a broad basis, EM FX has given back most of its 2017 gains versus the US Dollar; (iii) EM rates have climbed alongside Treasury yields and the pricing of more US hikes; (iv) market pricing of Chinese growth is edging back toward the low levels of 2015; and (v) EM Dollar sovereign credit has undone all the tightening of last year, and now trades wider than US high-yield, also reminiscent of 2015.
Exhibit 13: Attractive EM Equity Valuations
% |
Relative Valuations: MSCI EM vs S&P 500 |
% |
110 |
|
|
|
|
|
|
|
|
Price/Book |
|
|
Price/Earnings |
|
|
|
|
|
|
|
110 |
|||
100 |
|
|
|
|
|
|
|
|
|
|
|
|
|
|
|
|
|
|
|
|
|
|
100 |
90 |
|
|
|
|
|
|
|
|
|
|
|
|
|
|
|
|
|
|
|
|
|
|
90 |
80 |
|
|
|
|
|
|
|
|
|
|
|
|
|
|
|
|
|
|
|
|
|
|
80 |
70 |
|
|
|
|
|
|
|
|
|
|
|
|
|
|
|
|
|
|
|
|
|
|
70 |
60 |
|
|
|
|
|
|
|
|
|
|
|
|
|
|
|
|
|
|
|
|
|
|
60 |
50 |
|
|
|
|
|
|
|
|
|
|
|
|
|
|
|
|
|
|
|
|
|
|
50 |
40 |
|
|
|
|
|
|
|
|
|
|
|
|
|
|
|
|
|
|
|
|
|
|
40 |
30 |
|
|
|
|
|
|
|
|
|
|
|
|
|
|
|
|
|
|
|
|
|
|
30 |
20 |
|
|
|
|
|
|
|
|
|
|
|
|
|
|
|
|
|
|
|
|
|
|
20 |
95 |
96 |
97 |
98 |
99 |
00 |
01 |
02 |
03 |
04 |
05 |
06 |
07 |
08 |
09 |
10 |
11 |
12 |
13 |
14 |
15 |
16 |
17 |
18 |
Source: Factset, Goldman Sachs Global Investment Research
So the starting point of EM asset valuations is more attractive, and on our modal forecasts of stabilizing growth in the EM world, asset markets should deliver positive total returns. EM equities offer the most upside in terms of expected returns, and in EM local bonds and FX there are spots among high-yielders where the carry and value proposition looks attractive and inflation outcomes are still at or below target (e.g., South Africa or Indonesia). But the path to positive returns is narrow—with risks related to a hard landing in China (and EM) growth and Yuan weakness on the one hand, and risks around a sharper rise in US rates than expected on the other. That said, these risks are partly hedgeable, in our view. Long positions in the Dollar versus the Korean Won (USD/KRW) can be good portfolio hedges. They carry positively and the KRW should depreciate if EM equities come under sustained pressure or China worries escalate through the year. On the fixed income side, the low yields in a number of EM economies—including Hungary, Poland, Thailand or Chile—are increasingly incongruous with rising US rates. Whereas the respective currencies will appreciate or depreciate in
15 November 2018 |
17 |

vk.com/id446425943
Goldman Sachs
Global Markets Analyst
line with EM risk sentiment, rates may move higher both in a benign scenario where policy rates normalize gradually or in a more adverse scenario where pressure on global fixed income hits the bond yields in these low-yielders as well.
Taking a longer-term perspective, it is important to remember that EM assets have offered consistently high Sharpe ratios in a global portfolio despite the drawdowns in 2018 (Exhibit 14). This has manifestly been the case since 2003, a period which encompassed the EM bull market of the 2000s. But even considering the period only since 2016, it is still the case that Sharpe ratios for total returns in EM local bonds and FX have outpaced DM equivalents, and were only modestly lower for equities after the strong run of US equities. Still, 2019 is unlikely to be a “buy and hold” environment given the late-cycle nature of the US, and tactical flexibility will be paramount, especially if US recession concerns come to the fore.
Exhibit 14: Favorable Returns from EM Assets Since 2016 despite the 2018 drawdown
Sharpe Ratio |
Total returns since Jan-2016 (USD) |
% |
|||||
1.4 |
14 |
||||||
|
|
EM |
|
DM |
|||
|
|
|
|
|
|||
|
|
|
|
|
|||
1.2 |
|
|
12 |
1.0 |
|
Sharpe Ratios (LHS) |
10 |
|
|
|
|
|
|
(Return-to-vol) |
|
0.8 |
|
|
8 |
0.6 |
|
|
6 |
0.4 |
|
|
4 |
0.2 |
|
|
2 |
0.0 |
|
|
0 |
-0.2 |
|
|
-2 |
Equities |
Local bonds |
Local bonds USD-hedged |
FX |
Source: Bloomberg, Goldman Sachs Global Investment Research |
|
|
|
10. Commodities: Asynchronous Supply Cycles
nLate-cycle commodity outperformance remains a valid theme and diversifier for portfolios.
nDifferent supply trajectories mean upside in copper and flat oil prices over 12 months, supporting terms of trade for Chile and Peru, and less pressure on oil importers such as India.
The sharp sell-off in oil prices over the past month means that commodities have failed to produce typical late-cycle outperformance. However, with the more mature US
15 November 2018 |
18 |
vk.com/id446425943
Goldman Sachs
Global Markets Analyst
recovery and our forecasts for EM to gradually close the growth gap with DM, our commodity strategists expect commodity prices to rally off this trough and forecast the Enhanced S&P GSCI index® to have high single-digit returns over the next 12 months.
However, we see important differences under the surface. In the case of oil, the near-term rebound in prices that we expect—as speculative positioning re-adjusts, Iran exports decline and EM demand recovers—only postpones a sequential decline in Brent prices back to $65/bbl by end-2019 as a wave of new Permian production comes online, pipeline constraints are eased, and OPEC spare capacity is created. But we expect the oil curve to return to backwardation and offer investors positive carry in a rangebound price environment. By contrast, in the case of copper, while current market sentiment is downbeat, not only do current fundamentals remain solid with healthy Chinese demand and falling global inventories (Exhibit 15), we are also more optimistic over the long term as EM demand recovers and the lack of large-scale greenfield projects translates into a deficient market further out. As a result, we see upside to copper prices both on the 3- and 12-month horizon.
Exhibit 15: We See Upside for Copper Prices as EM Demand Recovers
kt
1,000
900
800
700
600
500
400
300
200
100
|
|
|
Copper Inventory on Exchange and Copper Price |
|
|
|
$/t |
||||
|
|
|
|
LME |
SHFE |
COMEX |
|
|
|
|
7,000 |
|
|
|
|
Copper price |
6,950 $/t (RHS) |
|
|
|
|
|
|
|
|
|
|
|
|
|
|
|
|
|
6,800 |
|
|
|
|
|
|
|
|
|
|
|
6,600 |
|
|
|
|
|
|
|
|
|
|
|
6,400 |
|
|
|
|
|
|
|
|
|
|
|
6,200 |
|
|
|
|
|
|
|
|
|
Copper price |
6,000 |
|
|
|
|
|
|
|
|
|
|
5,992 |
$/t |
|
|
|
|
|
|
|
|
|
|
|
|
5,800 |
Jan |
Feb |
Mar |
Apr |
May |
Jun |
Jul |
Aug |
Sep |
Oct |
|
Nov |
|
|
|
|
|
2018 |
|
|
|
|
|
|
Source: Bloomberg, Goldman Sachs Global Investment Research
Taken together, these forecasts suggest a boost in terms of trade over the next 12 months for metals exporters such as Chile and Peru (Exhibit 16), and less pressure on major oil importers such as India and Philippines. Among oil producers, terms of trade for Canada may outperform the rest of the oil-producing complex as the Western Canada Select (WCS) crude price bounces back and the WTI-WCS spread narrows.
15 November 2018 |
19 |

vk.com/id446425943
Goldman Sachs
Global Markets Analyst
Exhibit 16: Commodity Outlook More Positive for Canada, Chile and Peru
Predicted % change in GS commodity TOT over next 12m
15 |
|
|
|
|
|
|
|
10 |
CLP |
|
|
|
|
|
|
|
|
|
|
|
|
|
|
|
Postive commodity |
PEN |
|
|
|
|
|
|
|
|
|
|
|
|
|
5 |
price outlook |
|
|
|
|
|
|
|
|
|
|
|
|
|
|
|
CAD |
ZAR |
|
|
|
|
|
|
|
|
|
MXN |
|
|
|
0 |
|
|
|
|
|
|
|
|
NZD |
|
|
|
COP |
|
|
|
|
BRL |
IDR |
|
|
||
|
|
|
|
|
|||
|
|
|
|
|
MYR |
|
|
-5 |
Negative commodity |
|
|
|
|
|
|
price outlook |
|
|
|
|
|
RUB |
|
|
|
|
|
|
AUD |
|
|
|
|
|
|
|
|
|
|
|
|
|
|
|
|
NOK |
|
-10 |
|
|
|
|
|
|
|
-15 |
-10 |
-5 |
|
0 |
5 |
10 |
15 |
Actual % change in GS commodity TOT over past 12m
Source: Bloomberg, Goldman Sachs Global Investment Research
Other disclosures
All MSCI data used in this report is the exclusive property of MSCI, Inc. (MSCI). Without prior written permission of MSCI, this information and any other MSCI intellectual property may not be reproduced or redisseminated in any form and may not be used to create any financial instruments or products or any indices. This information is provided on an “as is” basis, and the user of this information assumes the entire risk of any use made of this information. Neither MSCI, any of its affiliates nor any third party involved in, or related to, computing or compiling the data makes any express or implied warranties or representations with respect to this information (or the results to be obtained by the use thereof), and MSCI, its affiliates and any such third party hereby expressly disclaim all warranties of originality, accuracy, completeness, merchantability or fitness for a particular purpose with respect to any of this information. Without limiting any of the foregoing, in no event shall MSCI, any of its affiliates or any third party involved in, or related to, computing or compiling the data have any liability for any direct, indirect, special, punitive, consequential or any other damages (including lost profits) even if notified of the possibility of such damages. MSCI and the MSCI indexes are service marks of MSCI and its affiliates. The Global Industry Classification Standard (GICS) were developed by and is the exclusive property of MSCI and Standard & Poor’s. GICS is a service mark of MSCI and S&P and has been licensed for use by The Goldman Sachs Group.
15 November 2018 |
20 |