

GS Natural Gas_watermark
.pdfvk.com/id446425943
15 November 2018 | 4:51AM EST
Natural Gas: Long term surpluses finally create near-term (financial and physical) shortages
1.We have long argued that the US natural gas market can be characterized by oversupplied forward balances that suppressed long-dated natural gas prices which, in turn, created modestly more near-term demand at the margin that put upward pressure on near-term prices. We termed this ‘long-term surpluses create near-term shortages’. This dynamic supported a backwardated natural gas forward curve, which is a rare occurrence in a market with a natural proclivity to contango (see Exhibit 1). This idea of long-term surpluses creating near-term shortages was stable as long as the market was always able to bridge the gap between a tighter today and an oversupplied tomorrow. However, this all changed in September when near-term fundamentals began to tighten in a relentless pattern, leaving end-summer inventories at their lowest levels since 2005 as the winter weather began to set in (see Exhibit 2).
2.A combination of late summer heat, nuclear outages, hurricane disruptions, pipeline delays and now a burst of early cold weather has left inventories at critically low levels just as the winter begins. And early cold weather is far more concerning than late cold weather (like the polar vortex in 2014 was) as it creates more uncertainty early in the season. While we still believe the market can bridge the gap between the tightness of today and the oversupply in 2019, the recent tightening of the balance means that a higher winter gas price is now required to accomplish that and price in the increased risk of an inventory stock-out. Accordingly, we raise our winter 2018/19 gas price forecast to of $3.60/mmBtu from $3.00/mmBtu previously, assuming normal weather from December 2018. We see price risks still skewed to the upside near term, but quickly shifting to the downside should cold weather not materialize as demand destruction has likely already started to occur near current prices of $4.80/mmBtu.
3.Due to positioning, natural gas prices have likely overshot to the upside as short positions were unwound. This idea of long-term surpluses creating near-term shortages also applies to the financial markets as well by creating misaligned positioning. A favorite way to implement the oversupplied forward balances was to be short March 2019 versus long April 2019. The idea was as Northeast production continued to increase this winter to meet rising demand, the storage deficit would narrow and time spreads would weaken (the natural proclivity for the natural gas forward curve). As the odds of this happening declined with recent cold weather forecasts, these positions betting on forward surpluses needed to be unwound, creating a sharp rise in near-dated contracts. As a result, the contract that moved the
Jeffrey Currie
+1(212)357-6801 | jeffrey.currie@gs.com Goldman Sachs & Co. LLC
Damien Courvalin
+1(212)902-3307 | damien.courvalin@gs.com Goldman Sachs & Co. LLC
Huan Wei
+1(212)357-2353 | huan.wei@gs.com Goldman Sachs & Co. LLC
Christian Lelong
+1(212)934-0799 | christian.lelong@gs.com Goldman Sachs & Co. LLC
Investors should consider this report as only a single factor in making their investment decision. For Reg AC certification and other important disclosures, see the Disclosure Appendix, or go to www.gs.com/research/hedge.html.

vk.com/id446425943
Goldman Sachs
most on the natural gas forward curve was March 2019 (see Exhibit 3), the contract that was likely the most short.
4.Nonetheless, despite the overshoot in prices, it is important to highlight that the fundamental picture has tightened significantly in the past several weeks. Specifically, we estimate that a record-warm September, 19% hotter than the 10-year average, increased power burns by more than 1.5 Bcf/d in the period, which was further exacerbated by a 5 GW net drop in nuclear generation in the Mid-Atlantic region (worth approximately 1 Bcf/d of gas demand) owing to precautionary shut downs ahead of Hurricane Florence. On the supply side, significant take-away capacity out of the Northeast expected to start this summer was delayed, including sections of the massive Rover pipeline (3.2 Bcf/d) and Atlantic Sunrise (1.7 Bcf/d). This slowed the pace of Northeast production growth relative to what had been expected, contributing to the tighter balance we see currently in the market. Last, but not least, the realized and forecast weather deviation thus far in November, 22% colder than average, will likely remove another 165 Bcf from storage as it lifts heating-related demand (see Exhibit 4).
5.As a result of this tightening and cold start to the winter we are raising our winter 2018/19 natural gas price forecast $3.60/mmBtu from $3/mmBtu, which we believe is consistent with enough of a reduction in C2G substitution (-1.2 Bcf/d) to keep end-March storage at manageable levels around 1.5 Tcf. Interestingly, we estimate it would take a two-standard-deviation (2.5% probability) cold event to move end-March inventories below the 837 Bcf post-polar vortex levels observed in 2014. Should that happen, we believe natural gas prices would quickly move above $6/mmbtu to trigger other adjustment levers, such as lower LNG off-take. High transportation costs have already shrunk the margin on US sales to Europe and Asia, and a further increase in the cost of feed gas would eventually drive the utilization rate of US liquefaction lower.
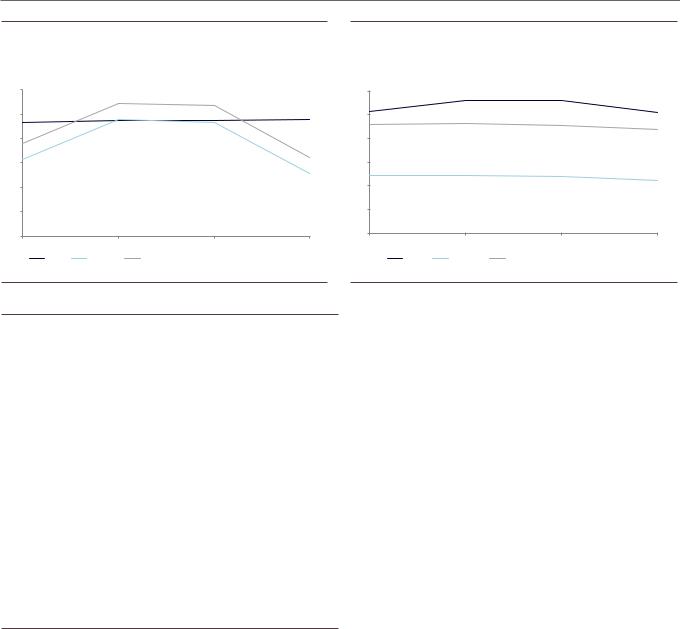
6.To be clear, LNG exports from Cove Point are already out of the money for January and February (see Exhibit 5). Although the 700 mmcf/d facility is too small to provide meaningful relief, it can be an important case study of the demand response to the shutting of the export arb. Meanwhile, Gulf Coast exports have a significantly higher nominal capacity at 3 Bcf/d, including four trains at Sabine Pass and the first Corpus
Christi train, which is expected to be inaugurated today, November 15th. At current prices LNG exports from the Gulf are still economic to flow (see Exhibit 6), with off-takers incentivized to consider rejecting Sabine cargoes should NYMEX move consistently above $6/mmBtu. We believe the price required for Cheniere’s own spot sales to halt would be higher, however, likely in the $7-$8/mmBtu range, as some of the costs that are of a variable nature to off-takers may be sunk costs for the terminal owner, such as pipeline transport fees. It is important to emphasize that during the polar vortex in 2014, LNG imports were zero, so this new release valve takes a lot of historical upside volatility out of gulf coast pricing locations.
7. Despite the very near-term potential for a tight market, the oversupplied forward balance is still a feature of the market and likely to remain so which is why even the April 2019 contract is still below $3/mmBtu. We maintain our long-dated natural gas price forecast of $2.75/mmBtu as the current market is only dealing with a delivery bottleneck that can be compensated for in a rather short time frame, not a structural shift. While
15 November 2018 |
2 |

vk.com/id446425943
Goldman Sachs
we believe that positioning and short covering likely caused prices to overshoot to the upside, given the shape of the forward curve, this current rally would be difficult to fade, as to do so would require shorting this winter against record low stocks and sharp backwardation. And fighting carry is rarely an advisable strategy.
The authors would like to thank Samantha Dart for her contribution to this report.
Exhibit 1: This dynamic supported a backwardated forward curve, a rare occurrence in a market with a natural proclivity to contango
Henry Hub 1st vs. 12th futures contract, $/mmbtu
3 |
|
|
|
|
|
|
|
|
|
|
2 |
|
|
|
|
|
|
|
|
|
|
1 |
|
|
|
|
|
|
|
|
|
|
0 |
|
|
|
|
|
|
|
|
|
|
-1 |
|
|
|
|
|
|
|
|
|
|
-2 |
|
|
|
|
|
|
|
|
|
|
-3 |
|
|
|
|
|
|
|
|
|
|
-4 |
|
|
|
|
|
|
|
|
|
|
2008 |
2009 |
2010 |
2011 |
2012 |
2013 |
2014 |
2015 |
2016 |
2017 |
2018 |
Exhibit 2: This all changed in September when near-term fundamentals began to tighten, leaving end-summer inventories at their lowest levels since 2005
Weekly lower 48 states natural gas working underground storage, Bcf
4500 |
|
|
|
|
|
|
|
|
|
|
|
4000 |
|
|
|
|
|
|
|
|
|
|
|
3500 |
|
|
|
|
|
|
|
|
|
|
|
3000 |
|
|
|
|
|
|
|
|
|
|
|
2500 |
|
|
|
|
|
|
|
|
|
|
|
2000 |
|
|
|
|
|
|
|
|
|
|
|
1500 |
|
|
|
|
|
|
|
|
|
|
|
1000 |
|
|
|
|
|
|
|
|
|
|
|
500 |
|
|
|
|
|
|
|
|
|
|
|
0 |
|
|
|
|
|
|
|
|
|
|
|
Jan |
Feb |
Mar |
Apr |
May |
Jun |
Jul |
Aug |
Sep |
Oct |
Nov |
Dec |
|
2018 |
|
2017 |
|
2016 |
|
2015 |
|
2014 |
|
2013 |
Source: CME |
Source: EIA |
Exhibit 3: The contract that moved the most on the natural gas forward curve was March 2019
Henry Hub futures since Nov 6, 2018, indexed to 1
1.45 |
1.40 |
1.35 |
1.30 |
1.25 |
1.20 |
1.15 |
1.10 |
1.05 |
1.00 |
0.95 |
Prompt month |
|
Jan19 contract |
|
Feb19 contract |
|
Mar19 contract |
|
|
|
Exhibit 4: The realized and forecast weather deviation thus far in November, is 22% colder than average
Heating Degree Days, realized vs forecast
30.0 |
|
|
|
|
|
|
|
|
|
|
25.0 |
|
|
|
|
|
|
|
|
|
|
20.0 |
|
|
|
|
|
|
|
|
|
|
15.0 |
|
|
|
|
|
|
|
|
|
|
10.0 |
|
|
|
|
|
|
|
|
|
|
5.0 |
|
|
|
|
|
|
|
|
|
|
0.0 |
|
|
30-Oct 1-Nov 3-Nov |
5-Nov |
7-Nov |
9-Nov 11-Nov 13-Nov |
|
|
|
|
20-Oct |
22-Oct 24-Oct 26-Oct |
28-Oct |
15-Nov |
17-Nov 19-Nov 21-Nov |
23-Nov |
25-Nov 27-Nov 29-Nov |
||||
|
2018/19 |
|
Current fcast |
|
|
Fcast 11/12 |
|
Last year |
|
10yr ave |
Source: CME |
Source: Earthsat |
15 November 2018 |
3 |
vk.com/id446425943
Goldman Sachs
Exhibit 5: LNG exports from Cove Point are already out of the money for January and February
Variable cost to deliver Cove Point LNG to Europe vs NBP, $/mmbtu
12 |
|
|
|
10 |
|
|
|
8 |
|
|
|
6 |
|
|
|
4 |
|
|
|
2 |
|
|
|
0 |
|
|
|
Dec-18 |
Jan-19 |
Feb-19 |
Mar-19 |
NBP |
Z6 NNY |
Variable cost to deliver Cove Point LNG to Europe |
|
Source: Platts, Bloomberg
Exhibit 7: GS Henry Hub price forecast $/mmbtu
|
GS Forecast |
Forward as 11/14 |
4Q18 |
3.50 |
3.94 |
1Q19 |
3.60 |
4.04 |
2Q19 |
2.75 |
2.75 |
3Q19 |
2.75 |
2.74 |
4Q19 |
2.75 |
2.92 |
1Q20 |
2.75 |
2.79 |
2Q20 |
2.75 |
2.53 |
3Q20 |
2.75 |
2.58 |
4Q20 |
2.75 |
2.79 |
1Q21 |
2.75 |
2.70 |
2Q21 |
2.75 |
2.49 |
3Q21 |
2.75 |
2.54 |
4Q21 |
2.75 |
2.76 |
2019 |
2.96 |
3.11 |
2020 |
2.75 |
2.67 |
2021 |
2.75 |
2.62 |
Exhibit 6: At current prices LNG exports from the Gulf are still economic to flow
Variable cost to deliver USGC LNG to Asia vs JKM, $/mmbtu
12 |
|
|
|
10 |
|
|
|
8 |
|
|
|
6 |
|
|
|
4 |
|
|
|
2 |
|
|
|
0 |
|
|
|
Dec-18 |
Jan-19 |
Feb-19 |
Mar-19 |
JKM |
NYMEX |
Variable cost to deliver USGC LNG to Asia |
|
Source: Platts, Bloomberg
Source: Bloomberg
15 November 2018 |
4 |