

GS Metals Express_watermark
.pdfvk.com/id446425943
14 November 2018 | 6:59PM GMT
Metals Express: What copper demand revisions in 2018 tell us about 2019
Market comment: China may be bumpy, but negative sentiment priced in: Our economists have put out their 2019 global growth outlook. With data staying soft and the market waiting for the Trump-Xi meeting at the G20 in Buenos Aires on November 30, China is likely to be a source of volatility in the near term. At the CESCO Asia in Shanghai this week, sentiment remains cautious, if not bearish, among producers, trading houses and investors. Downside risk to the Chinese property market is top of mind for onshore investors. That said, we think current price levels have already reflected such negative sentiment. In an environment where the actual impact of tariffs on growth is manageable and the Chinese government is likely to boost infrastructure spending to offset the weakness elsewhere in the economy, we expect industrial metals to move higher in 2019.
Focus:Tracking copper demand revisions in 2018: Each month estimates for regional commodity consumption are released, often with revisions applied to the previous month’s figures. When our colleagues looked at revisions to oil consumption growth, they found it broadly in line with surprises in regional economic growth. In performing the same exercise for copper, we find this is not the case and instead a multitude of region-specific factors tend to drive these revisions. Our finding suggests that the 2019 growth slowdown expected by our economists for the US and China may not necessarily translate into significantly weaker metals demand in these countries.
What copper demand revisions in 2018 tell us about 2019
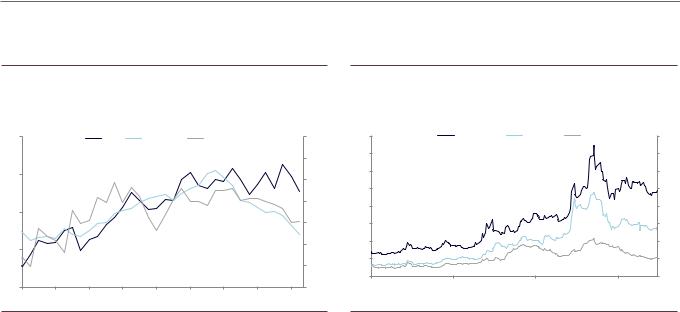
2018 has featured a divergence between the US and ex-US, with US growth robust while the rest of the world is lagging. This is visible through manufacturing PMI data which shows US outperformance relative to other DM countries and China (Exhibit 1). With the Fed hiking and US dollar strengthening, many of the EM ex-China countries have faced a particularly challenging year (Exhibit 2).
Looking ahead into 2019, our economists expect global growth to be healthy but project a notable deceleration in both the US and China. As commodity consumption tends to be driven by economic performance, these dynamics could have important implications for commodity consumption growth. We explore the experience of 2018
Anna Zandi
+44(20)7552-9350 | anna.zandi@gs.com Goldman Sachs International
Hui Shan
+1(212)902-4447 | hui.shan@gs.com Goldman Sachs & Co. LLC
Mikhail Sprogis
+44(20)7774-2535 | mikhail.sprogis@gs.com Goldman Sachs International
Jeffrey Currie
+1(212)357-6801 | jeffrey.currie@gs.com Goldman Sachs & Co. LLC
Investors should consider this report as only a single factor in making their investment decision. For Reg AC certification and other important disclosures, see the Disclosure Appendix, or go to www.gs.com/research/hedge.html.
vk.com/id446425943
Goldman Sachs
to draw lessons for 2019. We find that the link between GDP growth and metals demand can be broken down by region-specific and idiosyncratic factors.
Exhibit 1: US outperformance reflected through manufacturing PMI data
Exhibit 2: Many EM ex-China countries have had a particularly challenging year
Index |
|
|
Manufacturing PMI |
|
|
Index |
bps |
Spreads on 5-Year Credit Default Swaps |
bps |
||||
|
|
|
|
|
|
||||||||
65 |
|
|
US |
Euro Area |
|
China (RHS) |
54 |
900 |
Argentina |
Turkey |
Brazil |
900 |
|
|
|
|
|
|
|
|
|
53 |
800 |
|
|
|
800 |
|
|
|
|
|
|
|
|
|
|
|
|
|
|
60 |
|
|
|
|
|
|
|
52 |
700 |
|
|
|
700 |
|
|
|
|
|
|
|
|
|
|
|
|
||
|
|
|
|
|
|
|
|
600 |
|
|
|
600 |
|
|
|
|
|
|
|
|
|
|
|
|
|
||
|
|
|
|
|
|
|
|
51 |
500 |
|
|
|
500 |
55 |
|
|
|
|
|
|
|
|
|
|
|
||
|
|
|
|
|
|
|
|
|
|
|
|
|
|
|
|
|
|
|
|
|
|
50 |
400 |
|
|
|
400 |
50 |
|
|
|
|
|
|
|
49 |
300 |
|
|
|
300 |
|
|
|
|
|
|
|
|
|
|
|
|
||
|
|
|
|
|
|
|
|
200 |
|
|
|
200 |
|
|
|
|
|
|
|
|
|
48 |
|
|
|
||
|
|
|
|
|
|
|
|
|
|
|
|
|
|
|
|
|
|
|
|
|
|
|
100 |
|
|
|
100 |
45 |
|
|
|
|
|
|
|
47 |
Jan-18 |
Apr-18 |
Jul-18 |
|
Oct-18 |
Jan-16 |
May-16 |
Sep-16 |
Jan-17 |
May-17 |
Sep-17 |
Jan-18 |
May-18 |
Sep-18 |
|
|
|
|
|
Source: Haver Analytics |
Source: Bloomberg |
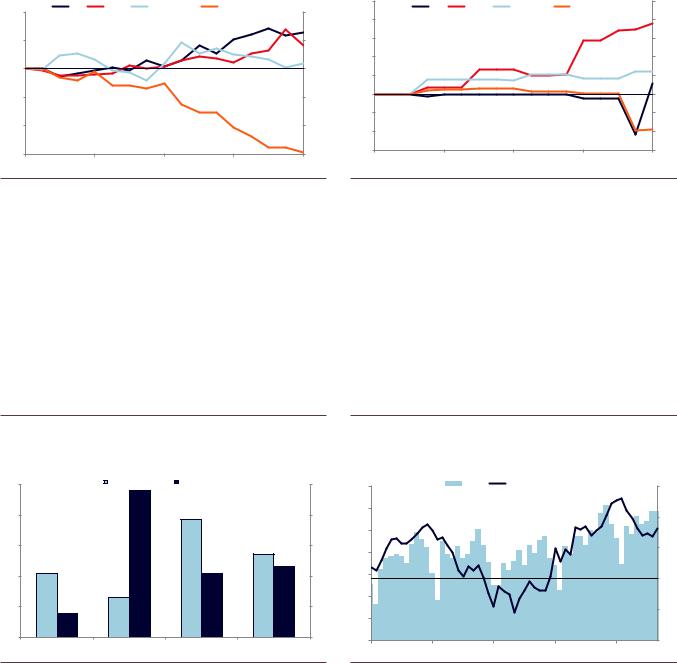
To examine the impact of economic performance on commodity consumption, we assess revisions made to oil and copper consumption growth starting in June 2017. When our colleagues conducted this analysis for oil in their piece, they found regional economic performance largely tracks changes in consumption growth for oil. Namely, the US was revised up and EM ex-China revised down for oil consumption growth in 2018 as US growth surprised to the upside and EM ex-China surprised to the downside (Exhibit 3). They did note that China oil demand has been strong this year despite concerns about trade tensions and growth slowdown. Also, the downward revisions to EM ex-China consumption growth were overstated due to destocking, which resulted in seemingly weak demand in their view.
The story is quite different for copper. In conducting a similar exercise for copper, we find that the US and EM Ex-China consumption growth remained largely unrevised for most of 2018 despite the surprises in realized economic growth. The largest changes were made for China, which continued to be revised up in recent months when economic growth clearly slowed on tight credit and uncertainties originating from the US-China trade disputes. (Note the significant revision downward and subsequent revision upward for the US is attributed to an overly bearish view on US semis production in September, corrected in October.)
14 November 2018 |
2 |
vk.com/id446425943 |
|
|
|
|
|
|
||
Goldman Sachs |
|
|
|
|
|
|
||
|
|
|
|
|
|
|
|
|
|
Exhibit 3: Revisions to oil demand growth dominated by the US and |
Exhibit 4: ...while China dominates revisions for copper |
|
|
||||
|
Non-OECD ex-China... |
|
|
|
|
|
|
|
|
kbd |
Revision of yoy crude oil consumption growth 2017-2018 |
kbd |
|
kt |
Revision of yoy copper consumption growth 2017-2018 |
kt |
|
|
|
|
|
|
|
|
||
|
US |
China |
OECD ex-US |
Non-OECD ex-China |
|
250 |
US |
China |
DM ex-US |
EM Ex-China |
250 |
400 |
400 |
|
|
||||||||
|
|
|
|
200 |
|
|
|
|
200 |
||
|
|
|
|
|
|
|
|
|
|
||
200 |
|
|
|
|
200 |
150 |
|
|
|
|
150 |
|
|
|
|
|
|
100 |
|
|
|
|
100 |
0 |
|
|
|
|
0 |
50 |
|
|
|
|
50 |
|
|
|
|
|
|
|
|
|
|
||
-200 |
|
|
|
|
-200 |
0 |
|
|
|
|
0 |
|
|
|
|
|
|
|
|
|
|
||
|
|
|
|
|
|
-50 |
|
|
|
|
-50 |
-400 |
|
|
|
|
-400 |
-100 |
|
|
|
|
-100 |
|
|
|
|
|
|
|
|
|
|
||
-600 |
|
|
|
|
-600 |
-150 |
|
|
|
|
-150 |
|
|
|
|
Jun-17 |
Oct-17 |
|
Feb-18 |
Jun-18 |
Oct-18 |
||
Jun-17 |
|
Oct-17 |
Feb-18 |
Jun-18 |
Oct-18 |
|
|||||
|
|
|
|
|
|
|
Source: IEA, Goldman Sachs Global Investment Research |
Source: Wood Mackenzie, Goldman Sachs Global Investment Research |
The reason why copper consumption growth does not appear consistent with economic performance can be explained in part by the dynamics driving US and China copper consumption as well as data quality issues. Starting with the US, while it accounts for 21% of global oil demand, its share of global copper consumption is only 8% (Exhibit 5). This is because copper consumption is measured at the stage converting copper cathodes into copper semis products and the US does not have many semis manufacturing facilities. As a result, strong US growth translates into increased imports of copper-containing products rather than measured copper consumption. Evidence of this can be seen through Exhibit 6 below, which shows robust growth in US imports of finished goods such as machinery and equipment this year.
Exhibit 5: Regional share of consumption differs for oil and copper |
Exhibit 6: US imports of copper-containing finished goods have |
|
been steadily rising |
%Share of global commodity consumption by region
50 |
Crude Oil |
Refined Copper |
|
40 |
|
|
|
30 |
|
|
|
20 |
|
|
|
10 |
|
|
|
0 |
|
|
|
US |
China |
DM ex-US |
EM ex-China |
% |
$bil |
US machinery and equipment imports |
% |
||
50 |
70 |
Level |
|
YoY % Chg (3mma, RHS) |
15 |
40 |
65 |
|
|
|
10 |
|
|
|
|
||
|
60 |
|
|
|
|
30 |
55 |
|
|
|
5 |
|
|
|
|
|
|
20 |
50 |
|
|
|
0 |
|
|
|
|
|
|
|
45 |
|
|
|
|
10 |
|
|
|
|
-5 |
|
40 |
|
|
|
|
|
|
|
|
|
|
0 |
35 |
|
|
|
-10 |
|
|
|
|
||
|
2014 |
2015 |
2016 |
2017 |
2018 |
Source: IEA, Wood Mackenzie, Goldman Sachs Global Investment Research |
Source: Haver Analytics, Goldman Sachs Global Investment Research |
On the other hand, upward revisions to China copper consumption appear to be policy driven. First, increased China copper consumption was borne in part from scrap market tightness. In 2018, policies were implemented banning the import of type 7 copper scrap and waging a 25% tariff on US scrap imports to China. As explored in our previous research, this combined with insufficient domestic copper scrap forced semi-fabricators to use more refined copper instead of scrap. Second, there is evidence of China
14 November 2018 |
3 |

vk.com/id446425943
Goldman Sachs
front-loading ahead of the imposition of US tariffs, contributing to the stronger-than-expected copper consumption in recent months.
Lastly, the absence of revisions to EM ex-China copper consumption despite its economic underperformance can be attributed to poor data quality, similar to oil. Issues such as the lack of timely data muddle the EM ex-China demand picture, which helps explain why we only see downward revisions most recently.
Taken together, we see the link between GDP growth and commodity consumption as more nuanced for copper than for oil. If US growth were to slow as anticipated by our economists, oil consumption growth could as well. For copper, a slowdown in the US will likely have little impact on refined copper consumption given its small share of the global market, but it could reduce other countries’ copper consumption through lower import demand for copper-containing goods. Furthermore, although China deceleration will negatively affect demand, policies matter and the scrap ban could continue to support refined consumption demand. We could also see potential upside coming from infrastructure spending in China, which tends to be more copper intensive.
Forecast Summary
Exhibit 7: Metals forecast table
Cash Price, Actual and GS Forecast
|
|
Metal |
Unit |
2016 |
2017 |
2018E |
2019E |
2020E |
3m |
6m |
12m |
|
|
|
|
|
Copper |
$/tonne |
4,862 |
6,166 |
6,550 |
6,885 |
7,023 |
6,500 |
7,000 |
7,000 |
|
|
|
|
|
|
|
|
||||||||||
|
|
Nickel |
$/tonne |
9,606 |
10,405 |
14,065 |
17,250 |
17,250 |
15,000 |
16,000 |
18,000 |
|
|
|
|
|
Aluminum |
$/tonne |
1,605 |
1,968 |
2,196 |
2,075 |
2,000 |
2,300 |
2,200 |
2,000 |
|
|
|
|
|
Zinc |
$/tonne |
2,094 |
2,893 |
3,024 |
2,975 |
2,700 |
3,000 |
3,300 |
2,800 |
|
|
|
|
|
Iron Ore |
$/tonne |
58 |
71 |
68 |
63 |
60 |
60 |
70 |
62 |
|
|
|
|
|
|
|
|
|
|
|
|
|
|
|
|
|
|
|
|
|
|
|
|
|
|
|
|
|
|
|
|
|
Source: Goldman Sachs Global Investment Research
14 November 2018 |
4 |