

GS A TMT investor s guide to Growth and Value_watermark-1
.pdfvk.com/id446425943
Goldman Sachs
Valuation dispersion: How far is too far?
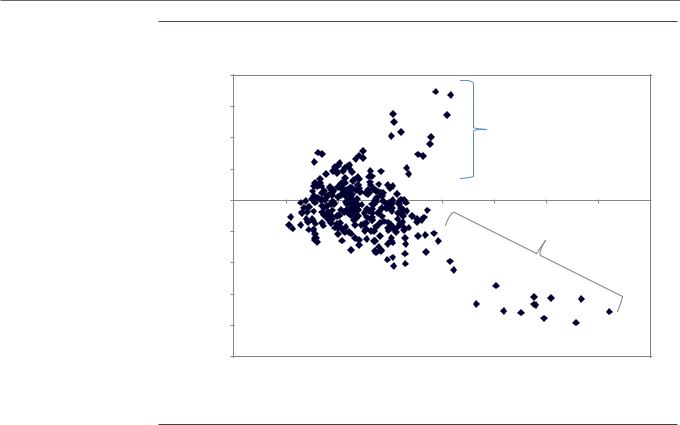
The exceptional recent outperformance of TMT Growth stocks has caused investors to ask what the largest valuation premium is that Growth stocks can achieve relative to Value stocks before their outperformance must end.
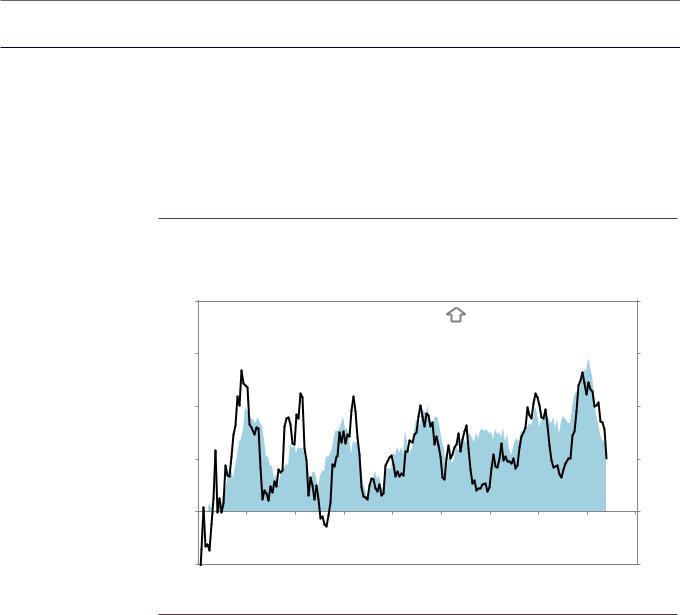
While valuation multiples have expanded across S&P 500 TMT this cycle, the spread between high valuation and low valuation stocks has risen to the highest level since 2000. The 80th percentile TMT stock currently trades at an EV/sales multiple of 7x compared to just 2x for the 20th percentile stock. This divergence exists across a range of valuation multiples, and high growth stocks have been the prime beneficiaries. Combining P/B, P/E, EV/sales, EV/EBITDA, and free cash flow yield, TMT Growth stocks currently trade at valuation multiples on average 240% larger than the multiples of Value stocks. This represents a sharp expansion from the 100% premium at the start of 2017 and is the largest in recent history outside of the Tech Bubble.
Exhibit 15: Dispersion of TMT multiples is widest since 2000 |
Exhibit 16: TMT Growth stocks trade with an especially large |
|
valuation premium |
|
Premium reflects median across P/B, P/E, EV/Sales, EV/EBITDA, and |
|
FCF yield |
16x |
|
|
|
|
|
400 % |
|
|
|
|
|
|
|
|
|
|
|
|
|
350 % |
|
360% |
|
|
|
|
|
14x |
|
|
|
S&P 500 TMT |
|
|
Valuation premium of TMT |
|
|||||
|
|
|
|
|
|
|
|
||||||
|
|
|
|
|
|
|
|
Growth vs. Value |
|
|
|||
12x |
|
|
EV/sales multiples |
300 % |
|
|
|
|
|
||||
|
|
|
|
|
|
|
|
|
|||||
10x |
|
|
|
|
|
250 % |
|
|
|
|
|
240% |
|
|
|
|
|
|
|
|
|
|
|
|
|
||
8x |
|
|
|
|
|
200 % |
|
|
|
|
|
|
|
|
|
|
|
|
|
|
|
|
|
|
|
|
|
|
|
|
|
|
80th %ile |
150 % |
|
|
|
|
|
|
|
6x |
|
|
|
|
|
|
|
|
|
|
Avg = |
|
|
|
|
|
|
|
|
|
|
|
|
|
|
||
|
|
|
|
|
|
100 % |
|
|
|
|
|
130% |
|
4x |
|
|
|
|
|
|
|
|
|
|
|
|
|
|
|
|
|
|
|
|
|
|
|
|
|
|
|
2x |
|
|
|
|
|
50 % |
|
|
|
|
|
|
|
|
|
|
|
|
|
|
|
|
|
|
|
|
|
|
|
|
|
|
20th %ile |
0 % |
|
|
|
|
|
|
|
0x |
|
|
|
|
|
|
|
|
|
|
|
|
|
1995 |
2000 |
2005 |
2010 |
2015 |
1990 |
1995 |
2000 |
2005 |
2010 |
2015 |
2020 |
2025 |
|
1990 |
2020 |
|
|
|
|
|
|
|
|||||
Source: Compustat, Goldman Sachs Global Investment Research |
Source: Compustat, I/B/E/S, Goldman Sachs Global Investment Research |
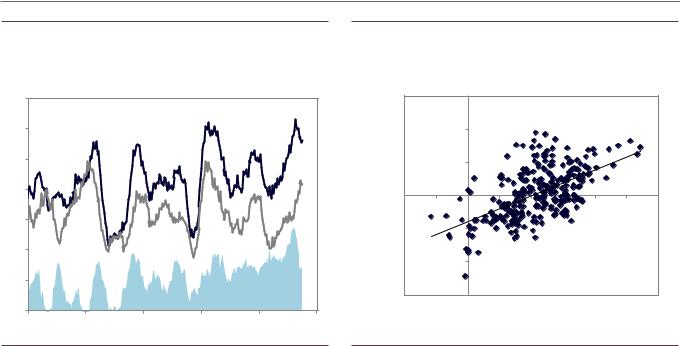
While Growth stocks currently carry extremely elevated multiples relative to their history, valuations have provided little signal for forward Growth vs. Value performance in the past. Excluding the period from 1998 through 2001, valuations have explained just 3% of the variation in Growth vs. Value returns over rolling 12-month periods since 1990.
3 December 2018 |
11 |
vk.com/id446425943
Goldman Sachs
Exhibit 17: Weak relationship between valuations and forward returns
|
80 % |
|
|
|
|
|
|
|
|
return |
60 % |
|
|
|
|
|
|
|
|
40 % |
|
|
|
|
1998-1999 |
|
|
||
12m |
|
|
|
|
|
|
|
|
|
20 % |
|
|
|
|
|
|
|
|
|
forward |
|
|
|
|
|
|
|
|
|
0 % |
|
|
|
|
|
|
|
|
|
Value |
(20)% |
|
|
|
|
|
2000-2001 |
|
|
vs. |
(40)% |
|
|
|
|
|
|
|
|
Growth |
|
|
|
|
|
|
|
|
|
(60)% |
|
|
|
|
|
|
|
|
|
|
TMT Growth vs. Value |
|
|
|
|
|
|||
|
|
|
|
|
|
|
|||
|
(80)% |
Relative valuation vs. |
|
|
|
|
|
||
|
|
forward 12m relative return |
|
|
|
|
|||
|
(100)% |
|
|
|
|
|
|
|
|
|
0% |
50% |
100% |
150% |
200% |
250% |
300% |
350% |
400% |
Valuation premium of Growth vs. Value
Source: Goldman Sachs Global Investment Research
3 December 2018 |
12 |
vk.com/id446425943
Goldman Sachs
Earnings drive Growth vs. Value performance
From a micro perspective, earnings growth is the clearest and most intuitive determinant of whether Growth or Value stocks outperform. Exhibit 19 shows the share of Growth and Value stocks experiencing positive revisions to consensus FY2 EPS estimates. Although revisions generally improve for Growth and Value stocks at the same time, the relative strength of revisions is a key driver of relative performance. Continuing the historical relationship, the recent weakness of TMT Growth stock prices has coincided with a decline in Growth stock revision strength relative to Value stocks.
Exhibit 18: Growth vs. Value EPS revisions and relative performance
Revision strength calculated as share of Growth stocks with positive FY2 EPS revisions less share of Value stocks with positive revisions
40 pp |
|
|
|
|
|
|
|
|
60 pp |
|
|
|
|
|
|
Growth stock EPS revisions |
|
||
|
|
|
|
|
|
|
more positive / |
|
|
|
|
|
|
|
|
Growth stocks outperforming |
|
||
30 pp |
|
TMT Growth vs. Value |
|
|
|
40 pp |
|||
|
|
|
12m return |
|
|
|
|
|
|
|
|
|
(right axis) |
|
|
|
|
|
|
20 pp |
|
|
|
|
|
|
|
|
20 pp |
10 pp |
|
|
|
|
|
|
|
|
0 pp |
0 pp |
|
|
|
|
|
Growth vs. Value |
|
(20)pp |
|
|
|
|
|
|
|
|
|
||
|
|
|
|
|
EPS revision strength |
|
|
||
(10)pp |
|
|
|
|
(12m average, left axis) |
|
(40)pp |
||
|
|
|
|
|
|
|
|
||
2002 |
2004 |
2006 |
2008 |
2010 |
2012 |
2014 |
2016 |
2018 |
2020 |
Source: FactSet, I/B/E/S, Goldman Sachs Global Investment Research
Notably, during periods in the past when Growth and Value have had equivalent earnings strength, Value stocks have outperformed. The axes in Exhibits 18 and 20 show that, in general, Growth stock revisions need to be substantially stronger than those for Value stocks in order to warrant outperformance despite higher valuations. Based on the historical pattern, for TMT Growth stocks to resume their recent outperformance going forward – particularly given the wide degree of valuation dispersion evident today – either their earnings revisions will need to strengthen or the earnings outlook for Value stocks will need to weaken sharply.
3 December 2018 |
13 |
vk.com/id446425943
Goldman Sachs
Exhibit 19: EPS revision strength for TMT Growth vs. Value |
Exhibit 20: Earnings fundamentals drive growth stock |
|
outperformance |
|
|
|
|
|
|
|
1990 - 2018, excluding 1998-2001 |
|
|
|
|
|
||||
70% |
Share of Growth stocks |
|
|
|
|
|
60 pp |
|
|
|
|
|
|
|
|
|
|
|
Share of |
|
|
|
|
|
|
|
|
|
|
|
|||
|
with positive FY2 EPS |
|
|
Value stocks |
|
|
|
|
|
|
|
|
|
|
|
|
60% |
|
revisions |
|
|
with positive |
|
return |
40 pp |
|
|
|
|
|
|
|
|
|
|
(12m average) |
|
|
revisions |
|
|
|
|
|
|
|
|
|
|
|
|
|
|
|
|
|
|
|
|
|
|
|
|
|
|
|
|
50% |
|
|
|
|
|
|
Value 12m |
20 pp |
|
|
|
|
|
|
|
|
|
|
|
|
|
|
|
|
|
|
|
|
|
|
|
||
40% |
|
|
|
|
|
|
0 pp |
|
|
|
|
|
|
|
|
|
|
|
|
|
|
|
|
vs. |
|
|
|
|
|
|
|
|
|
|
|
|
|
|
|
|
|
|
|
|
|
|
|
|
|
|
30% |
|
|
|
|
|
|
Growth |
(20)pp |
|
|
|
|
|
|
|
|
|
|
|
|
|
|
|
|
|
|
|
|
|
|
|
||
|
|
|
|
|
|
|
|
|
|
|
|
|
|
|
|
|
20% |
|
|
|
|
|
|
|
|
|
|
|
Growth vs. Value |
|
|||
|
|
|
|
|
|
|
|
(40)pp |
|
|
|
|
||||
|
|
|
|
|
|
|
|
|
|
|
|
EPS revisions and |
|
|||
10% |
|
|
|
|
Growth share |
|
|
|
R† = 0.34 |
|
|
|
relative returns |
|
|
|
|
|
|
|
|
less Value |
|
|
(60)pp |
|
|
|
|
|
|
|
|
0% |
|
|
|
|
share |
|
|
(10)pp |
(5)pp |
0 pp |
5 pp |
10 pp |
15 pp |
20 pp |
25 pp |
30 pp |
|
|
|
|
|
|
|
|
Growth vs. Value EPS revision strength (12m average) |
|
|||||||
1995 |
2000 |
2005 |
2010 |
2015 |
2020 |
|
|
|
||||||||
Source: FactSet, I/B/E/S, Goldman Sachs Global Investment Research |
Source: Goldman Sachs Global Investment Research |
3 December 2018 |
14 |

vk.com/id446425943
Goldman Sachs
Appendix A: What we talk about when we talk about TMT Growth and Value
The historical returns of TMT Growth and Value stocks that we study in this report are calculated using a variation of the methodology used to create our standard S&P 500 Growth and Value factors.
Specifically, we rank S&P 500 TMT stocks each month on a selection of growth and value metrics. The growth metrics we use are trailing 12-month sales growth, trailing 12-month earnings growth, consensus forward 12-month EPS growth, consensus FY2 EPS growth, and consensus long-term growth. The value metrics we use are consensus forward P/E, trailing P/B, EV/sales, EV/EBITDA, and price/free cash flow (i.e., inverted FCF yield).
We then select the 25% of stocks with the highest average ranks across the five growth metrics as constituents of the Growth portfolio. The 25% of stocks with the lowest average ranks across the five valuation metrics become the Value portfolio. The portfolios are reconstituted with equal constituent weights at the beginning of each month, and their relative returns tracked over time.
We define S&P 500 TMT as the current GICS level one Information Technology and Communication Services sectors. Today this group includes, among others, the “FANG” stocks FB, NFLX, and GOOGL. AMZN is a member of the Consumer Discretionary sector and is therefore excluded from this analysis. For months prior to the recent GICS reclassification at the end of September 2018, we define the universe to effectively match the current classifications by including S&P 500 stocks in the legacy Information Technology and Telecommunication Services sectors as well as members of the Media GICS level two industry group within Consumer Discretionary.
The performance of a long/short factor built to capture high vs. low growth TMT stocks has historically been similar to the performance of a long/short factor built to track high vs. low valuation TMT stocks. These performance series have also been similar to the long/short performance of the Russell 1000 Technology Growth index vs. the Russell 1000 Technology Value index (Exhibit 21).
The TMT Growth vs. Value pair has also generally exhibited similar performance to our long/short Growth factor calculated on a sector-neutral basis across the entire S&P 500, although there have been some notable divergences within the past few years (Exhibit 22).
3 December 2018 |
15 |
vk.com/id446425943
Goldman Sachs
Exhibit 21: Comparison of TMT Growth and Value factors |
Exhibit 22: TMT and broad S&P 500 Growth vs. Value |
60 % |
|
|
|
|
|
|
|
|
100 |
|
|
|
|
|
|
|
Rolling 12-month |
|
|
|
|
|
80 |
Rolling 12- |
|
|
|
Growth |
|
||
|
|
|
|
|
|
|
|
outperforming Value |
|
||||||
40 % |
long/short returns |
|
|
|
|
|
|
month return |
|
|
|
|
|
||
|
|
|
|
|
|
|
|
|
60 |
|
|
|
|
|
|
20 % |
|
|
|
|
|
|
|
|
40 |
|
|
TMT Growth vs. |
|
|
|
|
|
|
|
|
|
|
|
|
|
|
Value |
|
|
||
|
|
|
|
|
|
|
|
|
|
|
|
|
|
|
|
|
|
|
|
|
|
|
|
|
20 |
|
|
|
|
|
|
0 % |
|
|
|
|
|
|
|
|
|
|
|
|
|
|
|
|
|
|
|
|
|
|
|
|
0 |
|
|
|
|
|
|
(20)% |
|
|
|
|
|
|
|
|
-20 |
|
|
|
|
|
|
|
|
|
|
|
|
|
|
|
-40 |
|
|
S&P 500 |
|
|
|
|
|
|
|
TMT Growth factor |
|
|
|
|
sector-neutral |
|
|
||||
(40)% |
|
|
|
|
|
|
|
|
|
|
|||||
|
|
|
Russell 1000 Tech Growth vs. Value |
|
-60 |
|
|
Growth factor |
|
|
|||||
|
|
|
|
|
|
|
|
|
|
|
|||||
(60)% |
|
|
|
TMT Value factor (inverted) |
|
-80 |
|
|
|
|
|
|
|||
|
|
|
|
|
|
|
|
|
|
|
|
|
|
||
2004 |
2006 |
2008 |
2010 |
2012 |
2014 |
2016 |
2018 |
2020 |
1990 |
1995 |
2000 |
2005 |
2010 |
2015 |
2020 |
Source: FactSet, Goldman Sachs Global Investment Research |
Source: Goldman Sachs Global Investment Research |
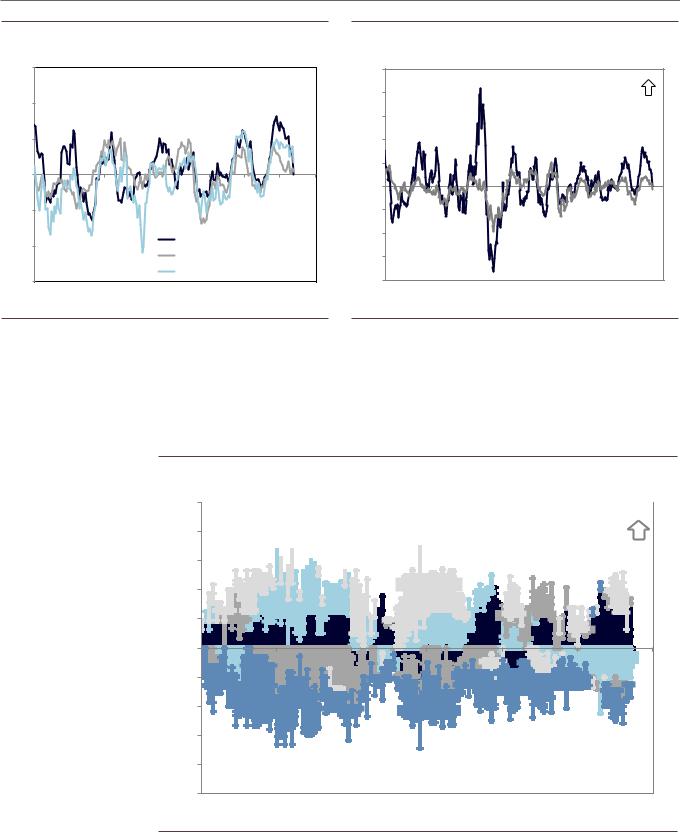
The industry composition of Growth and Value within TMT has varied over time. Most recently, TMT Growth has carried a large tilt toward Software & Services, while Value has tilted toward Hardware & Equipment and Telecom Services. For more on Information Technology from a top-down perspective, see US Sector Views: A Portfolio Strategy view of how to navigate the Information Technology sector, Oct. 2018.
Exhibit 23: Growth within S&P 500 TMT today is mostly Software & Services
100% |
|
|
|
|
|
|
|
|
|
|
|
|
|
|
|
|
Industry tilts of TMT Growth vs. Value |
More |
|||||||||||||||
|
||||||||||||||||
80% |
representation |
|||||||||||||||
|
|
|
|
|
|
|
|
|
|
|
|
|
|
|||
|
|
|
|
|
|
|
|
|
|
|
|
|
|
|
in Growth |
|
60% |
|
|
|
|
|
|
|
|
|
|
|
|
|
|
|
|
|
|
|
|
|
|
|
|
|
|
|
|
|
|
|
||
|
|
|
|
|
|
|
|
|
|
|
|
|
|
|
|
|
40%
20% |
0% |
-20% |
-40% |
-60%
-80%
 Telecom Services
  Semiconductors
  Media & Entertainment
 Hardware & Equipment
 Software & Services
-100% |
|
|
|
|
|
|
1990 |
1995 |
2000 |
2005 |
2010 |
2015 |
2020 |
Source: Compustat, Goldman Sachs Global Investment Research
3 December 2018 |
16 |

vk.com/id446425943
Goldman Sachs
Appendix B: The largest S&P 500 TMT Growth and Value stocks today
Exhibit 24: 20 largest S&P 500 TMT stocks in the top quartile of Growth
|
|
|
|
|
|
Growth |
3m revision |
|
|
|
|
|
|
|
Mkt |
YTD |
Trailing |
Cons 2019 |
to cons. |
Forward |
|
|
|
Company |
Ticker |
cap (bn) |
return |
sales |
earnings |
2019 EPS |
P/E |
|
|
|
Visa Inc. |
V |
$247 |
23 % |
12 % |
16 % |
(0.0)% |
26x |
|
|
|
Mastercard Inc. |
MA |
202 |
31 |
21 |
17 |
0.4 |
27 |
|
|
|
Netflix Inc. |
NFLX |
126 |
50 |
37 |
55 |
(4.3) |
86 |
|
|
|
Adobe Inc. |
ADBE |
122 |
42 |
24 |
17 |
3.8 |
32 |
|
|
|
salesforce.com, inc. |
CRM |
106 |
37 |
26 |
10 |
2.9 |
55 |
|
|
|
PayPal Holdings |
PYPL |
100 |
14 |
21 |
21 |
2.3 |
31 |
|
|
|
Charter Communications |
CHTR |
77 |
(2) |
4 |
32 |
2.3 |
53 |
|
|
|
Automatic Data Processing |
ADP |
64 |
26 |
8 |
17 |
1.7 |
27 |
|
|
|
Intuit Inc. |
INTU |
54 |
34 |
15 |
14 |
0.5 |
32 |
|
|
|
Autodesk Inc. |
ADSK |
32 |
39 |
20 |
255 |
(0.2) |
56 |
|
|
|
Red Hat Inc. |
RHT |
32 |
48 |
19 |
16 |
0.4 |
48 |
|
|
|
Twitter Inc. |
TWTR |
24 |
30 |
18 |
19 |
6.4 |
39 |
|
|
|
Xilinx Inc. |
XLNX |
23 |
38 |
13 |
17 |
7.4 |
27 |
|
|
|
Advanced Micro Devices |
AMD |
21 |
108 |
30 |
37 |
(1.0) |
42 |
|
|
|
CenturyLink Inc. |
CTL |
20 |
25 |
38 |
11 |
5.2 |
15 |
|
|
|
Arista Networks |
ANET |
18 |
0 |
34 |
14 |
3.7 |
28 |
|
|
|
Global Payments |
GPN |
18 |
11 |
(8) |
17 |
1.6 |
19 |
|
|
|
FleetCor Technologies |
FLT |
17 |
(0) |
11 |
15 |
(0.2) |
17 |
|
|
|
Discovery Inc. |
DISCA |
15 |
41 |
44 |
43 |
(0.4) |
9 |
|
|
|
Gartner Inc. |
IT |
14 |
24 |
30 |
14 |
(2.4) |
38 |
|
|
|
|
|
|
|
|
|
|
|
|
|
|
Growth median |
|
$24 |
31 % |
20 % |
17 % |
1.7 % |
31x |
|
|
|
S&P 500 TMT median |
|
23 |
6 |
9 |
9 |
(0.2) |
17 |
|
|
|
|
|
|
|
|
|
|
|
|
Source: FactSet, Goldman Sachs Global Investment Research
3 December 2018 |
17 |

vk.com/id446425943 |
|
|
|
|
|
|
|
|
|
|
|||
Goldman Sachs |
|
|
|
|
|
|
|
|
|
|
|||
|
|
|
|
|
|
|
|
|
|
|
|
|
|
|
Exhibit 25: 20 largest S&P 500 TMT stocks in the top quartile of Value |
|
|
|
|
|
|
|
|||||
|
|
|
|
|
|
|
|
Valuation |
|
3m revision |
Cons. 2019 |
|
|
|
|
|
|
|
Mkt |
YTD |
Fwd |
EV/ |
FCF |
to cons. |
earnings |
|
|
|
|
|
Company |
Ticker |
cap (bn) |
return |
P/E |
EBITDA |
yield |
2019 EPS |
growth |
|
|
|
|
|
AT&T Inc. |
T |
$222 |
(17)% |
9x |
6x |
9 % |
0.5 % |
3 % |
|
|
|
|
|
Intel Corp. |
INTC |
220 |
6 |
11 |
7 |
7 |
6.8 |
1 |
|
|
|
|
|
Comcast Corp. |
CMCSA |
180 |
0 |
15 |
8 |
8 |
0.1 |
9 |
|
|
|
|
|
International Bus. Machines |
IBM |
111 |
(17) |
9 |
8 |
12 |
(0.9) |
1 |
|
|
|
|
|
Micron Technology |
MU |
44 |
(8) |
4 |
2 |
19 |
(11.2) |
(14) |
|
|
|
|
|
HP Inc. |
HPQ |
36 |
11 |
10 |
8 |
11 |
(0.1) |
7 |
|
|
|
|
|
Applied Materials |
AMAT |
36 |
(27) |
11 |
7 |
9 |
(19.6) |
(16) |
|
|
|
|
|
TE Connectivity |
TEL |
26 |
(19) |
13 |
9 |
6 |
(4.8) |
4 |
|
|
|
|
|
Lam Research Corp. |
LRCX |
24 |
(16) |
10 |
6 |
9 |
(7.3) |
(3) |
|
|
|
|
|
CenturyLink Inc. |
CTL |
20 |
25 |
15 |
7 |
16 |
5.2 |
11 |
|
|
|
|
|
DXC Technology |
DXC |
18 |
(24) |
7 |
4 |
13 |
(0.5) |
9 |
|
|
|
|
|
Omnicom Group Inc. |
OMC |
17 |
9 |
14 |
8 |
10 |
(0.1) |
2 |
|
|
|
|
|
Discovery Inc. |
DISCA |
15 |
41 |
9 |
5 |
12 |
(0.4) |
43 |
|
|
|
|
|
Western Digital |
WDC |
13 |
(42) |
8 |
3 |
21 |
(36.3) |
(31) |
|
|
|
|
|
Skyworks Solutions |
SWKS |
13 |
(24) |
10 |
7 |
7 |
(6.7) |
4 |
|
|
|
|
|
Seagate Technology |
STX |
12 |
5 |
9 |
6 |
17 |
(14.6) |
(2) |
|
|
|
|
|
Viacom Inc. |
VIAB |
11 |
6 |
7 |
3 |
15 |
(2.5) |
4 |
|
|
|
|
|
Juniper Networks |
JNPR |
10 |
2 |
14 |
10 |
7 |
(0.7) |
9 |
|
|
|
|
|
Western Union |
WU |
8 |
1 |
10 |
8 |
8 |
0.8 |
2 |
|
|
|
|
|
Qorvo Inc. |
QRVO |
8 |
(2) |
10 |
10 |
8 |
(7.0) |
13 |
|
|
|
|
|
|
|
|
|
|
|
|
|
|
|
|
|
|
|
Value median |
|
$17 |
(5)% |
10x |
7x |
10 % |
(0.7)% |
4 % |
|
|
|
|
|
S&P 500 TMT median |
|
23 |
6 |
17 |
13 |
5 |
(0.2) |
9 |
|
|
|
|
|
|
|
|
|
|
|
|
|
|
|
|
Source: FactSet, Goldman Sachs Global Investment Research
3 December 2018 |
18 |

vk.com/id446425943
Goldman Sachs
Appendix C: The changing face of TMT Growth
These exhibits show the 20 largest S&P 500 TMT stocks that ranked in the top and bottom growth quartiles at various points in history, and then tracks their growth quartile rankings through subsequent years. Values are missing when companies were acquired or otherwise left the S&P 500 TMT universe. The annual numbers reflect quartile rankings in January of each given year.
Exhibit 26: The 20 largest S&P 500 TMT high growth stocks in 2000 and their growth quartile rankings in subsequent years
S&P 500 TMT Growth quartile (1 = fastest growth)
Company |
2000 |
2001 |
2002 |
2003 |
2004 |
2005 |
2006 |
2007 |
2008 |
2009 |
2010 |
2011 |
2012 |
2013 |
2014 |
2015 |
2016 |
2017 |
2018 |
|
Analog Devices |
|
|
|
|
|
|
|
|
|
|
|
|
|
|
|
|
|
|
|
|
1 |
1 |
2 |
2 |
1 |
2 |
3 |
2 |
3 |
2 |
4 |
2 |
3 |
4 |
3 |
3 |
1 |
3 |
2 |
|
|
Applied Materials |
1 |
2 |
3 |
2 |
3 |
1 |
4 |
1 |
2 |
3 |
3 |
1 |
2 |
3 |
2 |
1 |
1 |
1 |
1 |
|
CBS |
1 |
2 |
1 |
3 |
4 |
3 |
3 |
4 |
4 |
4 |
1 |
1 |
2 |
2 |
2 |
2 |
1 |
2 |
2 |
|
Cisco Systems |
1 |
1 |
1 |
2 |
3 |
2 |
3 |
2 |
1 |
2 |
3 |
2 |
4 |
2 |
3 |
4 |
3 |
4 |
4 |
|
Citrix Systems |
1 |
2 |
1 |
4 |
4 |
3 |
2 |
2 |
2 |
2 |
2 |
2 |
1 |
1 |
1 |
2 |
1 |
2 |
4 |
|
|
||||||||||||||||||||
Clear Channel |
1 |
2 |
1 |
2 |
3 |
4 |
4 |
4 |
4 |
|
|
|
|
|
|
|
|
|
|
|
Compaq Computer |
1 |
3 |
3 |
|
|
|
|
|
|
|
|
|
|
|
|
|
|
|
|
|
Conexant Systems |
1 |
1 |
4 |
|
|
|
|
|
|
|
|
|
|
|
|
|
|
|
|
|
Dell |
1 |
2 |
2 |
2 |
2 |
2 |
2 |
4 |
3 |
4 |
3 |
3 |
4 |
4 |
|
|
|
|
|
|
EMC |
1 |
1 |
4 |
2 |
1 |
1 |
1 |
2 |
2 |
3 |
1 |
1 |
1 |
1 |
2 |
3 |
3 |
|
|
|
LSI |
1 |
1 |
4 |
1 |
3 |
2 |
1 |
2 |
1 |
3 |
2 |
3 |
1 |
1 |
3 |
|
|
|
|
|
Micron Technology |
1 |
1 |
4 |
2 |
1 |
1 |
1 |
1 |
3 |
4 |
1 |
1 |
4 |
2 |
1 |
1 |
4 |
4 |
1 |
|
NetApp |
1 |
1 |
1 |
1 |
1 |
1 |
1 |
1 |
1 |
1 |
1 |
1 |
1 |
2 |
1 |
3 |
3 |
2 |
2 |
|
Nortel Networks |
1 |
1 |
4 |
|
|
|
|
|
|
|
|
|
|
|
|
|
|
|
|
|
Novell |
1 |
4 |
1 |
1 |
2 |
2 |
4 |
3 |
2 |
1 |
3 |
4 |
|
|
|
|
|
|
|
|
Qualcomm |
1 |
3 |
2 |
1 |
2 |
1 |
1 |
1 |
1 |
2 |
2 |
2 |
1 |
1 |
1 |
2 |
3 |
3 |
3 |
|
Solectron |
1 |
1 |
1 |
1 |
3 |
1 |
1 |
1 |
|
|
|
|
|
|
|
|
|
|
|
|
Teradyne |
1 |
2 |
4 |
3 |
1 |
3 |
4 |
3 |
3 |
1 |
2 |
2 |
4 |
3 |
|
|
|
|
|
|
WorldCom |
1 |
4 |
3 |
|
|
|
|
|
|
|
|
|
|
|
|
|
|
|
|
|
Xilinx |
1 |
1 |
2 |
1 |
1 |
3 |
2 |
3 |
3 |
3 |
2 |
3 |
4 |
4 |
2 |
4 |
4 |
4 |
3 |
|
|
|
|
|
|
|
|
|
|
|
|
|
|
|
|
|
|
|
|
|
|
Source: Goldman Sachs Global Investment Research
Exhibit 27: The 20 largest S&P 500 TMT low growth stocks in 2000 and their growth quartile rankings in subsequent years
S&P 500 TMT Growth quartile (1 = fastest growth)
Company |
2000 |
2001 |
2002 |
2003 |
2004 |
2005 |
2006 |
2007 |
2008 |
2009 |
2010 |
2011 |
2012 |
2013 |
2014 |
2015 |
2016 |
2017 |
2018 |
|
AT&T |
|
|
|
|
|
|
|
|
|
|
|
|
|
|
|
|
|
|
|
|
4 |
4 |
4 |
2 |
4 |
4 |
|
|
|
|
|
|
|
|
|
|
|
|
|
|
|
BellSouth |
4 |
4 |
4 |
4 |
4 |
4 |
4 |
|
|
|
|
|
|
|
|
|
|
|
|
|
CenturyLink |
4 |
4 |
4 |
3 |
3 |
4 |
4 |
4 |
4 |
4 |
2 |
3 |
4 |
2 |
4 |
3 |
3 |
4 |
4 |
|
Ceridian |
4 |
4 |
|
|
|
|
|
|
|
|
|
|
|
|
|
|
|
|
|
|
Dow Jones |
4 |
4 |
3 |
3 |
3 |
2 |
3 |
2 |
|
|
|
|
|
|
|
|
|
|
|
|
Eastman Kodak |
4 |
4 |
3 |
4 |
4 |
4 |
2 |
2 |
3 |
4 |
2 |
|
|
|
|
|
|
|
|
|
|
|
|
|
|
|
|
|
|
||||||||||||
First Data |
4 |
4 |
2 |
2 |
3 |
3 |
4 |
3 |
|
|
|
|
|
|
|
|
|
|
|
|
GTE |
4 |
|
|
|
|
|
|
|
|
|
|
|
|
|
|
|
|
|
|
|
HP |
4 |
4 |
2 |
3 |
1 |
3 |
3 |
3 |
2 |
1 |
3 |
3 |
4 |
4 |
4 |
4 |
4 |
4 |
4 |
|
IBM |
4 |
4 |
3 |
3 |
4 |
4 |
4 |
4 |
3 |
3 |
4 |
4 |
3 |
3 |
4 |
4 |
4 |
4 |
4 |
|
|
||||||||||||||||||||
Knight-Ridder |
4 |
4 |
4 |
4 |
4 |
4 |
4 |
|
|
|
|
|
|
|
|
|
|
|
|
|
National Semiconductor |
4 |
3 |
4 |
1 |
1 |
4 |
3 |
4 |
4 |
4 |
4 |
4 |
|
|
|
|
|
|
|
|
New York Times |
4 |
4 |
4 |
3 |
4 |
4 |
4 |
4 |
3 |
4 |
2 |
|
|
|
|
|
|
|
|
|
Seagate Technology |
4 |
|
|
|
|
|
|
|
|
|
|
|
|
|
|
|
|
|
|
|
Sprint |
4 |
4 |
4 |
3 |
4 |
2 |
2 |
2 |
4 |
2 |
4 |
4 |
4 |
4 |
|
|
|
|
|
|
TEGNA |
4 |
4 |
3 |
4 |
4 |
4 |
4 |
4 |
4 |
4 |
4 |
4 |
4 |
4 |
2 |
4 |
3 |
4 |
|
|
Times Mirror |
4 |
|
|
|
|
|
|
|
|
|
|
|
|
|
|
|
|
|
|
|
Tribune |
4 |
3 |
2 |
3 |
4 |
4 |
4 |
4 |
|
|
|
|
|
|
|
|
|
|
|
|
Unisys |
4 |
4 |
2 |
4 |
3 |
4 |
3 |
3 |
2 |
|
|
|
|
|
|
|
|
|
|
|
Xerox |
4 |
4 |
2 |
1 |
2 |
3 |
4 |
4 |
4 |
3 |
2 |
2 |
2 |
4 |
4 |
4 |
4 |
4 |
4 |
|
|
||||||||||||||||||||
|
|
|
|
|
|
|
|
|
|
|
|
|
|
|
|
|
|
|
|
|
Source: Goldman Sachs Global Investment Research
3 December 2018 |
19 |

vk.com/id446425943
Goldman Sachs
Exhibit 28: The 20 largest S&P 500 TMT high growth stocks in 2005 and their growth quartile rankings in subsequent years
S&P 500 TMT Growth quartile (1 = fastest growth)
Company |
2005 |
2006 |
2007 |
2008 |
2009 |
2010 |
2011 |
2012 |
2013 |
2014 |
2015 |
2016 |
2017 |
2018 |
|
AMD |
|
|
|
|
|
|
|
|
|
|
|
|
|
|
|
1 |
1 |
4 |
2 |
2 |
4 |
3 |
4 |
4 |
|
|
|
|
1 |
|
|
Apple |
1 |
1 |
1 |
1 |
1 |
1 |
1 |
1 |
1 |
3 |
2 |
2 |
3 |
3 |
|
Applied Materials |
1 |
4 |
1 |
2 |
3 |
3 |
1 |
2 |
3 |
2 |
1 |
1 |
1 |
1 |
|
Autodesk |
1 |
2 |
2 |
1 |
3 |
3 |
1 |
1 |
2 |
4 |
3 |
4 |
3 |
2 |
|
Broadcom |
1 |
1 |
2 |
2 |
2 |
1 |
1 |
3 |
2 |
4 |
2 |
4 |
|
|
|
Comcast |
1 |
1 |
1 |
1 |
2 |
3 |
3 |
1 |
1 |
2 |
2 |
2 |
3 |
3 |
|
Comverse |
1 |
1 |
3 |
|
|
|
|
|
|
|
|
|
|
|
|
Corning |
1 |
1 |
2 |
2 |
3 |
2 |
4 |
4 |
4 |
2 |
2 |
4 |
2 |
3 |
|
EMC |
1 |
1 |
2 |
2 |
3 |
1 |
1 |
1 |
1 |
2 |
3 |
3 |
|
|
|
Jabil |
1 |
1 |
1 |
1 |
1 |
2 |
2 |
1 |
2 |
3 |
|
|
|
|
|
Mercury Interactive |
1 |
|
|
|
|
|
|
|
|
|
|
|
|
|
|
Micron |
1 |
1 |
1 |
3 |
4 |
1 |
1 |
4 |
2 |
1 |
1 |
4 |
4 |
1 |
|
Monster Worldwide |
1 |
1 |
1 |
1 |
4 |
3 |
2 |
|
|
|
|
|
|
|
|
NetApp |
1 |
1 |
1 |
1 |
1 |
1 |
1 |
1 |
2 |
1 |
3 |
3 |
2 |
2 |
|
Qualcomm |
1 |
1 |
1 |
1 |
2 |
2 |
2 |
1 |
1 |
1 |
2 |
3 |
3 |
3 |
|
Solectron |
1 |
1 |
1 |
|
|
|
|
|
|
|
|
|
|
|
|
Sun Microsystems |
1 |
4 |
2 |
2 |
4 |
|
|
|
|
|
|
|
|
|
|
Symantec |
1 |
2 |
1 |
3 |
2 |
1 |
3 |
2 |
3 |
4 |
4 |
4 |
1 |
2 |
|
Symbol |
1 |
1 |
|
|
|
|
|
|
|
|
|
|
|
|
|
Univision |
1 |
1 |
2 |
|
|
|
|
|
|
|
|
|
|
|
|
|
|
|
|
|
|
|
|
|
|
|
|
|
|
|
|
Source: Goldman Sachs Global Investment Research
Exhibit 29: The 20 largest S&P 500 TMT low growth stocks in 2005 and their growth quartile rankings in subsequent years
S&P 500 TMT Growth quartile (1 = fastest growth)
Company |
2005 |
2006 |
2007 |
2008 |
2009 |
2010 |
2011 |
2012 |
2013 |
2014 |
2015 |
2016 |
2017 |
2018 |
|
ADP |
|
|
|
|
|
|
|
|
|
|
|
|
|
|
|
4 |
4 |
4 |
2 |
2 |
4 |
4 |
3 |
3 |
4 |
3 |
2 |
2 |
3 |
|
|
Alltel |
4 |
4 |
4 |
|
|
|
|
|
|
|
|
|
|
|
|
AT&T |
4 |
4 |
2 |
1 |
3 |
4 |
4 |
4 |
2 |
4 |
4 |
2 |
3 |
4 |
|
BellSouth |
4 |
4 |
|
|
|
|
|
|
|
|
|
|
|
|
|
Clear Channel |
4 |
4 |
4 |
4 |
|
|
|
|
|
|
|
|
|
|
|
DXC |
4 |
4 |
3 |
3 |
2 |
4 |
4 |
4 |
2 |
4 |
4 |
|
|
1 |
|
Eastman Kodak |
4 |
2 |
2 |
3 |
4 |
2 |
|
|
|
|
|
|
|
|
|
Frontier |
4 |
4 |
4 |
4 |
4 |
4 |
4 |
3 |
4 |
4 |
3 |
2 |
2 |
|
|
IBM |
4 |
4 |
4 |
3 |
3 |
4 |
4 |
3 |
3 |
4 |
4 |
4 |
4 |
4 |
|
Knight-Ridder |
4 |
4 |
|
|
|
|
|
|
|
|
|
|
|
|
|
Lexmark |
4 |
4 |
4 |
4 |
4 |
4 |
4 |
4 |
|
|
|
|
|
|
|
|
|
|
|
|
|
|
|||||||||
Lucent |
4 |
4 |
|
|
|
|
|
|
|
|
|
|
|
|
|
National Semiconductor |
4 |
3 |
4 |
4 |
4 |
4 |
4 |
|
|
|
|
|
|
|
|
New York Times |
4 |
4 |
4 |
3 |
4 |
2 |
|
|
|
|
|
|
|
|
|
Qwest |
4 |
3 |
2 |
4 |
4 |
4 |
4 |
|
|
|
|
|
|
|
|
Scientific-Atlanta |
4 |
3 |
|
|
|
|
|
|
|
|
|
|
|
|
|
TEGNA |
4 |
4 |
4 |
4 |
4 |
4 |
4 |
4 |
4 |
2 |
4 |
3 |
4 |
|
|
Time Warner |
4 |
3 |
3 |
3 |
4 |
1 |
3 |
3 |
3 |
3 |
3 |
2 |
3 |
3 |
|
Tribune |
4 |
4 |
4 |
|
|
|
|
|
|
|
|
|
|
|
|
Verizon |
4 |
4 |
4 |
3 |
3 |
4 |
4 |
2 |
3 |
3 |
3 |
3 |
4 |
4 |
|
|
|
|
|
|
|
|
|
|
|
|
|
|
|
|
|
Source: Goldman Sachs Global Investment Research
3 December 2018 |
20 |