

ESG_140119(1)_watermark
.pdfvk.com/id446425943
ESG
vk.com/id446425943
Contents
Investment summary |
1 |
Country views |
8 |
2018 – Nowhere to hide |
14 |
Why such a bad 2018? |
17 |
Could 2019 be better? |
19 |
ESG |
34 |
ESG – Introduction |
36 |
What is ESG? |
37 |
A brief history of ESG |
38 |
Is ESG integration actually |
40 |
that new? |
40 |
ESG assets under management |
41 |
Where does ESG data come from? |
43 |
The ESG debate |
45 |
Does (or should) ESG outperform? |
48 |
Putting ESG to the test, pt. 1 |
51 |
Putting ESG to the test, pt. 2 |
54 |
ESG appendix A |
64 |
ESG appendix B – ESG providers |
66 |
ESG appendix C – Detailed country scores |
68 |
ESG appendix D – Full ESG breakdown for top/bottom EM |
|
companies |
69 |
ESG appendix E – Full ESG breakdown for top/bottom EM EMEA |
|
companies |
70 |
Take five |
71 |
Cometh the hour… |
81 |
ESG appendix F |
85 |
EM fund flows: Allocations |
91 |
EM fund flows: Allocations |
92 |
EM fund flows: Allocations |
93 |
EM fund flows: Allocations |
94 |
EM fund flows: Net overweight |
95 |
EM fund flows: Net overweight |
96 |
EM fund flows: Net overweight |
97 |
EM fund flows: Net overweight |
98 |
EM fund flows: Allocations |
99 |
EM fund Flows: Allocations |
100 |
Market watch |
101 |
Disclosures appendix |
102 |
Daniel Salter
+44 (207) 005-7824 DSalter@rencap.com
Vikram Lopez
+44 (207) 005-7974
VLopez@rencap.com
Charles Robertson
+44 (207) 005-7835
CRobertson@rencap.com
Yvonne Mhango
+27 (11) 750-1488
YMhango@rencap.com
Oleg Kouzmin
+7 (495)258-7770 x4506
OKouzim@rencap.com
Research analysts

vk.com/id446425943
Investment summary
ESG
ESG (environmental, social and governance) investing is becoming increasingly important right along the investment chain – from asset owners to asset managers to corporates. We started to look at ESG from a top-down perspective in Global Chief Economist Charles Robertson’s ESG note, Reclaiming ESG in EM & FM. Here we look at some more bottom-up issues.
The Global Sustainable Investment Alliance estimates some $23trn of assets globally are managed under some form of ESG. Morningstar’s database contains $1.05trn of publicly-available ESG funds, and in EM, we have identified $21bn of publicly-available ESG equity funds, up from just $5bn at the start of 2016. Adding non-public funds would boost this figure significantly, and there are more and more mainstream funds (i.e. not specifically labelled as ESG) investing with at least one eye on ESG.
ESG covers a broad scope of strategies including traditional negative screens (e.g. not owning tobacco or weapons manufacturers), positive screens and best-in-class strategies (e.g. portfolios focused on the best ESG-scoring names), norms-based screens (excluding companies breaching international norms), thematic investing (e.g. focused on alternate energy) and impact investing (to have a measurable impact, e.g. on carbon emissions). ESG integration, where ESG is integrated throughout the investment process with the aim of improving risk-adjusted returns (key for ESG to go mainstream) is where the focus has been lately.
As ESG assets grow, and with it, corporate disclosure, companies which score well on ESG metrics should find themselves better positioned to attract a wider pool of capital and thus achieve higher valuations.
What metrics should corporates target? The list is ever growing, but we have developed a model focusing on: greenhouse gas emissions per sales; social factors such as women in the workforce and in management roles, worker safety and conditions; governance issues such as board independence and size, state ownership, and responsibilities to shareholders. Companies with lower government ownership, smaller boards and a higher representation of women in management tend to outperform.
The broader debate surrounding corporate citizenship is ongoing, and the neoclassical view (espoused most famously by Milton Friedman) that companies should focus solely on the pursuit of (legal) profits is being increasingly challenged. This analyst would suggest that any well-run business should be keen to understand the (changing) expectations put on it by broader society in addition to a focus on near-term profits, as taking care of the former should help make the latter more sustainable.
Strategy
2018 saw five overlapping waves of negativity overwhelm EM: 1) rising US rates (both bond yields and Fed funds); 2) a strong dollar; 3) escalating trade tensions; 4) global/Chinese growth concerns; and 5) the 4Q18 sell-off in US equities. Combined, these were enough to push EM equities into bear market territory, with MSCI EM ending 2018 down 17% for the year, 24% off its January peak. MSCI FM ended 2018 down 19% for the year, 25% off its January peak.
Our base case is that the US avoids recession in 2019 (which, this summer, will make the current expansion the longest since records began in the 1850s), but we expect growth to slow as the sugar rush of stimulus fades and given the lagged effects of higher borrowing costs, the stronger dollar, weaker external demand (accompanied by rising protectionism) and the partial government shutdown on the US economy. China, the eurozone and Japan are also likely to grow more slowly in 2019 vs 2018.
Renaissance Capital
14 January 2019
ESG
1
vk.com/id446425943
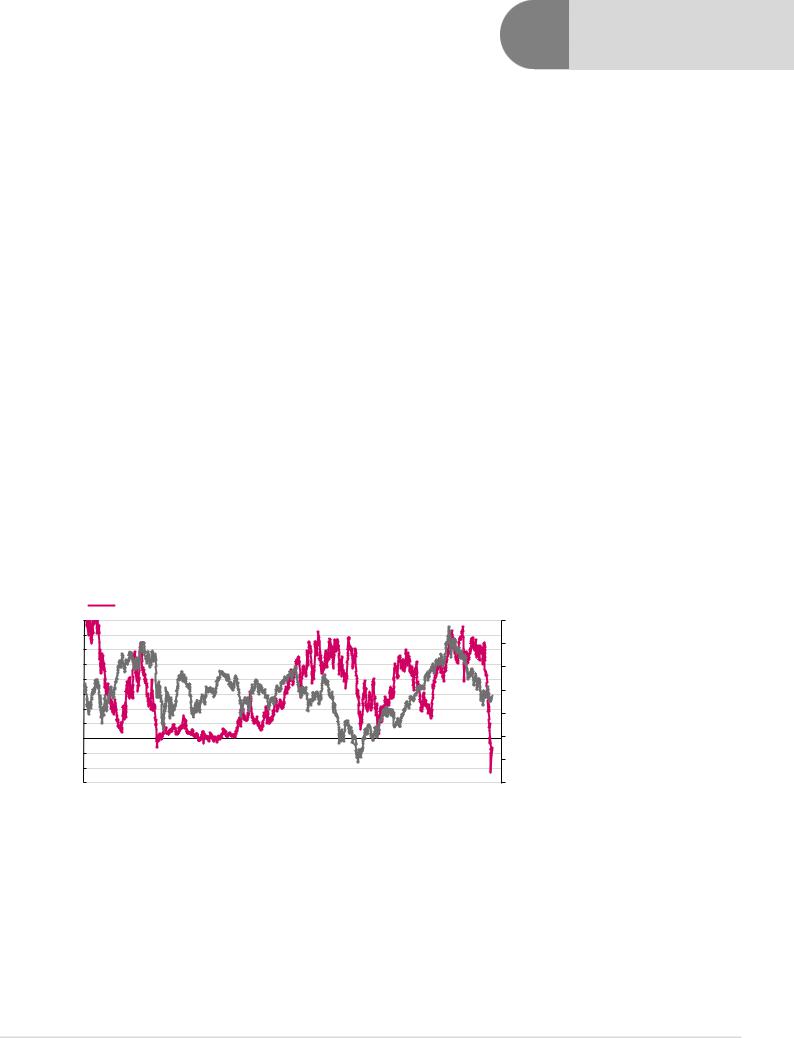
The good news for EM is that we enter 2019 with: 1) much lower US bond yields (10year Treasuries yield of 2.67% vs 3.24% in early November); 2) a more flexible Fed, with Fed futures now suggesting that the Fed might not hike at all in 2017 (sharp falls in interest rate expectations can precede an EM equity rally, as we show in Figure 1); 3) China stimulating its economy via reserve requirement ratios (RRR) cuts and big signoffs for new railways (and we expect further announcements to come) in order to be able to report the required 6.2% annual growth rate in 2019 and 2020 to double the economy over 2010-2020; 4) some easing of the strong upward pressure on the dollar that we saw in 2018; 5) oil $30/bl lower – bringing down inflation expectations and helping current accounts (C/A) for the 89% index weight of MSCI EM (and 64% of FM) that imports fuel; 6) many EM currencies trading slightly cheap vs their long-run real effective exchange rate (REER) averages; and 7) the potential for a US-China trade agreement (as trade talks in Beijing are extended) to add to risk appetite – we think recent equity market declines and softening lead indicators should help catalyse such an agreement, particularly as 2019 is a pre-election year for US President Donald Trump1.
We look at all these factors in this note and conclude that while plenty depends on policymakers and politicians taking the right actions, on balance, we think the 2019 EM equity pain trade is likely to be on the upside, and recommend investors take more risk in EM in 2019. EM equities are currently trading on a 12-month forward P/E of 10.6x, 6% below the 10-year average of 11.2x, and a 21% discount to DM on 13.4x; on 1.47x P/B, 9% below the 10-year average of 1.62x and a 31% discount to DM on 2.12x; and on 3.0% trailing dividend yield, 12% above the 10-year average of 2.66%, and a 10% premium to DM on 2.73%.
Given the potential for sharp falls in interest rate expectations to precede an EM equity rally we think investors should be prepared to take more EM risk in 2019. We do not expect a large rebound in oil or commodity prices, and while this should help the global inflation (and thus rates) picture, it skews our bias away from the oil exporters (which outperformed last year) in favour of oil importers.
Figure 1: Sharp falls in interest rate expectations can precede an EM equity rally
Amount of Fed tightening priced in to US OIS curve for next 12m (lhs) |
|
MSCI EM (rhs) |
|
0.8 |
|
|
|
|
|
|
|
|
1,300 |
0.7 |
|
|
|
|
|
|
|
|
1,200 |
0.6 |
|
|
|
|
|
|
|
|
|
|
|
|
|
|
|
|
|
|
|
0.5 |
|
|
|
|
|
|
|
|
1,100 |
0.4 |
|
|
|
|
|
|
|
|
|
0.3 |
|
|
|
|
|
|
|
|
1,000 |
|
|
|
|
|
|
|
|
|
|
0.2 |
|
|
|
|
|
|
|
|
900 |
|
|
|
|
|
|
|
|
|
|
0.1 |
|
|
|
|
|
|
|
|
|
0.0 |
|
|
|
|
|
|
|
|
800 |
-0.1 |
|
|
|
|
|
|
|
|
700 |
-0.2 |
|
|
|
|
|
|
|
|
|
|
|
|
|
|
|
|
|
|
|
-0.3 |
|
|
|
|
|
|
|
|
600 |
2010 |
2011 |
2012 |
2013 |
2014 |
2015 |
2016 |
2017 |
2018 |
2019 |
Our base-case MSCI EM target price for end-2019 is 1,081, implying 12.0% price return and 15.2% total return from end-2018 levels.
In EM, we are overweight South Africa, Egypt and Turkey. Neutral Russia, Pakistan, Saudi Arabia and Greece. Underweight CE3, UAE and Qatar.
1 But equally a recovery in the S&P and/or lead indicators might make Trump more inclined to push harder on trade
Renaissance Capital
14 January 2019
ESG
2

vk.com/id446425943
In FM, we are overweight Vietnam, Kazakhstan, Georgia, Argentina and Egypt. Neutral Romania, Kenya, Nigeria, Sri Lanka and Morocco. Underweight Bangladesh and Kuwait.
Our five-factor asset allocation model looks for countries with improving growth, faster bank lending, cheap currencies, scope for credit ratings to be upgraded and/or rate cuts (see page 69).
Emerging Markets
In EM, we are overweight South Africa, Egypt and Turkey. Neutral Russia, Pakistan, Saudi Arabia and Greece. Underweight CE3, UAE and Qatar.
Overweight
For the first time in recent years, our model is suggesting investors take a look at South Africa. The market was the fourth-worst performer in MSCI EM in 2018 as optimism over Cyril Ramaphosa’s presidency diminished in light of the lacklustre economy (and as index heavyweight Naspers sold off). It may be that the pre-election rhetoric remains tricky, but we don’t expect South Africa’s credit rating to be downgraded pre-election, and the economy should rebound gradually in 2019, and we expect bank lending to accelerate. We still see the ZAR as cheap on an REER basis and see the currency-rebound since the September-lows combined with the decline in oil prices as taking pressure off the South African Reserve Bank (SARB) to raise rates. We expect the market to look through populist pre-election statements, and see scope for a Ramaphosa 2.0 pre-election rally on the back of polls pointing to fading support for the Democratic Alliance (DA) and Economic Freedom Fighters (EFF) and a sizeable potential majority for the Africa National Congress (ANC), thus delivering a platform for the president to pursue reform. Coincidence or not, but the MSCI South Africa has had positive dollar returns in each of the last five election years going back to 1994.
Egyptian equities sold off sharply in 2018: the MSCI Egypt Investible Markets Index (which we tend to use in preference to the overly narrow, three constituent MSCI Egypt Index) closed the year 29% off its April peak and down 17% over the year as investors pushed out their rate cut forecasts from 2018 to 2019 given persistent inflation. The IMF expects the economy to accelerate in 2019, and for the C/A deficit to fall sub-2.5%. The decline in oil prices should help the story in 2019, and inflation has already fallen from 17.7% in October to 12.0% in December 2018. We see headline inflation in a 12-14% range from January to May 2019, before plunging to 8% by October 2019 (food price base effects) then picking back up to 11-13% until June 2020 (before falling back into single digits after the last subsidy removal falls out of the numbers in mid-2020). This means the Central Bank of Egypt (CBE): 1) should not need to hike interest rates now (we believe the CBE is forward looking); and 2) can start considering rate cuts in mid-2019. The currency is still cheap on our REER model, but inflation is eroding the undervaluation, and we hope the authorities will prioritise introducing greater exchange rate flexibility before the EGP reaches fair value (around end-2019) and then starts to get overvalued.
Turkey announced a record C/A surplus in October, and November’s was a fourth month of surplus – confirming: 1) how cheap the TRY has become (the cheapest in EM on our REER measure); and 2) the extent of the domestic slowdown (new passenger car sales, for example, were down 43% YoY in November). We expect the government to support the banking sector if required. In 2019, we expect growth of just 0.8%, but see upside risks to this (consensus and the IMF are more bearish). An environment of fewer Fed hikes and lower oil would benefit Turkey and allow rates to fall faster from the current 24%
Renaissance Capital
14 January 2019
ESG
3

vk.com/id446425943
Renaissance Capital 14 January 2019
ESG
level. One risk for the market could be economic populism ahead of March’s local elections, including renewed pressure on the central bank to cut rates. The shifting of VW production capacity from Central Europe to Turkey we see as demonstrating Turkey’s ability to gain manufacturing investment given full employment and poor demographics in Central Europe. Turkey was the worst-performing market in MSCI EM in 2018, down 43.6%. The market has de-rated by 30% vs its long-run average 12-month forward P/E: 6.3x v 8.9x (making Turkey the second-cheapest market in EM after Russia).
Neutral
Pakistan is starting to look interesting to us. The currency is now cheap on our REER model, and Pakistan was the second worst-performing market in MSCI EM in 2018, down 37.8%. Though IMF negotiations are complex, we expect them to continue – and an agreement would increase our enthusiasm for the market: the market is trading on a 12month forward P/E of 7x down from a 2017 peak of 11.5x as FM investors have sold down and EM investors failed to engage.
Our lacklustre outlook on oil leads us to downgrade oil exporters.
Russia we take back to neutral. The equity market was the fourth-best performer in EMEA last year (declining just 5.6%) as Russia was seen as resilient to higher US rates and trade wars. Russia has strong valuation support, companies are paying higher dividends and the geopolitical backdrop has helped catalyse economic reforms designed to make the economy bullet-proof. However, we see headwinds to the consumer story in 2019 given the increase in VAT and higher inflation/rates. The lower oil price is not positive, but is not destabilising in our opinion given the flexible exchange rate, low oilprice breakeven and external deleveraging – our long-term regression suggests the market is currently pricing in $61/bl oil, and is thus trading around fair value. However, with Brent at $60/bl, well below the Bloomberg consensus of $70/bl, downgrades to consensus earnings may be necessary. On a relative basis, given our expectation of no major rebound in oil, we would expect Russia to lag an EM recovery in 2019. We still find it a challenge to find marginal investors given EM investors are already overweight Russia, and the risk of further sanctions on Russia in 2019 is likely to deter crossover investors – even if the momentum of new sanctions appears to have slowed (e.g. potential Congressional sanctions on US investors buying newly issued sovereign debt appear to have been pushed back).
Saudi Arabia we also cut to neutral. The oil price drop takes oil below Saudi Arabia’s fiscal breakeven of $83/bl in 2018 ($73/bl in 2019) according to the IMF, hampering the authorities’ ability to stimulate the economy. MSCI Saudi Arabia was up 15.1% in 2018, which would have made it the second-best performer in MSCI EM had it already been included in the index (inclusion is due in two tranches in May and August 2019) on the back of fiscal stimulus, ahead of the MSCI EM index inclusion, and with the authorities reportedly using government-linked funds to help support the market. We would trim into strength in the run-up to MSCI inclusion at these levels.
Greece scores well on our top-down screen. But this was the case in both 2017 and 2018 and in both years MSCI Greece underperformed MSCI EM. We have to concede that our model can’t capture the nuances of Greece’s banks, but with Greece having underperformed EM for five years in a row, at some point we should expect a rebound: 2019 will be a third consecutive year of growth for the Greek economy. Legislative elections due by October could be a potential trigger, given the lead enjoyed by New Democracy over Syriza in opinion polls.
4

vk.com/id446425943
Underweight
GCC markets we have reduced our enthusiasm on given strong performance in 2018 – we had liked their pegged currencies, oil exposure, rebounding economies and the positive margin impact on the banks of higher rates. Qatar was the top-performing market in EM (up 23.9%) in 2018 and Saudi Arabia (up 15.1%) would have been the second if it was already included in the MSCI EM index. Kuwait (up 11.1%) was the top-performing market in MSCI FM. The oil price dip tempers our enthusiasm, and if the dollar rally fades or reverses, the defensiveness of pegged currencies could prove less valuable. We move from overweight to underweight in aggregate, given the strong 2018 performance, decline in oil prices and continued declines in Dubai property prices. We are underweight Qatar, UAE and Kuwait, and neutral Saudi Arabia, which we would trim into MSCI inclusion related strength.
CE3 ought to be a relative safe haven in a major sell-off given a lack of macro-imbalances and EU membership (indeed, the three CE3 countries all outperformed MSCI EM in 2018) but we would expect them to lag a rebound in EM given their exposure to slowing eurozone growth (and the auto sector) as well as relatively full valuations. Labour market shortages are leading to more rapid wage increases, underpinning the consumer story.
Frontier Markets
In FM, we are overweight Vietnam, Kazakhstan, Georgia, Argentina and Egypt. Neutral Romania, Kenya, Nigeria, Sri Lanka and Morocco. Underweight Bangladesh and Kuwait.
Overweight
Vietnam – The market has de-rated significantly, from a 12-month forward P/E of 24.9x in March to 15.7x. Planned increases in foreign investor limits could attract additional foreign interest, particularly as Argentina (currently 17% of MSCI FM) transitions from MSCI Frontier to MSCI EM in May. Vietnam could be a winner in offshoring of production from China seeking to reduce the C/A surplus with the US. A more stable CNY could ease pressure to weaken the VND.
Kazakhstan – Though oil has fallen, the equity market is very cheap (MSCI Kazakhstan trades on a 12-month forward P/E of just 5x). Volume growth in hydrocarbons provides underpin for the economy and together with stronger demographics provides a better growth story than Russia (without sanction risk). The reform agenda, such as floating the currency, progress on resolving bad loans in the banking sector, financial market reforms and much needed privatisations (given the narrow stock market) make Kazakhstan one of our favoured oil producers.
Georgia – Share price declines have brought Georgia’s highly profitable banks back to attractive valuations (c. 1.4x trailing book value). Seasonal weakness for the GEL is possible during the low season for tourism. The authorities are trying to de-risk the economy (e.g. keeping a lid on consumer credit) as part of their aim to achieve an investment-grade sovereign credit rating.
Argentina – After heavy losses in 1H (Argentina was by far the worst performing in MSCI Frontier in 2018, declining 51.7%), the market has flatlined as the government perseveres with its austerity programme. The central bank’s ultra-tight monetary policy has kept a lid on equities, with the market trading on a 12-month forward P/E of 10x vs a peak of 16x in October 2017, but progress on bringing down inflation expectations has allowed the central bank to remove the 60% floor for rates. Argentina now has the second-cheapest
Renaissance Capital
14 January 2019
ESG
5

vk.com/id446425943
currency on our REER model in EM (we use ‘shadow’ inflation data for Argentina). The finance ministry has been guiding for a return to growth in 1H19, which would be a positive for President Mauricio Macri heading into October’s elections, though political risks remain.
Egypt – see above
Neutral
Romania – We had been worried about the economy overheating. We’re less worried about this now, as the economy has slowed and the government seems keen to bring the budget deficit sub-3% of GDP. Good for bonds, but less so for equities given the new bank and other sectoral taxes. Romania’s minimum wage has grown at the fastest rate in the EU over the past decade and is converging with Hungarian levels, which suggests that industrial competitiveness could be at threat.
Sri Lanka – The political crisis that prompted Moody’s, S&P and Fitch to cut the country’s credit rating appears to have been resolved peacefully for now with President Maithripala Sirisena reinstating Prime Minister Ranil Wickremesinghe, this could help equity markets provided political tensions do not return. Early elections are possible in 2019.
Kenya – The decline in the oil price is a positive for Kenya, for both inflation and the C/A deficit. The debate on the rate cap is ongoing, but provides growth optionality for the banks which already generate high RoEs and have de-rated from an average 12-month forward P/B of 1.6x for the three largest banks in April to 1.2x currently for 18% return on equity. Much depends on the government’s ability to cut the budget deficit without overly penalising the corporate sector.
Nigeria – With a lower oil price and the NGN already trading above fair value on our REER model, the concern is that the Nigerian story becomes increasingly reliant on foreign flows. The growth recovery is lacklustre, with real GDP growth likely to lag working age population growth in 2019 (for a fifth year), resulting in a recessionary economic backdrop. The 16 February general election needs to pass for us to become more certain on the 2019 equity market story, and we’d like to see greater flexibility for the naira. Cheap valuations in the banks suggest maintaining some exposure though.
Morocco – Under-owned by foreign investors, with a currency trading in line with its longrun REER, low interest rates and a stock market closely held by local pension funds we see Morocco as a long-term industrialisation beneficiary in North Africa. However, on a 12-month forward P/E of 17.5x we fail to find value.
Underweight
Bangladesh – Bangladesh has the most expensive currency in Frontier on our REER model (though the strengthening INR may help ease devaluation pressure). Although the market has de-rated from a 12-month forward P/E of 17x in January 2018 to 14x, the market is still expensive vs 9x for MSCI FM, given limited transparency of many companies. Though the election seems to have passed relatively peacefully, tightening of bank loan to deposit ratio targets post-election could slow bank lending and/or the economy. A potential longer-term beneficiary of Asian firms reallocating low wage production from China.
Kuwait – As with other GCC countries, our lower oil price outlook diminishes our enthusiasm. The market has been the top performer in MSCI Frontier over 2018, up 11.1%, with low foreign ownership and pegged currency keeping the market defensive. We expect Kuwait to underperform a more positive EM/FM backdrop, particularly if oil
Renaissance Capital
14 January 2019
ESG
6

vk.com/id446425943
Renaissance Capital 14 January 2019
ESG
stays subdued and given friction between the legislature and executive. As a large market, Kuwait might find itself a beneficiary of Frontier funds reallocating out of Argentina (currently 17% of MSCI Frontier) as it transitions from MSCI Frontier to MSCI EM. Kuwait itself is under review by MSCI for a potential transition to EM in 2020.
7

vk.com/id446425943
Country views |
|
|
14 January 2019 |
||||||
|
|
|
|
|
|
|
|
Renaissance Capital |
|
|
|
|
|
|
|
|
|
ESG |
|
Figure 2: Strategy views |
|
|
|
|
|
|
|||
|
|
|
|
|
|
||||
|
Country |
Rating |
|
Bull case |
|
Bear case |
|||
|
EM |
|
|
|
|
|
|
|
|
|
|
|
|
|
We expect the economy to rebound albeit modestly after a weak 2018; the economy has exited a technical |
|
|
|
|
|
|
|
|
|
recession and growth should firm up from here, albeit modestly. |
|
|
|
|
|
|
|
|
|
Oil price declines and the rebound in the ZAR should ease the pressure on the central bank to raise rates; |
|
|
|
|
|
|
|
|
|
despite the rebound, the currency still appears cheap on our REER measure. |
|
Exiting the low-growth high-unemployment trap in which South Africa resides currently might require more radical |
||
|
|
|
|
|
Some pick-up in economic growth and hopefully more political certainty post-election should benefit bank lending |
|
reforms than are realistic even post-election. Though the currency appears cheap on our REER model, persistent C/A |
||
|
|
|
|
|
and fee revenue streams, although a gradual acceleration is likely at best. Growth in lending should head toward |
|
deficits and high unemployment suggests that one solution could be a weaker ZAR whilst longer-term structural |
||
|
|
|
|
|
mid-late single digits on corporate loan growth. |
|
reforms are delivered. |
||
|
South Africa |
OW |
|
We expect the market to look through populist pre-election statements, and see scope for a Ramaphosa 2.0 pre- |
|
The February budget will be a key issue for rating agencies; we note that a loss of investment-grade rating from |
|||
|
|
|
|
|
|
||||
|
|
|
|
|
election rally on the back of polls pointing to fading support for the DA and EFF and a sizeable potential majority |
|
Moody’s could trigger a sell-off of government bonds. |
||
|
|
|
|
|
for the ANC, thus providing a platform for the president to accelerate reform. Coincidence or not, but MSCI |
|
South Africa is trading on a 12M fwd P/E of 12.9x from a 2018 peak of 16.9x in January, and now trades below its |
||
|
|
|
|
|
South Africa has had positive dollar returns in each of the last five election years going back to 1994. |
|
long-term average of 13.2x; the market offers a 12M fwd dividend yield of 3.6%. |
||
|
|
|
|
|
SA has the second-highest projected EPS growth in EM according to Bloomberg consensus for 2019 at 17.6% |
|
|
|
|
|
|
|
|
|
and the highest in EMEA. |
|
|
|
|
|
|
|
|
|
SA was the fourth worst-performing market in EM over 2018; investors are marginally UW. |
|
|
|
|
|
|
|
|
|
|
|
|
||
|
|
|
|
|
Normalising relations with the US following the release of the US pastor plus a bold interest rate hike in |
|
Turkey suffers from large external financing needs but limited FX reserves; stubbornly high inflation; open FX positions of |
|
|
|
|
|
|
|
|
corporates make Turkish companies’ balance sheets vulnerable to $-strength. (Geo)political flareups are always a risk; Turkey |
|
||
|
|
|
|
|
September have led to a rebound in the TRY; so far, the central bank has avoided cutting rates despite market |
|
|
||
|
|
|
|
|
|
has been led by President Recep Tayyip Erdogan (as prime minister then president) for 15 years. |
|
||
|
|
|
|
|
fears of premature action. |
|
|
||
|
|
|
|
|
|
|
|
|
|
|
|
|
|
|
Turkey was the worst-performing market in EM over 2018; most active EM funds are now UW (and the asset- |
|
There are concerns over banking system capital adequacy if bad debts rise sharply, though we expect the authorities to |
|
|
|
|
|
|
|
|
provide support if required. |
|
||
|
|
|
|
|
weighted OW has come down significantly). |
|
|
||
|
|
|
|
|
|
|
|
|
|
|
|
|
|
|
Valuations are potentially interesting: Turkey is trading on a 12M fwd P/E of 6.2x, the second lowest in EM, and |
|
The run-up to local elections in March 2019 could test the credibility of the central bank and finance ministry. We still believe |
|
|
|
Turkey |
|
OW |
|
|
Turkey needs to adopt a new (export-led) growth model to replace the consumption-lending model of the past decade. This |
|
||
|
|
|
30% below its long-term average of 8.9x; the market offers a 12M fwd dividend yield of 6.0%, the third highest in |
|
|
||||
|
|
|
|
|
|
may require the currency to stay cheap. |
|
||
|
|
|
|
|
EM. Banks are trading substantially below book value (c. 40% lower than their five-year average). |
|
|
||
|
|
|
|
|
|
|
|
|
|
|
|
|
|
|
Turkey recorded its highest ever C/A surplus of $2.77bn for October (and November showed a fourth- |
|
Turkey screens neutral-to-negative on our model. The IMF’s expected slowdown in GDP growth is the worst in EM (from 3.5% |
|
|
|
|
|
|
|
|
in 2018 to 0.4% in 2019E, while lending growth should also slump to 3% vs 10% in 2018 (on an FX-adjusted basis)). We also |
|
||
|
|
|
|
|
consecutive monthly surplus). The 12M rolling deficit is now down to just over $39bn; it had been well over |
|
|
||
|
|
|
|
|
|
see credit rating downgrades as possible in 2019. On the positive side, the currency remains very cheap – 30% below fair |
|
||
|
|
|
|
|
$50bn earlier in the year. |
|
|
||
|
|
|
|
|
|
value, the cheapest in EM – and assuming inflation is brought under control, there may be room for rate cuts from the central |
|
||
|
|
|
|
|
The lower oil price helps Turkish inflation and the C/A: modest interest rate cuts are possible in 1H19. |
|
|
||
|
|
|
|
|
|
bank as the economy adjusts; however, premature action could be a risk. |
|
||
|
|
|
|
|
|
|
|
||
|
|
|
|
|
|
|
|
|
|
|
|
|
|
|
Egypt performed in line with EM (using the MSCI Egypt Investible Markets Index, which we tend to use in preference |
|
|
|
|
|
|
|
|
|
to the overly narrow, three constituent MSCI Egypt Index) down 17% over 2018. On an asset-weighted basis, active |
|
|
|
|
|
|
|
|
|
EM funds appear OW, but three-quarters of funds have no exposure. |
|
Currency undervaluation is gradually eroding thanks to high inflation, and we would like to see more currency |
||
|
|
|
|
|
|
|
|||
|
|
|
|
|
The decline in oil prices should help the story in 2019, and inflation has already fallen from 17.7% in October to |
|
flexibility introduced before the currency reaches fair value (around end-2019 on our model) and then starts gradually |
||
|
|
|
|
|
12.0% in December 2018. We see headline inflation in a 12-14% range from January to May 2019, before plunging |
|
to become overvalued. |
||
|
|
|
|
|
to 8% by October 2019 (food price base effects) then picking back up to 11-13% until June 2020 (before falling back |
|
Rate cuts are necessary to boost the economy and bank lending, but need inflation to come down, making them a |
||
|
Egypt |
OW |
|
into single digits after the last subsidy removal falls out of the numbers in mid-2020). This means the CBE: 1) should |
|
||||
|
|
|
2H19 story. |
||||||
|
|
|
|
|
not need to hike interest rates now (we believe the CBE is forward looking); and 2) can start considering rate cuts in |
|
|||
|
|
|
|
|
|
|
|
|
|
|
|
|
|
|
mid-2019. The currency is still cheap (by c. 15% vs its long-run average) on our REER model. |
|
The market is very small at 0.1% of MSCI EM – easily ignored by GEM investors. |
||
|
|
|
|
|
The IPO pipeline looks strong when market conditions allow. |
|
Egypt is trading on a 12M fwd P/E of 8.3x, the fifth lowest in EM, and 15% below its long-term average of 9.7x; the |
||
|
|
|
|
|
Egypt screens positively on our model. This is driven by GDP growth accelerating to 5.5% over 2019E and lending |
|
market offers a 12M fwd dividend yield of 3.9%. |
||
|
|
|
|
|
|
|
|
|
|
growth accelerating to 16% (from 12% in 2018), both of which would be helped by rate cuts (which we only expect in 2H19). We see scope for credit rating upgrades as the government’s reforms are recognised by agencies.
Source: IMF, Bruegel, MSCI, Bloomberg, Renaissance Capital
8