

Deloitte - global powers of retailing 2019_watermark
.pdfvk.com/id446425943
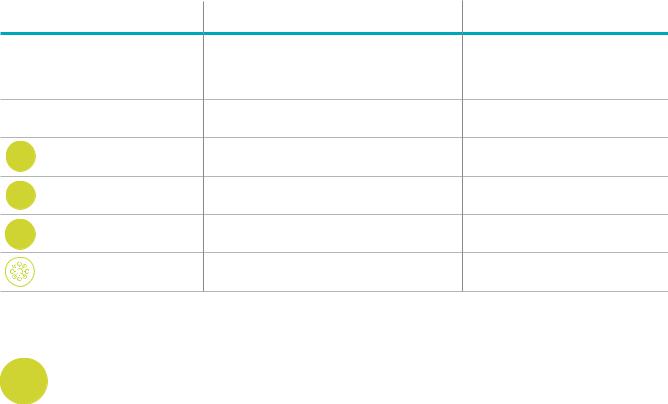
Global Powers of Retailing 2019 | Geographic analysis
Retail revenue growth and profitability by region¹, FY2017
12% |
|
|
|
|
|
|
|
|
|
|
|
|
|
|
|
|
10.5% |
|
|
|
|
|
10% |
|
|
|
|
|
9.8% |
|
|
|
|
|
|
|
|
|
|
|
|
|
|
|
|
|
|
|
|
|
|
|
|
|
|
|
|
|
|
|
|
|
|
|
|
|
|
|
8% |
|
|
|
|
|
|
|
|
6.5% |
|
|
|
7.1% |
|
|
|
|
|
|
|
|
6.6% |
6% |
|
5.7% |
|
5.0% |
5.1.% |
|
4.1% |
|
|
|
|
|
4.3% |
|
|
|
4.2% |
|
|
|||
4% |
3.3% |
2.3% |
|
3.2% |
|
3.4% |
|
|
3.0% |
3.7% |
3.6% |
4.2% |
2.3% |
|||||||||
|
2.2% |
2.1% |
2.2% |
2.2% |
||||||||||||||||||
2% |
|
|
|
|
|
|
|
|
|
|
|
|
|
|
|
|
|
|
|
|
|
|
0% |
|
|
|
|
|
|
|
|
|
|
|
|
|
|
|
|
|
|
|
|
|
|
|
|
Top 250 |
|
|
Africa/ |
|
|
Asia Pacific |
|
Europe |
|
|
Latin America |
|
North America |
|||||||
|
|
|
|
|
|
Middle East |
|
|
|
|
|
|
|
|
|
|
|
|
|
|
|
|
|
FY2012-2017 |
|
FY2017 |
|
FY2017 |
|
FY2017 |
|
|
|
|
||||
|
Retail revenue CAGR² |
|
Retail revenue growth |
|
Net profit margin |
|
ROA |
|
|
|
|
Results reflect Top 250 companies headquartered in each region/country ¹ Sales-weighted, currency-adjusted composites
² Compound annual growth rate
Source: Deloitte Touche Tohmatsu Limited. Global Powers of Retailing 2019. Analysis of financial performance and operations for fiscal years ended through June 2018 using company annual reports, Supermarket News, Forbes America’s largest private companies and other sources.
Europe has highest number of companies
Europe has the highest number of Top 250 retailers, with 87 companies based in the region (34.8 percent), up from 82 in
FY2016. Its share of Top 250 revenue was 33.8%. Its share of
Top 250 revenue was 35.1%. Retailers from Europe’s largest markets namely Germany, UK and France, contributed twothirds of the total regional revenue in FY2017. Germany has the largest companies with an average size of US$24.7 billion, closely followed by France with an average size of $24.2 billion, which are much higher than the average Top 250 size of
US$18.1 billion.
The sales-weighted, currency-adjusted composite revenue increased to 7.1 in FY2017 compared to 4.9 percent in
FY2016. The region recorded 2.2 percent CAGR, the lowest among all the other regions over the FY2012-2017 period.
Some key acquisitions from companies such as Kesko/
Suomen Lähikauppa, Auchan/OMV Petrom, REWE Combine/ Supermärkte Nord/Kaiser’s Tengelmann stores and LVMH/
Christian Dior boosted retail revenue growth for the region.
The composite net profit margin declined from 3.4 percent in
FY2016 to 2.2 percent in FY2017.
European retailers remain the most globally active as they search for growth outside their mature home markets. Nearly 42.3 percent of their combined revenue was generated from foreign operations in FY2017, which is almost double the 23.6
percent for the Top 250 group as a whole. Eighty-three percent of the region’s companies operated internationally, expanding well beyond their home country borders with a presence
in 16 countries on average. French retailers have by far the most global retail networks, with operations on average in 29 countries.
North America
Retailers based in North America represented one-third of the total Top 250 companies in FY2017, but with an average size of US$25.6 billion – the largest of all regions – they accounted for nearly half (48 percent) of all Top 250 revenue. North America, and more specifically the US (which accounts for the vast majority of the region’s Top 250 companies and generally mirror the regional results) was the only region that lagged the revenue growth level of the overall Top 250. Despite this more modest pace of growth, the net profit margin composite for retailers based in the region was on par with the Top 250 group’s overall results. The return on assets composite, at 6.6 percent, was the highest among all the regions. North American retailers have
a fairly low level of globalization. Although retail operations spanned eight countries on average, only 14.1 percent of the region’s FY2017 combined retail revenue came from foreign operations and more than 42.4 percent of the retailers remain single-country operators. However, apparel/footwear specialty retailers such as L Brands, The Gap, Nike, and American Eagle Outfitters are very global and operate in over 30 countries.
21

vk.com/id446425943
Global Powers of Retailing 2019 | Geographic analysis
Asia Pacific
Nearly a quarter of the companies from the Top 250 retailers were from the Asia Pacific region. Two new Chinese retailers, namely, Wumart Holdings, and Wangfujing Group entered the Top 250 list in FY2017. The majority (73 percent) of the retailers in the region were concentrated in China/Hong Kong
(considered as a single country for this analysis) and Japan, while the remaining retailers from the “other” Asia Pacific nations came from Australia, Indonesia, India, South Korea, Taiwan, Philippines, and New Zealand.
Retail revenue growth in FY2017 increased to 6.5 percent from 4.6 percent in FY2016, while on a longer-term basis, the region’s retailers recorded a 3.2 percent CAGR between FY2012-2017. Rising urbanization, growing single households, increasing disposable income and favorable exchange rates versus the US dollar have been the major growth drivers. The Chinese yuan rose 7 percent against the US dollar reversing the previous three consecutive years of depreciation.
Retailers in the Asia Pacific region have been relatively slow to invest in international operations. On average, they operated in just 4.0 countries, compared with 9.5 countries for the entire Top 250 group. Nearly half of the companies operated only within their home country of operations. Eighty-eight percent of the composite revenue for the region’s 60 retailers in the Top 250 was generated domestically in FY2017.
Vipshop Holdings from China recorded the fastest CAGR growth in the region, 73.8 percent over the FY2012-2017 period. Its retail revenue in FY2017 increased to US$10.9 billion from US$7.9 billion in FY2016, which also helped the retailer jump from No. 121 to No. 92 during the same period. JD.com recorded the second-fastest growth, with 52.4 percent CAGR over FY2012-FY2017, also posting a huge increase in retail revenue year-on-year from US$35.7 billion to US$49.0 billion in 2017. Aeon Co. and Seven & I Holdings were the largest contributors to Japan’s 45 percent share of the region’s revenue.
Africa/Middle East
The Africa/Middle East region has nine retailers represented in the Top 250, which is the same number as the Latin America region. The Africa/Middle East region’s 9.8 percent growth rate was the second highest of the five geographic regions, while its 2.2 percent net profit margin composite in
FY2017 was on par with other regions.
With improvements in economic growth and growing foreign investments, an increasing influx of international brands and retailers is changing the retail scene in Africa. The rising middle class has contributed to the modernization of the retailing sector, and many African economies continue to transition toward consumption-driven markets.
The Middle East continues to be an attractive destination for retailers. They are adapting to the rapidly changing consumer demand for luxury and premium items, and a more convenient, less time-consuming retail experience.
Top 250 retailers based in the region have a large geographic footprint – eight of the nine companies operated internationally in FY2017 in an average of 8.8 countries, and 23 percent of their combined retail revenue was generated outside their home countries. Shoprite Holdings was one of the biggest retailers in terms of revenue in the region, with operations in more than 15 countries; it plans to expand its reach to the Kenya market by
FY2019.
Latin America
Along with the Africa/Middle East region, the Latin American region has the fewest retailers, with nine companies represented in the Top 250. However, they continue to enjoy strong growth and above-average profitability. They showed the highest year-on-year revenue growth (10.5 percent) and also the highest net profit margin performance (3.7 percent).
Retailers operating in this region are mainly focused on regional operations, which is evident from the fact that on average, they have operations in only 2.4 countries, the lowest among all the regions in FY2017.
Cencosud and S.A.C.I were a few of the largest retailers in the region in terms of retail revenue who saw their Top 250 ranking improve from No. 64 to No. 61 and from No. 95 to No. 90 respectively between FY2016 and FY2017. In addition, FEMSA was one of the strongest performers in the region, with an improved ranking from No. 100 to No. 76. This was achieved on the back of high growth in sales from new store openings and various acquisitions such as convenience store operator
Big John, drugstore operator Farmacias Acuña and Farmacias Generix, and Specialty’s Café and Bakery Inc in FY2016.
22

vk.com/id446425943 |
Product sector analysis |
23 |
vk.com/id446425943
Global Powers of Retailing 2019 | Product sector analysis
Product sector analysis
This report analyzes retail performance by primary retail product sector as well as by geography. Four sectors are used for analysis: apparel and accessories, fast-moving consumer goods, hardlines and leisure goods, and diversified. A company is assigned to one of the three specific product sectors if at least half of its retail revenue is derived from that broadly defined product category. If none of the three specific product sectors accounts for at least 50 percent of a company’s revenue, it is categorized as diversified.
Apparel and accessories retailers may be the most profitable, but hardlines and leisure goods drove growth in FY2017.
|
Product sector profiles, FY2017 |
Level of globalization by |
|||||
|
|
|
|
|
product sector, FY2017 |
||
|
|
|
|
|
% Retail |
|
|
|
|
Average |
Share of |
|
revenue |
|
|
|
|
retail |
Share of |
from |
|
% Single- |
|
|
|
Top 250 |
Average |
||||
|
Number of |
revenue |
Top 250 |
foreign |
country |
||
|
companies |
(US$M) |
companies |
revenue |
operations |
# countries |
operators |
Top 250 |
250 |
18,120 |
100% |
100% |
23.6% |
10 |
34.4% |
Apparel and accessories |
40 |
11,045 |
16.0% |
9.8% |
40.4% |
26 |
15.0% |
Fast-moving consumer goods |
138 |
21,746 |
55.2% |
66.2% |
21.7% |
6 |
40.6% |
Hardlines and leisure goods |
50 |
16,348 |
20.0% |
18.0% |
22.5% |
7 |
32.0% |
Diversified |
22 |
12,271 |
8.8% |
6.0% |
21.5% |
8 |
36.4% |
Source: Deloitte Touche Tohmatsu Limited. Global Powers of Retailing 2019. Analysis of financial performance and operations for fiscal years ended through June 2018 using company annual reports, Supermarket News, Forbes America’s largest private companies and other sources.
Apparel and accessories
The apparel and accessories sector saw the secondhighest composite retail revenue growth of 7.1 percent in FY2017. This is much higher than in FY2016,
when it fell to 4.4 percent. The sector was unable to reclaim its position as the clear growth leader, which it lost for the first time in four years in FY2016. However, it continued to be the most profitable product sector with a composite net profit margin of
6 percent and a return on assets composite of 7.8 percent. This performance has been reflected in the Fastest 50 with the top three apparel and accessories companies witnessing decline in their ranking in FY2017 as compared to FY2016.
In addition to having the highest net profit margin, most apparel and accessories retailers have a strong international presence.
In FY2017, foreign market operations accounted for 40.4 percent of the sector’s composite retail revenue, an increase from 35.1 percent in FY2016. This is far greater than the composite retail revenue of other product sectors and also that of the overall
Top 250 retailers, which was 23.6 percent in FY2017. Apparel and accessories retailers have the largest global footprint of the product sectors, with a presence on average in 26 countries. Despite having the second-highest composite retail revenue growth and strong global presence, this sector contributed
24

vk.com/id446425943
Retail revenue growth and profitability by primary product sector¹, FY2017
12% |
|
|
|
|
|
|
|
|
|
|
|
|
|
10.1% |
|
|
|
|
|
10% |
|
|
|
|
|
|
|
|
|
|
|
|
|
|
|
|
|
|
|
|
|
|
|
|
|
|
7.8% |
|
|
|
|
|
|
|
|
|
|
|
|
8% |
|
5.7% |
|
|
|
7.1% |
6.0% |
|
|
|
|
6.8% |
|
6.0% |
|
|
|
|
|
6% |
|
|
5.0% |
4.7% |
|
4.9% |
|
4.0% |
|
|
|
|
4.1% |
||||||
4% |
3.3% |
2.3% |
2.4% |
|
2.8% |
|
|
|
|||||||||||
2% |
1.6% |
1.8% |
0.3% |
1.6% |
|||||||||||||||
|
|||||||||||||||||||
0% |
|
|
|
|
|
|
|
|
|
|
|
|
|
|
|
|
- |
|
|
|
|
|
|
|
|
|
|
|
|
|
|
|
|
|
|
|
|
|
|
|
|
Top 250 |
|
|
Apparel and |
|
|
Fast-moving |
|
|
Hardlines and |
|
Diversified |
|
|||||
-2% |
|
|
|
|
|
accessories |
|
consumer goods |
|
leisure goods |
|
|
|
|
|||||
|
FY2012-2017 |
|
FY2017 |
|
FY2017 |
|
FY2017 |
|
|
|
|
||||
|
Retail revenue CAGR² |
|
Retail revenue growth |
|
Net profit margin |
|
ROA |
|
|
|
|
¹ Sales-weighted, currency-adjusted composites
² Compound annual growth rate
Source: Deloitte Touche Tohmatsu Limited. Global Powers of Retailing 2019. Analysis of financial performance and operations for fiscal years ended through June 2018 using company annual reports, Supermarket News, Forbes America’s largest private companies and other sources.
less than ten percent to the Top 250 retail revenue in FY2017.
Retailers in this sector are relatively small in size, averaging US$11.0 billion in retail revenue, compared with the average Top 250 retailer revenue of US$18.1 billion.
Fast-moving consumer goods
The fast-moving consumer goods (FMCG) sector is the key driver of the Top 250 metrics. The 138 companies (55.2 percent of Top 250 retailers)
generated 66.2 percent of the retail revenue in FY2017. Eight of the Top 10 companies in the Top 250 retailers belong to the
FMCG sector. In comparison to other sectors, retailers of this sector have the largest average retail revenue (US$21.7 billion in FY2017). Although being the largest contributor to the total retail revenue of the top 250 companies, this is a low-margin sector with one of the lowest net profit margin of all the sectors (1.6 percent in FY2017).
Although the FMCG sector witnessed modest growth with a
2.4 percent composite compound annual growth rate (CAGR) from FY2012-2017, some retailers in this sector witnessed stellar CAGR growth during this period when compared to the hardlines and leisure goods and the apparel and accessories sectors.
Ongoing price wars, food price inflation, and the rise of online grocery shopping have intensified the competition in the evolving grocery market. During FY2017, a hyper-competitive grocery landscape continued to drive food price deflation. Several grocers, especially discounters, reduced prices further to tackle the ongoing price war among retailers, resulting in weaker profit performance for many grocers. However, declining food prices can be leveraged by retailers who hold significant share in other product sectors in addition to the grocery sector, such as Walmart (along with grocery, Walmart also operates
a large general merchandise business). Moreover, lower food prices drive store traffic and may lead consumers to spend more on discretionary items like apparel, home goods, and electronics, which are high-margin products. Hence, this also becomes an opportunity for retailers with a strong non-food presence.15,16
Mergers and acquisitions continued in FY2017 as retailers tried to achieve better economies of scale and leverage consumer demand for e-commerce.
•• In August 2017, Walmart announced the completion of its majority-stake acquisition (77 percent) in Flipkart, which is India’s leading e-commerce marketplace, in a US$16 billion deal.17,18
25

vk.com/id446425943
Global Powers of Retailing 2019 | Product sector analysis
•• In January 2018, 7 Eleven, Inc., a subsidiary of Seven & I Holdings Co., Ltd.., completed the acquisition of almost 1,030 Sunoco convenience stores located in 17 US states. As part of this deal, Seven & I Holdings Co., Ltd. agreed to sell and divest some of its stores. This was provided as a remedy by the U.S. Federal Trade Commission to avoid monopoly in some markets and preserve competition.19,20
•• In March 2018, Walgreens Boots Alliance completed the purchase of 1,932 stores and three distribution centers from Rite Aid for nearly US$4.4 billion in cash.21
Hardlines and leisure goods
The hardlines and leisure goods sector continued to lead the way in FY2017 and surpassed other product sectors with a retail revenue growth rate
of 10.1 percent and a solid retail revenue CAGR of 6.8 percent from FY2012-2017. Hardlines and leisure goods only represent 20 percent (50 companies) of the Top 250, but this strong growth helped to sustain the Top 250’s continued FY2017 retail revenue growth rate of 5.7 percent.
Despite this strong growth, hardlines and leisure goods were unable to shield the net profit margins of the Top 250 companies from the overall challenges of the retail sector and hence a slight decline from 3.2 percent in FY2016 to 2.3 percent in FY2017. Ten hardlines and leisure retailers were ranked in the Fastest 50, including online retailers JD.com, Inc. and Wayfair, Inc., which boosted the rapid growth of this product sector. However, seven retailers in this sector reported year-on-year revenue decline in FY2017 in local currency, including Staples, Inc., who reported a significant decline in its retail revenue CAGR of -12.9 percent, a continuation of the store closures experienced in FY2016.
Overall, the hardlines and leisure good sector outperformed the overall Top 250 company’s performance in every category including achieving a solid net profit margin composite of 2.8 percent and a return on assets composite of 6.0 percent.
(Note: Apple Inc. is excluded from the profitability ratios).
Diversified
The diversified group persistently experiences
slow growth and FY2017 is no different. A retailer is considered “diversified” when none of the three
specific product-oriented sectors accounts for at least 50 percent of its retail revenue. This sector witnessed a composite retail revenue decrease of -0.3 percent, which represented an actual improvement from the -1.3 percent achieved in FY2016, but is still well below the Top 250 overall performance of 5.7 percent. The retail revenue CAGR for the twenty-two retailers in this sector was 1.8 percent from FY2012-2017, which reinforced the lack of growth in the group compared to the 3.3 percent achieved by the Top 250 companies.
Total sales at Sears Holdings, one of the top five diversified companies shrunk for the 11th consecutive year, falling by 24.6 percent in FY2017. Decline in total revenue from FY2016 to FY2017 was mainly driven by the decline in merchandise sales of US$4.8 billion. This resulted in a decrease of approximately US$3.2 billion owing to fewer Kmart and Sears Full-line stores being in operation.22
Meanwhile, the main reasons for the big drop in sales of Lotte Shopping Co., Ltd are K-IFRS adoption and discontinued operations following spin-off as part of a major company reorganization in 2017. In April 2017, the Group’s Board of Directors approved the spin-off of the respective investment
divisions of Lotte Shopping Co., Ltd., Lotte Chilung Beverage Co., Ltd., and Lotte Food Co., Ltd., which merged into the investment division of Lotte Confectionery Co., Ltd.23
26

vk.com/id446425943 |
New entrants |
27 |

vk.com/id446425943
Global Powers of Retailing 2019 | New entrants
New entrants, FY2017
Top 250 |
|
Country |
|
FY2017 Retail |
rank |
Name of company |
of origin |
Dominant operational format |
revenue growth |
|
|
|
|
|
26 |
Metro AG |
Germany |
Cash & Carry/Warehouse Club |
1.6% |
|
|
|
|
|
40 |
Ceconomy AG |
Germany |
Electronics Specialty |
1.3% |
|
|
|
|
|
187 |
Wumart Holdings, Inc. |
China |
Supermarket |
10.5% |
|
|
|
|
|
205 |
Wayfair, Inc. |
US |
Non-Store |
39.7% |
|
|
|
|
|
223 |
RaiaDrogasil S.A. |
Brazil |
Drug Store/Pharmacy |
23.1% |
|
|
|
|
|
229 |
B&M European Value Retail S.A. |
UK |
Discount Store |
24.6% |
|
|
|
|
|
234 |
JD Sports Fashion Plc |
UK |
Other Specialty |
37.2% |
|
|
|
|
|
237 |
A101 Yeni Mağazacılık A.S |
Turkey |
Discount Store |
32.7% |
|
|
|
|
|
239 |
NORMA Unternehmens Stiftung |
Germany |
Discount Store |
4.4% |
|
|
|
|
|
241 |
Wangfujing Group Co., Ltd. |
China |
Department Store |
46.6% |
|
|
|
|
|
242 |
Action Nederland BV |
Netherlands |
Discount department store |
27.8% |
|
|
|
|
|
243 |
Lagardère Travel Retail SAS |
France |
Other Specialty |
8.6% |
|
|
|
|
|
245 |
Daiso Industries Co., Ltd. (previously Daiso |
Japan |
Discount Department Store |
8.3% |
|
Sangyo Inc.) |
|
|
|
246 |
American Eagle Outfitters, Inc. |
US |
Apparel/Footwear Specialty |
5.1% |
|
|
|
|
|
249 |
Magazine Luiza S.A. |
Brazil |
Other Specialty |
26.1% |
|
|
|
|
|
250 |
The Golub Corporation |
US |
Supermarket |
5.7% |
|
|
|
|
|
ne = not in existence (created by merger or divestiture)
Source: Deloitte Touche Tohmatsu Limited. Global Powers of Retailing 2019. Analysis of financial performance and operations for fiscal years ended through June 2018 using company annual reports, Supermarket News, Forbes America’s largest private companies and other sources.
Sixteen retailers joined or re-entered the Top 250 in FY2017. The two highest entries, Metro AG (No. 26) and Ceconomy (No. 40) are the new specialized trading companies resulting from the demerger of Metro Group in July 2017. Metro AG is focused on the FMCG sector, with its Metro Cash & Carry operation, as well as its Real Hypermarket chain (which was up for sale at the end of 2018). Ceconomy is the largest European consumer electronics retailer based on sales, primarily through its retail chains Media Markt and Saturn.
Chinese retailer Wumart Holdings entered in position No. 187 due to improvements in data availability. Wumart is primarily a supermarket retailer, but also operates
department, home improvement (B&Q China) and consumer electronics stores.
Of the remaining 13 new entrants, three saw jumps in revenue from significant acquisitions, four retailers achieved predominantly organic growth of more than 20 percent year-on-year, while the remaining six were returners to the
Top 250.
UK-based retailers B&M European Value Retail and JD Sports
Fashion entered the Top 250 in positions No. 229 and No. 234 respectively after making major acquisitions:
•• Fast-growing discount retailer B&M European Value acquired Heron Foods, a value convenience store retail business, in
August 2017. The eight months of sales from this acquisition contributed nearly 40 percent of their growth, but the majority came from store network expansion in the UK and Germany.
•• JD Sports Fashion, a leading international multichannel retailer of sports, fashion and outdoor brands, has acquired a number of sports retailers around the world in recent years.
These include Sports Unlimited (Netherlands), Runners World (Malaysia) and Next Athleisure (Australia) in 2016, Go Outdoors (UK) and Hot-T (South Korea) in 2017, and Sport Zone (Spain/ Portugal) and The Finish Line (US) in 2018. These acquisitions, together with new stores, delivered over 37 percent year-on- year growth in FY2017.
28
vk.com/id446425943
Global Powers of Retailing 2019 | New entrants
Chinese department store and supermarket operator
Wangfujing Group entered the Top 250 in position No. 241 after seeing nearly 46.6 percent year-on-year FY2017 growth, mainly due to its acquisition of Belmont Hong Kong in April 2017.
The four retailers who gained their place in the Top 250 through organic growth were:
•• Wayfair describes itself as “one of the world’s largest online destinations for the home”. They jumped into the Top 250 in position No. 205 after achieving spectacular 39.7 percent year-on-year organic growth from their core US market, up 33.5 percent, and more than doubling their revenue from their international business in Canada, the UK and Germany.
•• RaiaDrogasil, the leading drugstore chain in Brazil, saw 23.1 percent local currency year-on-year revenue growth from over 200 new stores and same store sales growth. Their entry to the Top 250 at position No. 223 was also boosted by the 9.3 percent gain in the value of the Brazilian real against the US dollar in 2017.
•• Turkish discount retailer A101 continued its recent rapid growth in FY2017, opening nearly 700 new stores throughout Turkey. They entered the Top 250 in position No. 237 despite the 17 percent drop in the value of the
Turkish lira against the US dollar.
•• Action Nederland is the fastest-growing international nonfood discounter, with over 1,100 stores in the Netherlands, Belgium, France, Germany, Luxembourg, Austria, and Poland. Their 28 percent year-on-year organic growth took them into the Top 250 in position No. 242.
The remaining new entrants (Norma, Lagardère Travel Retail, Daiso, American Eagle, Magazine Luiza and Golub) have all appeared in the Top 250 in previous years. They returned in
FY2017 within positions No. 239 to No. 250. The first four all achieved single digit growth (in local currency), while Brazil’s Magazine Luiza returned after a two year absence, following 26.1 percent year-on-year growth from new store openings, existing store maturation and online sales. Japan’s Daiso and US supermarket operator Golub, both returned for the first time since FY2012.
29

vk.com/id446425943
Fastest 50
30