

Deloite - USA Forcast 2019_Q2_watermark
.pdfvk.com/id446425943
unlikely to have been a result of the tax bill passed at the very end of 2017. Since then, business spending has grown at very slow rates (although intellectual property investment has been growing quickly). In truth, the cost of capital has been at historic lows over the past decade, but many businesses have remained reluctant to take advantage of cheap capital to raise investment. So cutting the cost of capital further by slashing the tax rate may have at best a modest impact. While our forecast is optimistic about the potential impact of the tax reform bill, that amounts to likely adding only 0.1 to 0.2 percentage points to GDP growth in the next few years.
The imposition of tarifs on a wide variety of goods—and foreign retaliation in the form of tarifs on American products—creates a large degree of uncertainty, particularly for manufacturing frms.
Some CEOs may face a painful medium-term dilemma: deciding whether their businesses need to rebuild their supply chains. Industries such as automobile production have developed intricate networks across North America and are reaching into Asia and Europe, based on the longstanding assumption that materials and parts can be moved across borders with little cost or disruption.
And fscal policy uncertainty didn’t disappear with the passing of the fnal appropriations bills for FY
2019. It seems as though each step taken in the direction of reducing fscal uncertainty leads to yet another deadline. The next two are the need to raise the debt ceiling—in the late summer—and the need to pass the appropriations bills for FY 2020 by the end of September. Much of the negotiation about appropriations has been quiet, but Congress has had a great deal of trouble passing a normally uncontroversial disaster relief funding bill.10 Policy uncertainty is therefore likely to continue to weigh on investment decisions.
The Deloitte economics team remains optimistic about investment in the medium term, since the US economy remains a fundamentally good place
2nd Quarter 2019
to do business. But business investment plays a key role in diferentiating between Deloitte’s baseline, slow-growth, and productivity-bonanza scenarios. If policy uncertainty does indeed weaken business spending further, the likelihood of the slow-growth scenario would substantially increase.
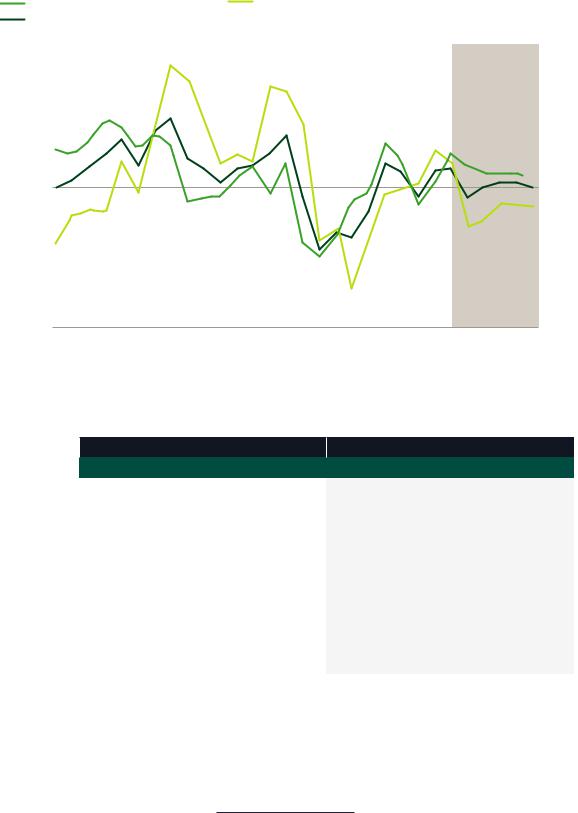
Foreign trade
Over the past few decades, business—especially manufacturing—has taken advantage of generally open borders and cheap transportation to cut costs and improve global efciency. The result is a complex matrix of production that makes the traditional measures of imports and exports somewhat misleading. For example, in 2017,
37.0 percent of Mexico’s exports to the United States consisted of intermediate inputs purchased from ... the United States.11
Recent events appear to be placing this global manufacturing system at risk. The United Kingdom’s increasingly tenuous post-Brexit position in the European manufacturing ecosystem,12 along with ongoing negotiations to replace the North American Free Trade Agreement, may slow the growth of this system or even cause it to unwind.
But the biggest challenge now facing the global trading system is the imposition of tarifs and retaliatory tarifs. The process began with US tarifs on solar panels and washing machines and now encompasses a wide variety of American imports from China and other countries. And those countries have responded, leaving an increasing amount of US exports subject to foreign retaliatory tarifs.
US-China trade talks may have stalled. Both sides claim they are talking, but in May the United States imposed additional tarifs on Chinese products, China responded with its own tarifs, and escalation threatens.13
Whether this qualifes as a “trade war” is a semantic question. The real issue is the uncertainty about
9

vk.com/id446425943
United States Economic Forecast
FIGURE 8
Foreign trade
Exports (left axis) |
|
Imports (left axis) |
|
Merchandise trade balance (right axis) |
||
Percent |
|
|
|
|
|
US$ billions |
24 |
|
|
|
|
|
-100,000 |
20 |
|
|
|
|
|
|
16 |
|
|
|
|
|
-300,000 |
|
|
|
|
|
|
|
12 |
|
|
|
|
|
-500,000 |
8 |
|
|
|
|
|
|
|
|
|
|
|
|
|
4 |
|
|
|
|
|
-700,000 |
0 |
|
|
|
|
|
|
|
|
|
|
|
|
|
-4 |
|
|
|
|
|
-900,000 |
-8 |
|
|
|
|
|
|
-12 |
|
|
|
|
|
-1,100,000 |
-16 |
|
|
|
History |
Forecast |
|
-20 |
|
|
|
-1,300,000 |
||
|
|
|
|
|
||
|
|
|
|
|
|
|
1995 |
2000 |
2005 |
2010 |
2015 |
2020 |
|
Source: Bureau of Economic Analysis/Oxford Economics and Deloitte forecast.
FIGURE 9
Foreign trade
|
|
History |
|
|
|
|
|
Forecast |
|
|
|
|
|
||
|
|
|
|
|
|
|
|
|
|
|
|
|
|
|
|
|
|
2013 |
|
2014 |
2015 |
2016 |
2017 |
2018 |
2019 |
|
2020 |
2021 |
2022 |
2023 |
2024 |
|
|
|
|
|
|
|
|
|
|
|
|
|
|
|
|
Real exports |
|
|
|
|
|
|
|
|
|
|
|
|
|
|
|
of goods and |
3.6 |
|
4.3 |
0.6 |
-0.1 |
3.0 |
4.0 |
2.0 |
|
2.0 |
2.1 |
2.3 |
2.3 |
2.6 |
|
services |
|
|
|
|
|
|
|
|
|
|
|
|
|
|
|
Real imports |
|
|
|
|
|
|
|
|
|
|
|
|
|
|
|
of goods and |
1.5 |
|
5.1 |
5.5 |
1.9 |
4.6 |
4.5 |
0.8 |
|
1.8 |
2.2 |
2.8 |
3.4 |
3.2 |
|
services |
|
|
|
|
|
|
|
|
|
|
|
|
|
|
|
Current account |
|
|
|
|
|
|
|
|
|
|
|
|
|
|
|
balance (share of |
-2.1 |
|
-2.1 |
-2.2 |
-2.3 |
-2.3 |
-2.4 |
-2.5 |
|
-2.5 |
-2.6 |
-2.7 |
-2.9 |
-3.1 |
|
GDP) |
|
|
|
|
|
|
|
|
|
|
|
|
|
|
|
Merchandise |
|
|
|
|
|
|
|
|
|
|
|
|
|
|
|
trade balance |
-690 |
|
-727 |
-737 |
-735 |
-797 |
-878 |
-696 |
|
-962 |
-991 |
-1052 |
-1156 |
-1232 |
|
(US$ billions) |
|
|
|
|
|
|
|
|
|
|
|
|
|
|
|
Relative unit |
|
|
|
|
|
|
|
|
|
|
|
|
|
|
|
labor costs |
85.7 |
|
89.0 |
99.9 |
102.1 |
102.3 |
99.8 |
99.9 |
|
97.8 |
94.7 |
92.8 |
91.7 |
90.7 |
|
(index, 2008=100) |
|
|
|
|
|
|
|
|
|
|
|
|
|
|
|
|
|
|
|
|
|
|
|
|
|
|
|
|
|
|
|
Sources: Historical data: US government agencies and Oxford Economics.
Forecast: Deloitte, using the Oxford Global Economic Model.
the tarifs and the US government’s goals in imposing these taxes. White House trade adviser Peter
Navarro argues that the tarifs are necessary to reduce the US trade defcit and to help the United
States strengthen domestic industries such as steel
production for strategic reasons.14 This suggests that tarifs in “strategic” industries could be permanent. But Commerce Secretary Wilbur Ross has stated that the goal is to force US trading partners to lower their own barriers to American exports.15
10

vk.com/id446425943
That suggests that the administration intends the tarifs to be a temporary measure to be traded for better access to foreign markets.
The apparent lack of clarity in the administration’s stated objectives for tarifs adds to the overall uncertainty about global trade policy. In the short run, uncertainty about border-crossing costs may reduce investment spending. Businesses may be reluctant to invest when facing the possibility of a sudden shift in costs. Deloitte’s slow-growth scenario assumes that the impact is large enough to afect overall business investment.
The challenge that companies face is that a signifcant change in border-crossing costs—as would occur if the United States withdrew from NAFTA without adopting its replacement, the United States-Mexico-Canada Agreement (USMCA), or made tarifs on Chinese goods permanent—could potentially reduce the value of capital investment put in place to take advantage of global goods fows.
Essentially, the global capital stock could depreciate more quickly than our normal measures would suggest. In practical terms, some US plants and equipment could go idle without the ability to access foreign intermediate products at previously planned prices.
With this loss of productive capacity would come the need to replace it with plants and equipment that would be proftable at the higher border cost.
We might expect gross investment to increase once the outline of a new global trading system becomes apparent.
In the longer term, a more protectionist environment is likely to raise costs. That’s a simple conclusion to be drawn from the fact that globalization was largely driven by businesses trying to cut costs. How those extra costs are distributed depends a great deal on economic policy—for example, central banks can attempt to fght the impact of lower globalization on prices (with a
2nd Quarter 2019
resulting period of high unemployment) or to accommodate it (allowing infation to pick up).
Whatever happens, the tarifs are unlikely to have a direct impact on the US current account (except perhaps in the very short run). The current account is determined by global fnancial fows, not trade costs.16 Any potential reduction in the current account defcit is likely to be largely ofset by a reduction in American competitiveness through higher costs in the United States, lower costs abroad, and a higher dollar. All four scenarios of our forecast assume that the direct impact of trade policy on the current account defcit is rela-
tively small.
Adding to the problems in the trade sector, growth in Europe and China has clearly slowed. These are two of the three regions that drive the global economy (the third is the United States). Slow growth abroad is very likely to translate into slower growth in US exports and perhaps a higher dollar, further slowing export growth. That’s an important contributor to downside risk for the American economy.
Brexit is an immediate issue in the short run, although it does not afect the mediumor longterm US outlook that much. A hard Brexit is unlikely to signifcantly afect US sales abroad directly. But it could help soften overall European economic growth even further—providing yet another headwind for American exporters.
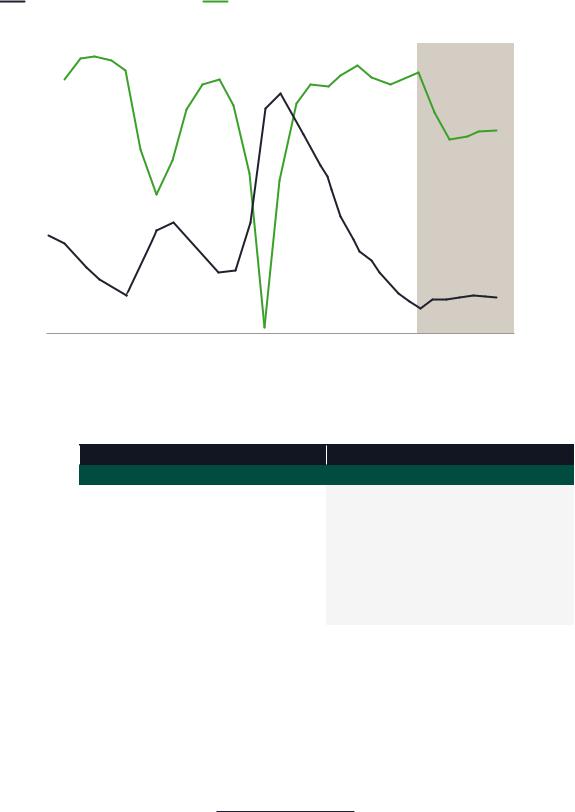
Government
Government spending provides an unusual source of volatility in the Deloitte forecast. The tax bill passed in late 2017 and the budget bill passed in early 2018 together created a large stimulus—over 2.0 percent of GDP, by Deloitte calculations—in 2019. As the stimulus ends in late 2019, that government spending will likely start falling. This drag
11
vk.com/id446425943
United States Economic Forecast
FIGURE 10
Government sector
State and local purchases (left axis) |
Federal purchases (left axis) |
|
|
||
Federal budget defcit, share of GDP (right axis) |
|
|
|
||
8% |
|
|
|
|
|
6% |
|
|
|
|
|
4% |
|
|
|
|
|
2% |
|
|
|
|
|
0% |
|
|
|
|
|
-2% |
|
|
|
|
|
-4% |
|
|
|
|
|
-6% |
|
|
|
History |
Forecast |
|
|
|
|
||
-8% |
|
|
|
|
|
1995 |
2000 |
2005 |
2010 |
2015 |
2020 |
Source: Bureau of Economic Analysis/Oxford Economics and Deloitte forecast.
FIGURE 11
Government sector
|
|
History |
|
|
|
|
|
Forecast |
|
|
|
|
|
||
|
|
|
|
|
|
|
|
|
|
|
|
|
|
|
|
|
|
2013 |
|
2014 |
2015 |
2016 |
2017 |
2018 |
2019 |
|
2020 |
2021 |
2022 |
2023 |
2024 |
|
|
|
|
|
|
|
|
|
|
|
|
|
|
|
|
Real government |
|
|
|
|
|
|
|
|
|
|
|
|
|
|
|
consumption and |
-2.4 |
|
-0.9 |
1.9 |
1.4 |
-0.1 |
1.5 |
1.6 |
|
-0.1 |
0.5 |
0.7 |
0.7 |
0.5 |
|
investment |
|
|
|
|
|
|
|
|
|
|
|
|
|
|
|
Real federal |
|
|
|
|
|
|
|
|
|
|
|
|
|
|
|
government |
-5.5 |
|
-2.6 |
0.0 |
0.4 |
0.7 |
2.6 |
1.9 |
|
-1.8 |
-1.4 |
-0.5 |
-0.5 |
-0.6 |
|
consumption |
|
|
|||||||||||||
|
|
|
|
|
|
|
|
|
|
|
|
|
|
||
and investment |
|
|
|
|
|
|
|
|
|
|
|
|
|
|
|
Real state |
|
|
|
|
|
|
|
|
|
|
|
|
|
|
|
and local |
|
|
|
|
|
|
|
|
|
|
|
|
|
|
|
government |
-0.3 |
|
0.2 |
3.0 |
2.0 |
-0.5 |
0.8 |
2.4 |
|
1.6 |
1.3 |
1.3 |
1.3 |
1.0 |
|
consumption |
|
|
|
|
|
|
|
|
|
|
|
|
|
|
|
and investment |
|
|
|
|
|
|
|
|
|
|
|
|
|
|
|
Federal budget |
|
|
|
|
|
|
|
|
|
|
|
|
|
|
|
balance, unifed |
-4.3 |
|
-2.9 |
-2.6 |
-2.9 |
-3.5 |
-3.9 |
-4.2 |
|
-4.8 |
-5.3 |
-5.6 |
-5.8 |
-5.8 |
|
basis (share of |
|
|
|||||||||||||
|
|
|
|
|
|
|
|
|
|
|
|
|
|
||
GDP) |
|
|
|
|
|
|
|
|
|
|
|
|
|
|
|
|
|
|
|
|
|
|
|
|
|
|
|
|
|
|
|
Sources: Historical data: US government agencies and Oxford Economics.
Forecast: Deloitte, using the Oxford Global Economic Model.
12

vk.com/id446425943
2nd Quarter 2019
on the economy is large enough to slow growth substantially. The Deloitte baseline forecast projects GDP growth to be only 1.2 percent in 2020, quite a bit below potential.
The tax bill’s long-run impact on the economy’s capacity remains a matter of debate, with estimates ranging from no real change after a decade (Tax Policy Center) to 2.8 percent, or almost
0.3 percentage points annually (Tax Foundation).17
In this forecast’s fve-year horizon, the supply-side impact is likely too small to be noticeable. The demand-side impact is a rise in spending in 2018 and early 2019 (which has mostly taken place) and a decline in spending in late 2019 and ’20 as the budget caps go back in place and outlays fall. And that impact overwhelms the supply-side impact during the fve-year forecast horizon.
The midterm elections returned a Democratic House and Republican Senate, likely taking major economic policy changes of the table until after
2020.18 The split Congress may complicate budget decision-making over the next couple of years— although the budget has been a source of uncertainty even when Congress has been under single-party control. The past year’s shutdown demonstrates the potential of the current political environment to intensify policy uncertainty. And more deadlines loom.
The debt ceiling suspension expired on March 2. As it has done in the past, the Treasury Department is employing “extraordinary measures” to keep funds fowing.19 At some point, however, Congress will have to act—probably in late summer or early fall. At that point, another deadline will loom: FY 2020 (at the beginning of October) and the need to pass appropriations bills by then. These continued deadlines have created permanent uncertainty about US government fnances. Congress may agree to a longer-term budget deal to push further debate past the next presidential election (the best case), or the deliberations may result in further budget policy uncertainty. The difculty in passing
a disaster relief bill—normally a slam dunk for members of Congress wanting to show both their compassion and ability to secure federal funds— suggests that negotiations may be difcult.
There may be room for some positive surprises. Democratic leaders in Congress and President Trump have had some showy meetings about infrastructure. However, obtaining agreement on this may be difcult because the two sides have very diferent views of how, specifcally, to proceed, with no clear funding source. (And Republican leaders in Congress have been unenthusiastic about the idea).20 Our baseline assumes no infrastructure plan, while the productivity-bonanza scenario assumes some additional government spending as well as additional productivity from these investments in the medium and long runs.
After years of belt-tightening, many state and local governments are no longer actively cutting spending. However, many state budgets remain constrained by questions around the efects of new federal tax policy21 and the need to meet large unfunded pension obligations,22 so state and local spending growth will likely remain low over this forecast’s fve-year horizon.
Pressure is building for increased spending in education, as evidenced by the ongoing public teacher protests in several states.23 With education costs accounting for about a third of all state and local spending, a signifcant upturn in this category could create some additional stimulus—or could require an increase in state and local taxes.
Labor markets
If the American economy is to efectively produce more goods and services, it will need more workers. Many potential employees remain out of the labor force, having left in 2009, when the labor market was challenging. But they are returning. The labor force participation rate for 24–54-year-old workers
13
vk.com/id446425943
United States Economic Forecast
FIGURE 12
Labor markets
Unemployment rate (left axis) |
Average monthly job gain (right axis) |
|
|
||||
Percent |
|
|
|
|
|
Thousands |
|
11 |
|
|
|
|
|
|
300 |
|
|
|
|
|
|
|
|
10 |
|
|
|
|
|
|
200 |
|
|
|
|
|
|
|
|
9 |
|
|
|
|
|
|
100 |
|
|
|
|
|
|
|
|
8 |
|
|
|
|
|
|
0 |
|
|
|
|
|
|
|
|
7 |
|
|
|
|
|
|
-100 |
|
|
|
|
|
|
|
|
6 |
|
|
|
|
|
|
-200 |
5 |
|
|
|
|
|
|
-300 |
4 |
|
|
|
|
|
|
-400 |
3 |
|
|
|
|
History |
Forecast |
-500 |
1995 |
2000 |
2005 |
2010 |
2015 |
2020 |
||
Source: Bureau of Economic Analysis/Oxford Economics and Deloitte forecast.
FIGURE 13
Labor markets
|
|
History |
|
|
|
|
|
Forecast |
|
|
|
|
|
||
|
|
|
|
|
|
|
|
|
|
|
|
|
|
|
|
|
|
2013 |
|
2014 |
2015 |
2016 |
2017 |
2018 |
2019 |
|
2020 |
2021 |
2022 |
2023 |
2024 |
|
|
|
|
|
|
|
|
|
|
|
|
|
|
|
|
Average monthly |
|
|
|
|
|
|
|
|
|
|
|
|
|
|
|
change in |
183 |
|
214 |
240 |
210 |
189 |
204 |
220 |
|
112 |
33 |
42 |
57 |
78 |
|
employment |
|
|
|||||||||||||
|
|
|
|
|
|
|
|
|
|
|
|
|
|
||
(thousands) |
|
|
|
|
|
|
|
|
|
|
|
|
|
|
|
Unemployment |
7.4 |
|
6.2 |
5.3 |
4.9 |
4.4 |
3.9 |
3.6 |
|
3.9 |
3.9 |
3.9 |
3.9 |
3.8 |
|
rate (percent) |
|
|
|||||||||||||
|
|
|
|
|
|
|
|
|
|
|
|
|
|
||
Employment-to- |
|
|
|
|
|
|
|
|
|
|
|
|
|
|
|
population ratio |
45.5 |
|
45.9 |
46.4 |
46.9 |
47.1 |
47.5 |
47.8 |
|
47.9 |
47.7 |
47.6 |
47.5 |
47.5 |
|
(percent) |
|
|
|
|
|
|
|
|
|
|
|
|
|
|
|
Employment cost |
1.9 |
|
2.1 |
2.1 |
2.2 |
2.5 |
2.8 |
2.8 |
|
2.1 |
2.2 |
2.5 |
2.7 |
2.8 |
|
index |
|
|
|||||||||||||
|
|
|
|
|
|
|
|
|
|
|
|
|
|
||
|
|
|
|
|
|
|
|
|
|
|
|
|
|
|
|
Sources: Historical data: US government agencies and Oxford Economics.
Forecast: Deloitte, using the Oxford Global Economic Model.
started rising in the middle of 2015. As of April, this fgure was over 82 percent. But this is still below the peak of over 84.0 percent reached in the late 1990s, suggesting that there may be a
considerable number of workers who can be enticed back into the labor market as conditions improve. Our baseline forecast refects that possibility.
14

vk.com/id446425943
Meanwhile, the labor force participation rate for over-65s is rising. At almost 20 percent, it’s much higher than the historical average—and it is certainly possible that, with better labor market conditions, employers can entice even more over65s back into the labor force.
But a great many people are still on the sidelines and have been out of steady employment for years— long enough that their basic work skills may be eroding. Are those people still employable? So far, the answer has been “yes,” as job growth continues to be strong without pushing up wages. Deloitte’s forecast team remains optimistic that improvements in the labor market will prove increasingly attractive to potential workers, and labor force participation is likely to continue to improve accordingly. However, we are now close enough to full employment that average monthly job growth is likely to drop from the current 200,000 per month to about 100,000 per month in the next two years, even if the economy remains healthy.
In the longer run, demographics are slowing the growth of the population in prime labor force age. As boomers age, lagging demographic growth will help slow the economy’s potential growth. That’s why we foresee trend GDP growth below
2.0 percent by 2021: Even with an optimistic view about productivity, we expect that slow labor force growth will eventually be felt in lower eco-
nomic growth.
Immigration reform might have a marginal impact on the labor force. According to the Pew Research Center, undocumented immigrants make up about 4.8 percent of the total American labor force.24 Immigration reform that restricts immigration and/or increases the removal of undocumented workers might create labor shortages in certain industries, such as agriculture, in which a quarter of workers are unauthorized,25 and construction, in which an estimated 15 percent of workers are unauthorized.26 But it would likely have little signifcant impact at the aggregate level.
2nd Quarter 2019
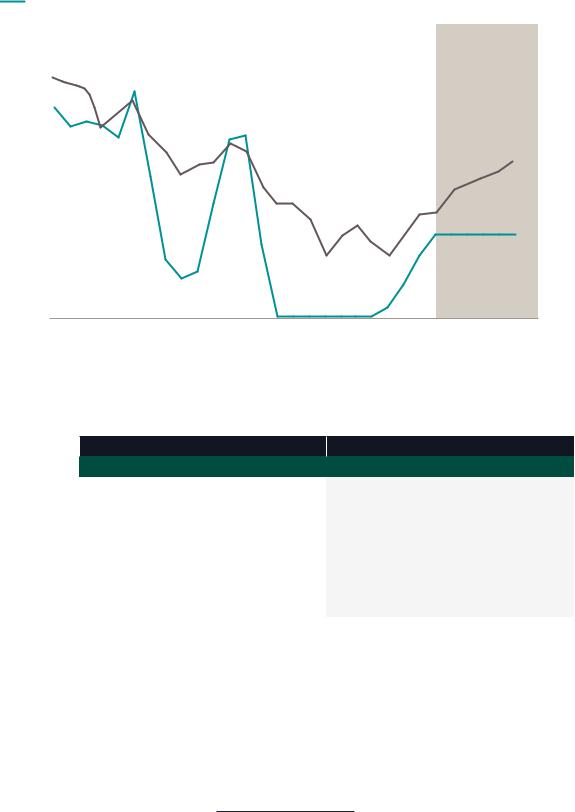
Financial markets
Interest rates are among the most difcult economic variables to forecast because movements depend on news—and if we knew it ahead of time, it wouldn’t be news. The Deloitte interest rate forecast is designed to show a path for rates consistent with the forecast for the real economy. But the potential risk for diferent interest rate movements is higher here than in other parts of our forecast.
Short-term interest rates now seem to have plateaued, with market commentary focused on the Fed cutting rates. This is probably wishful thinking, as long as the labor market continues to deliver good news. Many Fed ofcials seem to have concluded that short-term interest rates are at a “neutral” level—the rate that is consistent with full employment and stable infation. FOMC members’ central estimate for the longer-run value of the Fed funds rate is now just 2.8 percent.27
The spread between longand short-term rates has been remarkably small lately. It may remain that way for a while, but eventually, the forecast expects the spread to widen back to about 1.0 to
1.5 percentage points. That’s consistent with historical experience but does suggest that long-term rates are likely to rise to 3.5 percent or even
4.0 percent once the economy passes the period of weakness we expect in 2020. That’s not necessarily a bad thing. It’s part of the “return to normal” that the US economy is experiencing.
15
vk.com/id446425943
United States Economic Forecast
FIGURE 14
Financial markets
Federal funds rate |
|
10-year Treasury yield |
|
8%
7%
6%
5%
4%
3%
2%
1%
History Forecast
0%
1995 |
2000 |
2005 |
2010 |
2015 |
2020 |
Source: Bureau of Economic Analysis/Oxford Economics and Deloitte forecast.
FIGURE 15
Financial markets
|
|
History |
|
|
|
|
|
Forecast |
|
|
|
|
|
||
|
|
|
|
|
|
|
|
|
|
|
|
|
|
|
|
|
|
2013 |
|
2014 |
2015 |
2016 |
2017 |
2018 |
2019 |
|
2020 |
2021 |
2022 |
2023 |
2024 |
|
|
|
|
|
|
|
|
|
|
|
|
|
|
|
|
Federal funds |
0.13 |
|
0.13 |
0.14 |
0.39 |
0.97 |
1.78 |
2.37 |
|
2.37 |
2.37 |
2.38 |
2.38 |
2.38 |
|
rate |
|
|
|||||||||||||
|
|
|
|
|
|
|
|
|
|
|
|
|
|
||
|
|
|
|
|
|
|
|
|
|
|
|
|
|
|
|
Yield on 10-year |
2.35 |
|
2.54 |
2.14 |
1.84 |
2.33 |
2.91 |
2.98 |
|
3.46 |
3.69 |
3.86 |
4.01 |
4.15 |
|
Treasury bill |
|
|
|||||||||||||
|
|
|
|
|
|
|
|
|
|
|
|
|
|
||
Interest rate on |
|
|
|
|
|
|
|
|
|
|
|
|
|
|
|
30-year fxed-rate |
3.98 |
|
4.17 |
3.85 |
3.65 |
3.99 |
4.54 |
4.57 |
|
4.97 |
5.19 |
5.33 |
5.48 |
5.60 |
|
mortgage |
|
|
|
|
|
|
|
|
|
|
|
|
|
|
|
Net household |
|
|
|
|
|
|
|
|
|
|
|
|
|
|
|
wealth (US$ |
54.5 |
|
57.9 |
59.6 |
63.5 |
69.7 |
72.3 |
75.9 |
|
77.8 |
80.4 |
82.7 |
85.8 |
89.8 |
|
trillions) |
|
|
|
|
|
|
|
|
|
|
|
|
|
|
|
|
|
|
|
|
|
|
|
|
|
|
|
|
|
|
|
Sources: Historical data: US government agencies and Oxford Economics.
Forecast: Deloitte, using the Oxford Global Economic Model.
Prices
It’s been a long time since infation has posed a problem for American policymakers. Could price instability break out as the economy reaches full employment? Many economists are increasingly
wondering about this, as it becomes evident that something is amiss in the standard infation models. These models posit that, since labor accounts for about 70 percent of business costs, tight labor markets driving higher wages would be the main cause of accelerating infation. US labor markets
16

vk.com/id446425943
2nd Quarter 2019
FIGURE 16
Prices
CPI |
|
Employment cost index |
|
5%
4%
3%
2%
1%
History Forecast
0%
1995 |
2000 |
2005 |
2010 |
2015 |
2020 |
Source: Bureau of Economic Analysis/Oxford Economics and Deloitte forecast.
FIGURE 17
Prices
|
|
History |
|
|
|
|
|
Forecast |
|
|
|
|
|
||
|
|
|
|
|
|
|
|
|
|
|
|
|
|
|
|
|
|
2013 |
|
2014 |
2015 |
2016 |
2017 |
2018 |
2019 |
|
2020 |
2021 |
2022 |
2023 |
2024 |
|
|
|
|
|
|
|
|
|
|
|
|
|
|
|
|
Chained GDP |
1.8 |
|
1.9 |
1.0 |
1.1 |
1.9 |
2.2 |
2.0 |
|
1.8 |
1.6 |
1.9 |
1.9 |
1.9 |
|
price index |
|
|
|||||||||||||
|
|
|
|
|
|
|
|
|
|
|
|
|
|
||
|
|
|
|
|
|
|
|
|
|
|
|
|
|
|
|
Consumer price |
1.5 |
|
1.6 |
0.1 |
1.3 |
2.1 |
2.4 |
1.8 |
|
1.7 |
1.7 |
2.0 |
1.9 |
1.9 |
|
index |
|
|
|||||||||||||
|
|
|
|
|
|
|
|
|
|
|
|
|
|
||
Chained |
|
|
|
|
|
|
|
|
|
|
|
|
|
|
|
price index |
|
|
|
|
|
|
|
|
|
|
|
|
|
|
|
for personal |
1.3 |
|
1.5 |
0.3 |
1.1 |
1.8 |
2.0 |
1.8 |
|
1.8 |
1.7 |
1.9 |
1.9 |
1.9 |
|
consumption |
|
|
|
|
|
|
|
|
|
|
|
|
|
|
|
expenditures |
|
|
|
|
|
|
|
|
|
|
|
|
|
|
|
Employment cost |
1.9 |
|
2.1 |
2.1 |
2.2 |
2.5 |
2.8 |
2.8 |
|
2.1 |
2.2 |
2.5 |
2.7 |
2.8 |
|
index |
|
|
|||||||||||||
|
|
|
|
|
|
|
|
|
|
|
|
|
|
||
|
|
|
|
|
|
|
|
|
|
|
|
|
|
|
|
Sources: Historical data: US government agencies and Oxford Economics.
Forecast: Deloitte, using the Oxford Global Economic Model.
appear to be tightening, but wages have failed to rise accordingly.28 Real wages for nonsupervisory employees have started to rise, but with productivity also accelerating, real unit labor costs have
slowed in the past year.29 As long as businesses don’t face increasing costs, it’s hard to see what could drive a sustained rise in goods and services prices.
17

vk.com/id446425943
United States Economic Forecast
But it’s also quite possible that the economy simply hasn’t hit full employment. Despite unemployment dipping below 4.0 percent, the labor force participation rate for prime-age workers remains about two points below the rate before the fnancial crisis.
Two percent of the prime working-age population suggests that about 4 million more people could be enticed into the labor force under the right conditions. Whether those people are available is unclear, and many economists are debating the issue fercely.30 The combination of low labor-cost growth and continued high employment growth suggests that people are likely being enticed back into the labor market.
At some point, however, the combination of the tax cut and spending increase could create some shortages in both labor and product markets and, as a result, some infation. And tarifs are something of
a wild card. So far, although most of the tarifs have been on intermediate products, there is evidence that the additional cost was simply passed through to fnal consumers.31 The most recent tarif increase included more consumer goods and may be felt directly in the CPI. Interpreting infation data under those circumstances could be tricky. And if that rise sparks wage hikes to maintain real wages—a possibility at current unemployment rates—infation could indeed
tick up.
A return to 1970s-style infation is about as likely as polyester leisure suits coming back into style. But it would not be surprising in these circumstances to see the core CPI rise to above 2.5 percent. Our forecast expects timely Fed action to prevent infation from rising too much, but the price (of course) is higher interest rates.
18