

CS Investment Outlook 2019_watermark
.pdfvk.com/id446425943
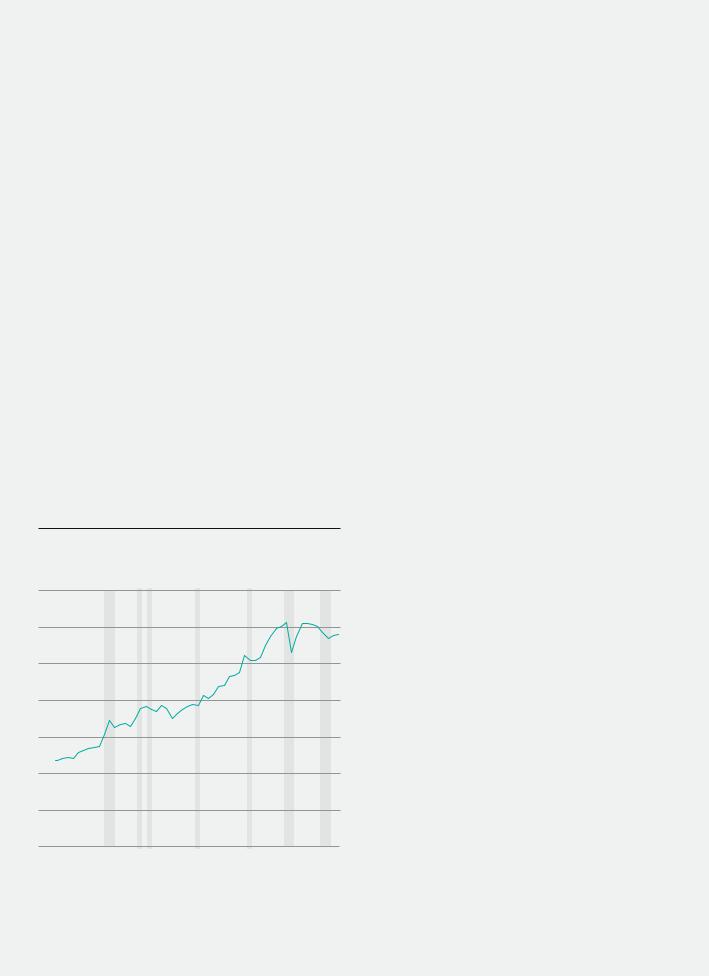
A key risk is that the positive impact of US demand fades and there is nobody to take over the baton.
The USA has been the dominant stimulator of global aggregate demand
Changes in net spending in USD bn (annual averages for sub-periods)
|
|
|
|
|
|
|
USA |
100 |
|
|
|
|
|
||
|
|
|
|
|
|
|
China |
|
|
|
|
|
|
|
Eurozone |
80 |
|
|
|
|
|
||
|
|
|
|
|
|
|
|
60 |
|
|
|
|
|
|
|
|
|
|
|
|
|
|
|
40 |
|
|
|
|
|
|
|
|
|
|
|
|
|
|
|
20 |
|
|
|
|
|
|
|
|
|
|
|
|
|
|
|
0 |
|
|
|
|
|
|
|
|
|
|
|
|
|
|
|
20- |
|
|
|
|
|
|
|
|
|
|
|
|
|
|
|
40- |
|
|
|
|
|
|
|
|
|
|
|
|
|
|
|
60- |
|
|
|
|
|
|
|
|
|
|
|
|
|
|
|
80- |
|
|
|
|
|
|
|
|
|
|
|
|
|
||
|
1998 – 2001 |
2002 – 2008 |
2009 – 2013 |
2014 – 2018 |
|||
Last data point 2017
2018 International Monetary Fund estimate Source International Monetary Fund, Credit Suisse
Note National income accounting shows that changes in the current account balance of a country correspond to the sum of changes in spending by households, companies and the government of that country. An increase in spending (reduced saving) increases the current account deficit, and vice versa. This chart shows the change in current accounts (with positive numbers indicating a worsening current account balance) and can thus be seen as an approximation of the demand impulse that a country provides to the rest of the world.
credit-suisse.com/investmentoutlook 21

vk.com/id446425943
Global economy World follows US Fed’s tightening path
World follows US Fed’s tightening path
Our base case foresees a gradual rise of inflation in advanced economies and fairly stable inflation in emerging markets, albeit with significant dispersion. We expect monetary policy to continue to tighten globally, but at a moderate pace.
|
|
22 |
Investment Outlook 2019 |

vk.com/id446425943
The evolution of inflation in the major economies, especially the USA and the Eurozone, will be a key driver of financial markets in 2019. Upside inflation surprises pose a greater risk to bond and equity markets than limited disappointments in economic growth. January 2018 was a case
in point, as a minor upward surprise in US wage inflation triggered the year’s largest correction in equities.
More money in workers’ pockets
According to our base case, core inflation will rise modestly in the USA, Eurozone and several other developed economies in 2019 as capacity constraints tighten. By late 2019, unemployment rates in the USA and Europe will likely approach 20-year lows. Labor markets are tight in Germany, the UK, Switzerland, Canada and Australia. Even Japanese wages are now rising after declining for most of the past two decades. That said, the absolute rate of wage gains is still well below pre-crisis highs, including in the USA. Yet barring an unforeseen economic shock, we believe labor markets should continue to tighten, pushing wages up further. Academic literature has suggested that wage gains have been more subdued since the financial crisis due to the increased buying power of large corporations, especially
in the services sector. However, labor shortages in these areas seem to have increased quite significantly as well,
and company-level evidence suggests that wage gains are accelerating.
Beware the inflation jokers
Wage inflation does not translate directly into price inflation. Other costs, including interest expenses and input costs (especially for raw materials such as oil) are key drivers of headline inflation. The significant increases in oil prices in 2007 and 2008 as well as in 2011 were the main reason why headline inflation rose at the time. If our global growth scenario holds, the price of oil and other cyclical commodities could rise further in 2019. Interest costs are also likely to creep up. Given strong final demand growth, the share of costs absorbed by corporate profits is unlikely to rise, as such increases typically occur when demand is weak. While we expect labor productivity measures in the USA and other developed markets to move higher, we do not believe this will markedly dampen inflation. In summary, with average inflation in advanced economies already close to the previous mid-cycle period (2004/05) levels, a further increase in inflation seems likely (see forecast on page 31).
Inflation in developed markets is back at pre-crisis levels
Consumer price inflation for ten major developed markets* and eight major emerging markets** (quarterly data %); line shows average, shadows show +/- one standard deviation.
14
12
10
8
6
4
2
0
2005 |
2007 |
2009 |
2011 |
2013 |
2015 |
Last data point Q3 2018 |
|
* Developed markets: |
|
|
|
Source Thomson Reuters Datastream, |
Australia, Canada, France, Germany, Italy, Japan, Sweden, Switzerland, UK, USA |
||||
Credit Suisse |
|
** Emerging markets: |
|
|
|
|
|
Brazil, China, India, Indonesia, Mexico, Russia, South Africa, Turkey |
|
||
2017
Developed markets Emerging markets
credit-suisse.com/investmentoutlook 23

vk.com/id446425943
Global economy World follows US Fed’s tightening path
Emerging markets take a different path
In emerging markets (EM) inflation may take a different path than in advanced economies. After 2011, inflation in EM diverged from the advanced economies as growth remained robust in the former and weakened in the latter following the Eurozone crisis. Inflation in EM then declined on the heels of lower oil prices and weakening growth in China. Looking ahead, headline inflation in EM may rise to some extent due to higher energy prices and the broad weakening of EM currencies in 2018. Yet we believe it is likely that monetary authorities in most EM countries will focus on steadying currencies, helping inflation stabilize in the course of 2019.
Interest rates to rise
The base case of continued economic growth and moderately rising inflation suggests that monetary policy will tighten in most advanced and some emerging economies in 2019. At the time of writing, the futures market implied that the Fed funds rate would end up below 3% by the end of 2019. This would imply one to two further rate hikes in 2019, after a likely hike in December 2018, taking the real Fed funds rate to about 1%, broadly in line with our forecast.
At its September 2018 meeting, the Fed’s Federal Open Market Committee removed the reference to its policy being “accommodative.” While the Fed’s new chairman, Jerome Powell, has eschewed precise estimates of “neutral” interest rates, consensus estimates of neutral are typically near 3%. Hence many market participants will probably consider US policy close to tight by the end of 2019. The European Central Bank (ECB), however, is set to end net asset purchases at the end of 2018 and unlikely to hike rates before H2 2019. Thus, its policy will remain accommodative.
In 2018, EM central banks have had to contend with tighter Fed policy and an appreciating USD. The risk case for them is that the USD experiences a further marked appreciation while global growth weakens. That would make things very difficult for policymakers. Even in the more benign case of solid global growth and no broad USD uptrend, EM central bank rates will tend to rise rather than fall given rising rates in advanced economies. However, we still expect most central bank rates globally to end 2019 well below the peaks of the previous cycle. This is consistent with the fact that this cycle is not driven by a significant credit boom, featuring extensive economic overheating.
Significant central bank tightening since early 2018
Number of central bank interest rate increases vs. cuts globally in prior six months (net percentage)
80
60
40
20
0
-20
-40
-60
-80
2000 |
2002 |
2004 |
2006 |
2008 |
2010 |
2012 |
2014 |
2016 |
2018 |
Last data point October 2018
Source Thomson Reuters Datastream, Credit Suisse
24 |
Investment Outlook 2019 |
vk.com/id446425943
Spotlight
Proclaiming the demise of globalization may be premature
The intensifying trade conflicts of 2018 have raised the specter of a reversal of the post-World War II globalization trend. We think this fear is exaggerated as most companies and countries continue to have a strong interest in maintaining (more or less) open markets. Moreover, we believe the US tariffs introduced in 2018 have so far been too limited to have a large effect.
That being said, our simple measure of globalization (global exports as a percentage of global GDP) has stalled since the 2008 financial crisis but for largely cyclical reasons: trade growth typically falls during
Slowing trade penetration largely cyclical
Total global exports in % of global GDP
35 |
|
|
|
|
|
|
|
|
|
30 |
|
|
|
|
|
|
|
|
|
25 |
|
|
|
|
|
|
|
|
|
20 |
|
|
|
|
|
|
|
|
|
15 |
|
|
|
|
|
|
|
|
|
10 |
|
|
|
|
|
|
|
|
|
5 |
|
|
|
|
|
|
|
|
|
1964 |
1970 |
1976 |
1982 |
1988 |
1994 |
2000 |
2006 |
2012 |
2018 |
Last data point 2017 |
|
US recessions and |
2018 Credit Suisse estimate, |
|
China slowdown |
Netherlands Bureau for Economic |
(2015/16) |
|
Policy Analysis estimate |
|
|
Source World Bank, Credit Suisse |
|
|
recessions, seemingly halting the globalization trend. Moreover, big declines in commodity demand and prices have the same impact. The effect is amplified as lower commodity prices reduce demand for mining-related capital goods. Finally, trade also tends to slow in periods of USD weakness, mainly because US import demand suffers; past instances of the USA imposing tariffs (President Nixon in 1971, President Bush in 2002) coincided with periods of weak growth or a weak USD.
Globalization unlikely to return to steep uptrend
In line with this analysis, our globalization measure has begun to recover with better post-2016 growth in China, as well as the 2018 recovery in oil prices and the USD. However, we believe it is unlikely that the measure will revert to its steep upward trend anytime soon. First, growth in China and other emerging markets that are strongly exposed to trade may be
slower for longer. Moreover, the non-tariff barriers many countries introduced after the financial crisis may have lasting negative effects on trade. Third, the growing web of bilateral trade treaties may have simply diverted, rather than boosted, trade. Finally, the globalization of supply chains may have at least temporarily stalled as wage costs rose faster in some EM to which production had been outsourced. As trade barriers increase, the incentive to move production to the countries imposing barriers may further fuel that trend.
credit-suisse.com/investmentoutlook 25

vk.com/id446425943
Global economy The global economy’s stress test
The global economy’s stress test
Economic downturns or financial crises typically occur when an economy exhibits significant imbalances. Compared to 2007, household imbalances are markedly lower in the USA but fiscal imbalances are greater. In the Eurozone, both the external and fiscal balances have improved. In emerging markets (EM), the picture is mixed.
|
|
26 |
Investment Outlook 2019 |
vk.com/id446425943
 Corporates have significantly lengthened the maturity of their borrowing so that the passthrough from rising interest rates to interest costs will be much slower than in past cycles.
Our base case for the global economy is moderately optimistic despite some risks, as we described earlier. Nevertheless, key countries do have potential vulnerabilities compared with previous pre-recession or pre-crisis years.
US households in better shape
The chart (see page 28) presents a spider web for a relatively broad range of US economic and financial indicators that allow for a differentiated risk assessment. Comparing the current period with past pre-recession situations yields the following results:
ƏƏ
ƏƏ
ƏƏ
The US labor market, as measured by the unemployment gap, looks slightly tighter than in 2007. Yet inflation pressures are lower, suggesting less need for outright tight monetary policy. This distinction is important because phases of overtightening have tended to act as catalysts for later recessions (e.g. in 1991).
US households are in much better shape than in 2007. While higher interest rates will gradually boost debt service payments, the risk to the economy appears limited. This is also due to less stretched real estate valuations, which suggests that the housing market is far less likely to trigger a downturn.
Corporate balance sheets are more exposed, however. So long as interest rates are fairly low and growth is robust, it should be unproblematic for corporates to find funding. A sharper hike in rates and/or an economic slowdown would be more worrisome, however. But bond spreads appear to already discount higher corporate risks. Moreover, corporates have significantly lengthened the maturity of their borrowing so that the pass-through from rising interest rates to interest costs will be much slower than in past cycles.
credit-suisse.com/investmentoutlook 27

vk.com/id446425943
Global economy The global economy’s stress test
ƏƏ The external imbalance (i.e. current account relative to GDP) is more benign than in past pre-recession periods. But it has been worsening since 2013 and is projected to further deteriorate.
ƏƏ The fiscal imbalance is higher than in past pre-reces- sion periods. Prior to the 2001 recession, the federal budget reached a surplus of more than 2.5% of GDP; in mid-2007 the deficit was just above 1% of GDP. Despite nearly 10 years of expansion, the deficit is currently at about 4% of GDP and likely to deteriorate further due to the 2018 tax cuts.
ƏƏ Public sector debt has been rising and is above 100% of GDP (large unfunded public sector liabilities are not included here).
At current moderate interest rate levels, financing the debt is fairly unproblematic. A significant rise in rates would make matters worse, however, and could push interest costs as a share of GDP up sharply. An outright default of the US government is nevertheless very improbable given the Fed’s potential role as lender of last resort. But in an economy operating at full capacity, easier Fed policy could increase inflation risks. Conversely, while tax increases or spending cuts might help fiscal dynamics, they would create headwinds to growth. Still, our view is that fiscal profligacy is unlikely to be a major issue for financial markets in 2019.
US vulnerabilities mostly lower than in 2007
Selected measures of economic and financial vulnerability prior to past recessions and today (z-scores*)
|
Unemployment gap, inverse** |
|
|
2 |
|
Housing market P/E |
|
Inflation gap*** |
|
0 |
|
|
-1 |
|
|
-2 |
Current account |
BBB credit spread |
deficit, % of GDP |
Non-financial corporate |
Federal budget |
debt, % of GDP |
deficit, % of GDP |
|
Household debt, % of GDP |
Current 2007 2001 1990
*The z-score (or standard score) offers a standardized measure to compare indicators. It measures an indicator’s deviation from its long-term average at any point in time.
**The unemployment gap is the difference between the current unemployment rate and its long-term average.
***The inflation gap is the difference between the current inflation rate and the US Federal Reserve’s 2% inflation target.
Last data point Q2 2018
Source Haver Analytics, Bloomberg, Credit Suisse
28 |
Investment Outlook 2019 |

vk.com/id446425943
Eurozone juggles high debt, low growth
In the Eurozone, the key vulnerabilities – i.e. the fiscal balance and member countries’ external balance – have improved substantially compared to 2007 (see chart below). The key issue for the Eurozone is high government debt, especially in Italy, coupled with low economic growth. Moreover, given that the ECB is winding down its asset purchases (i.e. quantitative easing), pressures on public sector debt may increase. Considering the huge size of Italian debt (approximately EUR 2.3 trillion, or 130% of GDP), any sign that the government is indeed moving away from fiscal discipline could have highly destabilizing effects beyond Italy, not least because the Italian banking sector remains quite exposed to government debt.
While the fundamental risk of instability has diminished in the Eurozone, the picture for the UK is less clear. Similar to the USA, the UK also continues to exhibit a twin deficit. In its case, the external balance is more prominent than the fiscal deficit. It seems unlikely that this situation will evolve into a financial crisis given the Bank of England’s credibility, but in case of continued uncertainty over relations with the EU, questions regarding the funding of the external imbalance may arise.
Similar to the USA, the UK also continues to exhibit a twin deficit.
Emerging markets: The strong outnumber the fragile
The fragilities in EM as a group are fairly limited, in our view. However, the reliance on foreign savings was significant in selected countries, notably Argentina, Turkey and South Africa, and should have been seen as a warning sign. Yet the external imbalances are less serious in other key countries such as Brazil, Mexico or Indonesia. Compared to the 1990s, the situation has in fact improved dramatically. Countries that witnessed a major crisis at that time, notably Thailand and Malaysia, have significantly improved their current accounts. But fiscal discipline has deteriorated to some extent in most countries.
Twin deficits have improved in almost all Eurozone countries
Fiscal and current account balances (in % of GDP)
Fiscal balance |
Current account balance |
Greece
Portugal
Italy
France
Austria
Germany
Belgium
Netherlands
Cyprus
Ireland
Spain
Finland
|
|
|
|
|
|
|
|
|
|
|
|
|
|
|
|
|
|
|
|
|
|
|
|
|
United Kingdom |
|
|
|
|
|
|
|
|
|
|
|
|
|
|
|
|
|
|
|
|
|
|
|
|
|
|
|
|
|
|
|
|
|
|
|
|
|
|
|
|
|
|
|
|
|
|
|
||
Switzerland |
|
|
|
|
|
|
|
|
|
|
|
|
|
|
|
|
|
|
|
|
|
|
|
|
|
|
|
|
|
|
|
|
|
|
|
|
|
|
|
|
|
|
|
|
|
|
|
|
|
|
|
|
|
|
|
|
|
|
|
|
|
|
|
|
|
|
|
|
|
|
|
|
|
|
|
|
|
|
|
|
|
|
|
|
|
|
|
|
|
|
|
|
|
|
|
|
|
|
|
|
-8 |
-6 |
-4 |
|
-2 |
0 |
|
2 |
4 |
6 |
-15 |
-12 |
-9 |
-6 |
-3 |
|
0 |
3 |
6 |
9 |
|
12 |
15 |
|
Last data point 2017 |
|
|
|
|
|
|
|
|
|
|
|
|
|
|
|
|
|
|
|
|
|
|
|
|
2018 International Monetary Fund estimate |
|
|
|
|
|
|
|
|
|
|
|
|
2017 – 2018 |
|
|
2006 – 2007 |
||||||||
|
|
|
|
|
|
|
|
|
|
|
|
|
|
|||||||||||
Source International Monetary Fund, Credit Suisse |
|
|
|
|
|
|
|
|
|
|
|
|
|
|||||||||||
|
|
|
|
|
|
|
|
|
|
|
|
|
|
|
|
|
|
|
||||||
credit-suisse.com/investmentoutlook 29

vk.com/id446425943
Global economy The global economy’s stress test
China curbs appetite for debt
China is in a special fiscal situation: central government debt is not very high, but debt of state-owned enterprises and local governments has increased sharply since the financial crisis. Household sector debt is also elevated compared to household incomes. As most of China’s debt is denominated in domestic currency and debts of strategic sectors are backed by the central government, we see the risk of a financial crisis as quite limited. Moreover, efforts to reduce that debt have been underway for some time. China is also attempting to curb lending outside of its banking system. In general, changing financial policy and concerns about over-indebtedness are acting as a brake on Chinese growth, a pattern that is set to continue. The trade dispute with the USA or other potential shocks pose a dilemma for China’s policymakers, as they may need to provide renewed stimulus to prevent a sharper growth slowdown. But a crisis seems unlikely.
Crisis risks are still rare
In conclusion, we believe that the potential for financial instability is lower in most countries and sectors than before the 2008 financial crisis. The exceptions are select EM where the corporate sector is more vulnerable due to fairly high levels of foreign currency debt. In the case of China and the USA, where corporate debt is also high, the exposure is largely in domestic currency and thus less risky. In the Eurozone, we note a significant improvement in the financial stability metrics, but continued political risks. Similarly, the trade conflicts are essentially political, and our base case is that the key actors will not commit serious judgement errors that would trigger significant turbulence. Finally, we flag the rise of US public sector debt as a key long-term issue. The risk is not a debt default but a decline in growth once the fiscal stimulus runs out. This could exacerbate political tensions over how to rein in debt. One option, albeit not likely, would be more deliberate pressure on the Fed to inflate away the debt, with potentially serious consequences for the stability of the Treasury market and the USD.
Lower financial vulnerability of emerging markets than in 1990s
Current account balance (as a % of GDP)
Argentina
Brazil
India
Indonesia
South Korea
Malaysia
Mexico
Russia
South Africa
Thailand
Turkey
Greater vulnerability |
|
|
|
|
|
Lower vulnerability |
|
2017 – 2018 |
||||||||
|
|
|
|
|
||||||||||||
|
|
|
|
|
|
|
|
|
|
|
|
|
|
|
|
|
|
|
|
|
|
|
|
|
|
|
|
|
|
|
|
|
2006 – 2007 |
|
|
|
|
|
|
|
|
|
|
|
|
|
|
|
|
|
|
|
|
|
|
|
|
|
|
|
|
|
|
|
|
|
1990s pre-crisis |
|
|
|
|
|
|
|
|
|
|
|
|
|
|
|
|
|
|
|
|
|
|
|
|
|
|
|
|
|
|
|
|
|
|
|
|
|
|
|
|
|
|
|
|
|
|
|
|
|
|
|
|
|
|
|
|
|
|
|
|
|
|
|
|
|
|
|
|
|
|
|
|
|
|
|
|
|
|
|
|
|
|
|
|
|
|
|
|
|
|
|
|
|
|
|
|
|
|
|
|
|
|
|
|
|
|
|
|
|
|
|
|
|
|
|
|
|
|
|
|
|
|
|
|
|
|
|
|
|
|
|
|
|
|
|
|
|
|
|
|
|
|
|
|
|
|
|
|
|
|
|
|
|
|
|
|
|
|
|
|
|
|
|
|
|
|
|
|
|
|
|
|
|
|
|
|
|
|
|
|
|
|
|
|
|
|
|
|
|
|
|
|
|
|
|
|
|
|
|
|
|
|
|
|
|
|
|
|
|
|
|
|
|
|
|
|
|
|
|
|
|
|
|
|
|
|
|
|
|
|
|
|
|
|
|
|
|
|
|
|
|
|
|
|
|
|
|
|
|
|
|
|
|
|
|
|
|
|
|
|
|
|
|
|
|
|
|
|
|
|
|
|
|
|
|
|
|
|
|
|
|
|
|
|
|
|
Last data point 2017 |
|
|
|
|
|
|
|
|
|
|
|
|
|
|
|
|
|
|
|
|
|
|
|
|
|
|
|
|
|
|
|
|
|
|
|
|
|
|
|
|
|
|
|
|
|
|
|
|
|
|
|
|
|
|
|
|
|
|
|
|
|
|
|
|
|
|
|
|
|
|
|
|
|
|
|
|
|
|
|
|
|
|
|
|
|
|
|
|
|
|
|
|
|
|
|
|
|
|
|
|
|
|
|
|
|
|
|
|
|
|
|
|
|
|
|
|
|
|
|
|
|
|
|
|
|
|
|
|
|
|
|
|
|
|
|
|
|
|
|
|
|
|
|
|
|
|
|
|
|
|
|
|
|
|
|
|
|
|
|
|
|
|
|
|
|
|
|
|
|
|
|
|
|
|
|
|
|
|
|
|
|
|
|
|
|
|
|
|
|
|
|
|
|
|
|
|
|
|
|
|
|
|
|
|
|
|
|
|
|
|
|
|
|
|
|
|
|
|
|
|
|
|
|
|
2018 International Monetary Fund estimate |
|
|
|
|
|
|
|
|
|
|
|
|
|
|
Source International Monetary Fund, |
-10 |
-8 |
-6 |
-4 |
-2 |
0 |
2 |
4 |
6 |
8 |
10 |
12 |
14 |
16 |
Credit Suisse |
30 |
Investment Outlook 2019 |