

Cotton world markets_watermark
.pdfUnited States
vk.com/id446425943Department of
Agriculture
Foreign
Agricultural
Service
May 2019
Cotton:
World Markets and Trade
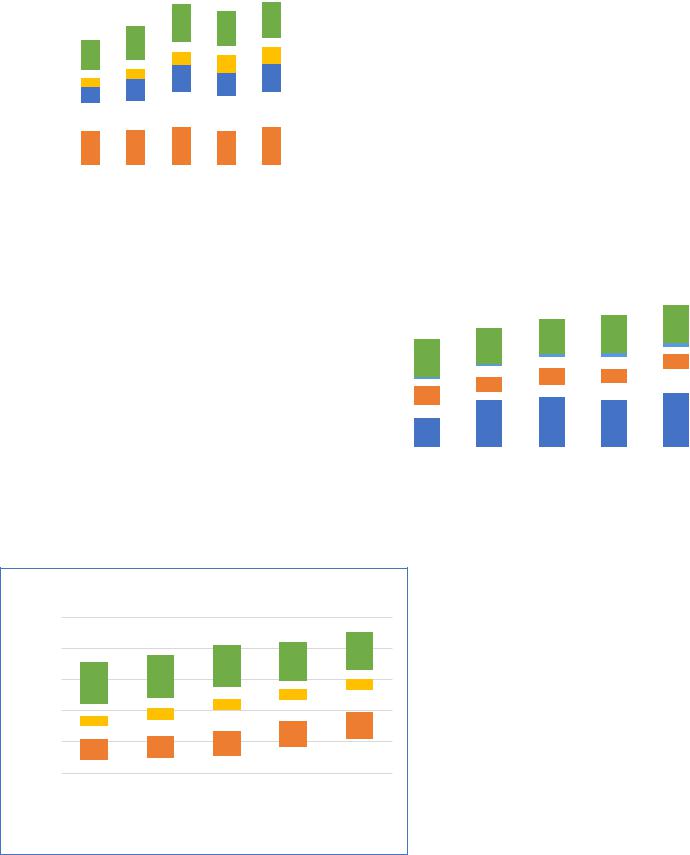
Record World Consumption Helps Lower Stocks in 2019/20
Million Bales
World Ending Stocks Down 1.0%
100 |
|
|
|
|
|
|
|
|
|
|
|
|
|
|
|
|
|
|
|
|
|
|
|
|
|
|
|
|
|
90 |
|
|
|
|
|
|
|
|
|
|
|
|
|
|
|
|
|
|
|
|
|
|
|
|
|
|
|
|
|
80 |
|
|
|
|
|
|
|
|
|
|
|
|
|
Others -0.3% |
|
|
|
|
|
|
|
|
|
|
|
|
|
||
70 |
|
|
|
|
|
|
|
|
|
|
|
|
|
|
|
|
|
|
|
|
|
|
|
|
|
|
|
||
|
|
|
|
|
|
|
|
|
|
|
|
|
||
60 |
|
|
|
|
|
|
|
|
|
|
|
|
|
Pakistan 0.9% |
|
|
|
|
|
|
|
|
|
|
|
|
|
||
50 |
|
|
|
|
|
|
|
|
|
|
|
|
|
|
|
|
|
|
|
|
|
|
|
|
|
|
|
|
|
|
|
|
|
|
|
|
|
|
|
|
|
|
|
|
40 |
|
|
|
|
|
|
|
|
|
|
|
|
|
United States |
|
|
|
|
|
|
|
|
|
|
|
|
|
||
|
|
|
|
|
|
|
|
|
|
|
||||
|
|
|
|
|
|
|
|
|
|
|
|
|
||
30 |
|
|
|
|
|
|
|
|
|
|
|
37.6% |
||
|
|
|
|
|
|
|
|
|
|
|
||||
20 |
|
|
|
|
|
|
|
|
|
|
|
|
|
India 1.4% |
|
|
|
|
|
|
|
|
|
|
|
|
|
||
|
|
|
|
|
|
|
|
|
|
|
|
|
||
|
|
|
|
|
|
|
|
|
|
|
|
|
|
|
10 |
|
|
|
Brazil 2.3% |
|
|
|
||
0 |
|
|
|
|
|
|
|
China -8.6% |
|
|
|
|
||
|
|
|
|
Million Bales
World Consumption Up 2.6%
140 |
|
|
|
|
|
|
|
|
|
|
|
|
|
|
|
|
|
|
|
|
|
|
|
|
|
|
|
|
|
120 |
|
|
|
|
|
|
|
|
|
|
|
|
|
|
|
|
|
|
|
|
|
|
|
|
|
|
|
|
|
100 |
|
|
|
|
|
|
|
|
|
|
|
|
|
Others 2.0% |
|
|
|
|
|
|
|
|
|
|
|
|
|
||
|
|
|
|
|
|
|
|
|
|
|
|
|
||
80 |
|
|
|
|
|
|
|
|
|
|
|
|
|
Vietnam 8.6% |
|
|
|
|
|
|
|
|
|
|
|
|
|
||
|
|
|
|
|
|
|
|
|
|
|
||||
|
|
|
|
|
|
|
|
|
|
|
|
|
||
60 |
|
|
|
|
|
|
|
|
|
|
|
|
|
Bangladesh 5.0% |
|
|
|
|
|
|
|
|
|
|
|
|
|
||
|
|
|
|
|
|
|
|
|
|
|
|
|
||
40 |
|
|
|
|
|
|
|
|
|
|
|
|
|
Pakistan 0.9% |
|
|
|
|
|
|
|
|
|
|
|
|
|
|
20 |
|
|
|
India 2.0% |
|
|
|
||
|
|
|
||
|
|
|
China 2.5% |
|
|
|
|
||
0 |
|
|
|
|
|
|
|
|
|
|
|
|
|
USDA’s first detailed forecast for the 2019/20 marketing year shows world ending stocks forecast down for the sixth consecutive year. However, stocks outside of China will grow after declining in 2018/19 and reach a record of nearly 45 million bales. Apart from China, ending stocks are forecast to increase in nearly all major producing and consuming countries as global production remains high relative to consumption due to Brazil’s record crops and the large increase in U.S. production. In contrast, China’s ending stocks are forecast to fall for the fifth consecutive year and be less than half the level seen at the end of China’s reserve buying in 2014/15. Flat production, continued reserve sales, and consumption growth in China will combine to work stocks down. U.S. stocks will rise sharply due to a dramatically larger forecast crop and continued restrictions on U.S. exports to China.
Global consumption is forecast to grow to a record of just under 126 million bales. World consumption will have gained 16 million bales since the low following the 2009 global financial crisis. Growth is slightly above the long-term average and is expected in all of the top ten spinning countries except Indonesia, with continued strong growth forecast for Vietnam and Bangladesh. Consumption in China is expected up at near the world pace.
For an email subscription, click here to register: https://public.govdelivery.com/accounts/USDAFAS/subscriber/ new.
Approved by the World Agricultural Outlook Board/USDA
vk.com/id446425943
|
|
|
|
|
|
|
|
|
|
|
|
|
|
|
Global production in 2019/20 is forecast |
|||||||||||||
|
|
World Production Up 5.9% |
|
|
|
|
|
|
||||||||||||||||||||
|
|
|
|
|
|
|
|
nearly 6 percent higher. A sharply higher |
||||||||||||||||||||
|
140 |
|
|
|
|
|
|
|
|
|
|
|
|
|
||||||||||||||
|
|
|
|
|
|
|
|
Others 3.4% |
|
U.S. crop will provide well over half of |
||||||||||||||||||
|
|
|
|
|
|
|
|
|
||||||||||||||||||||
|
120 |
|
|
|
|
|
|
|
|
|||||||||||||||||||
|
|
|
|
|
|
|
|
|
||||||||||||||||||||
|
|
|
|
|
|
|
|
Pakistan 3.9% |
the higher production with India |
|
|
|||||||||||||||||
|
|
|
|
|
|
|
|
|
|
|||||||||||||||||||
|
|
|
|
|
|
|
|
|
|
|
||||||||||||||||||
Bales |
100 |
|
|
|
|
|
|
|
accounting for most of the rest. |
|
|
|||||||||||||||||
|
|
|
|
|
|
|
|
|
|
|
|
|
|
|
||||||||||||||
80 |
|
|
|
|
|
|
|
Brazil -6.3% |
|
Production in the Southern Hemisphere |
||||||||||||||||||
|
|
|
|
|
|
|
|
|||||||||||||||||||||
|
|
|
|
|
|
|
|
|||||||||||||||||||||
Million |
60 |
|
|
|
|
|
|
|
United States |
will be down sightly as expansion in |
||||||||||||||||||
|
|
|
|
|
|
|
||||||||||||||||||||||
40 |
|
|
|
|
|
|
|
Brazil takes a breather after seeing nearly |
||||||||||||||||||||
|
|
|
|
|
|
|
|
|||||||||||||||||||||
|
|
|
|
|
|
|
|
|||||||||||||||||||||
|
|
|
|
|
|
|
|
19.8% |
|
|
|
|
||||||||||||||||
|
|
|
|
|
|
|
|
|
|
|
|
|||||||||||||||||
|
20 |
|
|
|
|
|
|
|
China 0.0% |
|
40 percent growth in 2018/19 and |
|||||||||||||||||
|
|
|
|
|
|
|
|
|
|
|
|
|
|
Australia continues to face serious water |
||||||||||||||
|
0 |
|
|
|
|
|
|
|
India 11.8% |
|
||||||||||||||||||
|
|
|
|
|
|
|
|
|
shortages. Production in China will |
|||||||||||||||||||
|
|
|
|
|
|
|
|
|
||||||||||||||||||||
|
|
|
|
|
|
|
|
|
||||||||||||||||||||
|
2015/16 2016/17 2017/18 2018/19 2019/20 |
|
|
|
||||||||||||||||||||||||
|
|
|
|
|
|
|
|
|
||||||||||||||||||||
|
|
|
|
|
|
|
|
|
|
|
|
|
|
|
remain stable. |
|
|
|
|
|
|
|
|
|
||||
|
|
|
|
|
|
|
|
|
|
|
|
|
|
|
|
|
|
|||||||||||
|
|
|
|
|
|
|
|
|
|
|
|
|
|
|
|
|
|
|
|
|
|
|
|
|
|
|
|
|
|
|
|
|
|
|
|
|
|
|
|
|
|
|
|
World Exports Up 7.9% |
|
|
|||||||||||
|
|
|
|
|
|
|
|
|
|
|
|
|
|
50 |
|
|
|
|
|
|
|
|
|
|
|
|
|
|
|
|
|
|
|
|
|
|
|
|
|
|
|
|
|
|
|
|
|
|
|
|
|
|
|
|
|
|
|
In 2019/20, for the fourth consecutive year |
|
Bales |
40 |
|
|
|
|
|
|
|
|
|
|
|
|
|
|
|||||||||||
|
|
|
|
|
|
|
|
|
|
|
|
|
|
|
||||||||||||||
|
30 |
|
|
|
|
|
|
|
|
|
|
|
|
|
|
|||||||||||||
world trade is expected to expand. Both |
|
|
|
|
|
|
|
|
|
|
|
|
|
|
|
|
||||||||||||
|
|
Million |
|
|
|
|
|
|
|
|
|
|
|
|
|
|
||||||||||||
|
|
|
|
|
|
|
|
|
|
|
|
|
|
|
|
|
||||||||||||
the United States and Brazil will have |
|
|
20 |
|
|
|
|
|
|
|
|
|
|
|
|
|
|
|||||||||||
|
|
|
|
|
|
|
|
|
|
|
|
|
|
|
|
|
|
|
||||||||||
large exportables supplies: a record late- |
|
|
|
|
|
10 |
|
|
|
|
|
|
|
|
|
|
|
|
|
|
||||||||
harvested 2018/19 Brazilan crop which |
|
|
|
|
|
|
|
|
|
|
|
|
|
|
|
|
|
|
|
|||||||||
|
|
|
|
|
|
|
|
|
|
|
|
|
|
|
|
|
|
|
|
|||||||||
will be followed shortly on the market by |
|
|
|
|
0 |
|
|
|
|
|
|
|
|
|
|
|
|
|
|
|||||||||
|
|
|
2015/16 |
2016/17 |
2017/18 |
2018/19 |
2019/20 |
|
||||||||||||||||||||
the sharply higher 2019/20 U.S. crop. |
|
|
|
|
|
|
|
|||||||||||||||||||||
|
|
|
|
|
United States 15.3% Brazil 41.4% |
|
India 7.1% |
|
|
|||||||||||||||||||
|
|
|
|
|
|
|
|
|
|
|
|
|
|
|
|
|
||||||||||||
|
|
|
|
|
|
|
|
|
|
|
|
|
|
|
|
|
||||||||||||
|
|
|
|
|
|
|
|
|
|
|
|
|
|
Australia -42.9% |
|
|
Benin 5.7% |
|
Others 0.8% |
|||||||||
|
|
|
|
|
|
|
|
|
|
|
|
|
|
|
|
|
||||||||||||
|
|
|
|
|
|
|
|
|
|
|
|
|
|
|
|
|
||||||||||||
|
|
|
|
|
|
|
|
|
|
|
|
|
|
|
|
|
|
|
|
|
|
|
|
|
|
|
|
|
World Imports Up 7.9%
|
50 |
|
Bales |
40 |
|
30 |
||
Million |
||
20 |
||
|
||
|
10 |
|
|
0 |
2015/16 |
2016/17 |
2017/18 |
2018/19 |
2019/20 |
||||
|
China 29.4% |
|
|
Bangladesh 5.0% |
|
Vietnam 7.0% |
|
|
|
|
|
||||||
|
|
|
||||||
|
Indonesia 0.0% |
|
Turkey 0.0% |
|
Others -0.6% |
|
||
|
|
|
|
|||||
|
|
|
|
|||||
The expanded world trade will be driven by higher use in importing countries. Vietnam and Bangladesh imports will continue commensurate with their expansion in spinning. China’s imports are nearly 30 percent higher as a shift in its State Reserve policy – from reducing to rotating reserves – is bringing China back strongly into the global market.
Foreign Agricultural Service/USDA |
2 |
May 2019 |
Office of Global Analysis |
|
|
vk.com/id446425943
Overview
For 2019/20, the initial forecast shows higher global production, consumption, and trade compared to 2018/19. Stocks in China continue to decline while stocks elsewhere rise. However, total ending stocks will decline slightly. The U.S. forecast shows larger production, higher exports and ending stocks, with use unchanged. The U.S. season-average farm price is projected at 65 cents per pound, down 5 cents.
Compared to last month, global production for 2018/19 is forecast down slightly, as smaller crops in India and the United States more than offset a larger crop in Brazil. Trade forecasts see only minor adjustments, notably lower exports for the United States and higher imports for China. U.S. stocks are up. The U.S. season-average farm price is unchanged at 70 cents/lbs.
For current prices received by farmers click here; NASS farm price
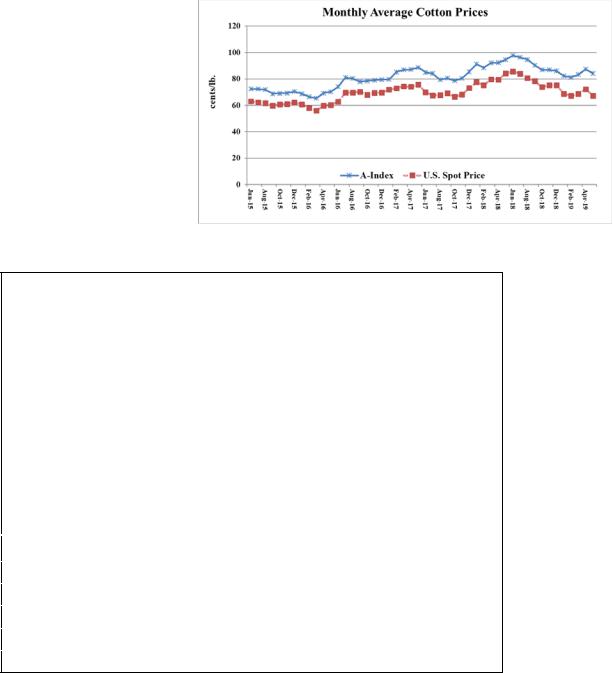
Prices
The A-index and the U.S. spot prices are down on concerns regarding U.S.-China trade negotiations.
For more information on U.S. spot price click here; AMS Cotton Market News
2018/19 TRADE OUTLOOK
|
Major Importers: |
|
|
|
1,000 bales |
|
|
|
|
|
|
|
|
Change |
Current |
Prev. |
Reason |
|
|
|
|
|
|
|
WORLD |
- |
42,028 |
42,090 |
|
|
|
|
|
|
|
|
China |
500 |
8,500 |
8,000 |
Expanded quota |
|
|
|
|
|
|
|
Indonesia |
-300 |
3,200 |
3,500 |
Weaker yarn exports |
|
|
|
|
|
|
|
Vietnam |
-200 |
7,100 |
7,300 |
Weaker yarn exports |
|
|
|
|
|
|
|
Major Exporters |
|
|
|
1000 bales |
|
|
Change |
Current |
Prev. |
Reason |
|
|
|
|
|
|
|
WORLD |
- |
41,731 |
42,086 |
|
|
|
|
|
|
|
|
Australia |
400 |
4,200 |
3,800 |
Strong early new crop |
|
shipments |
||||
|
|
|
|
|
|
|
Brazil |
-300 |
4,200 |
4,500 |
Slow pace of shipments |
|
|
|
|
|
|
|
Mexico |
-100 |
500 |
600 |
Slow pace of shipments |
|
|
|
|
|
|
|
Cote d’Ivoire |
100 |
850 |
750 |
Larger crop |
|
|
|
|
|
|
|
United States |
-250 |
14,750 |
15,000 |
Slow pace of shipments |
|
|
|
|
|
|
Foreign Agricultural Service/USDA |
3 |
May 2019 |
Office of Global Analysis |
|
|

vk.com/id446425943
The Foreign Agricultural Service (FAS) updates its production, supply and distribution (PSD) database for cotton, oilseeds, and grains at 12:00 p.m. on the day the World Agricultural Supply and Demand Estimates (WASDE) report is released. This circular is released by 12:15 p.m.
FAS Reports and Databases:
Questions may be directed to:
James Johnson |
(202) |
690-1546 |
James.Johnson@fas.usda.gov |
(James.Johnson@usda.gov) |
|
|
|
Graham Soley |
(202) |
772-4235 |
Graham.Soley@fas.usda.gov |
(Graham.Soley@usda.gov) |
|
|
|
Current World Market and Trade and World Agricultural Production Reports:
https://apps.fas.usda.gov/psdonline/app/index.html#/app/downloads
Archives World Market and Trade and World Agricultural Production Reports:
http://usda.mannlib.cornell.edu/MannUsda/viewTaxonomy.do?taxonomyID=7
Production, Supply and Distribution Database (PSD Online):
https://apps.fas.usda.gov/psdonline/app/index.html#/app/home
Global Agricultural Trade System (U.S. Exports and Imports):
http://apps.fas.usda.gov/gats/default.aspx
Export Sales Report:
http://apps.fas.usda.gov/esrquery/
Global Agricultural Information Network (Agricultural Attaché Reports):
http://gain.fas.usda.gov/Pages/Default.aspx
Other USDA Reports:
World Agricultural Supply and Demand Estimates (WASDE):
http://www.usda.gov/oce/commodity/wasde/
Economic Research Service:
http://www.ers.usda.gov/topics/crops
National Agricultural Statistics Service:
http://www.nass.usda.gov/Publications/
Foreign Agricultural Service/USDA |
4 |
May 2019 |
Office of Global Analysis |
|
|
vk.com/id446425943
Summary of Changes in estimates and Forecasts from Last Month
(1,000 480 lb Bales and 1,000 Ha)
Country Mktg |
Area |
Beginning |
|
Production |
Imports |
Exports |
Use |
Loss |
Total Dom. |
Ending |
Year |
Harvested |
Stocks |
|
|
|
|
|
|
Cons. |
Stocks |
|
|
|
|
|
|
|
|
|
|
|
Australia |
|
|
|
|
|
|
|
|
|
|
2018/19 |
0 |
|
0 |
0 |
0 |
400 |
0 |
0 |
0 |
-400 |
Benin |
|
|
|
|
|
|
|
|
|
|
2018/19 |
90 |
|
0 |
100 |
0 |
25 |
0 |
0 |
0 |
75 |
Brazil |
|
|
|
|
|
|
|
|
|
|
2018/19 |
25 |
|
0 |
1,000 |
0 |
-200 |
0 |
0 |
0 |
1,200 |
Bulgaria |
|
|
|
|
|
|
|
|
|
|
2018/19 |
0 |
|
0 |
0 |
-4 |
0 |
-4 |
0 |
-4 |
0 |
Burkina |
|
|
|
|
|
|
|
|
|
|
2018/19 |
0 |
|
0 |
-80 |
0 |
0 |
0 |
0 |
0 |
-80 |
Cameroon |
|
|
|
|
|
|
|
|
|
|
2018/19 |
20 |
|
0 |
75 |
0 |
50 |
0 |
0 |
0 |
25 |
Chad |
|
|
|
|
|
|
|
|
|
|
2018/19 |
-60 |
|
0 |
-50 |
0 |
0 |
0 |
0 |
0 |
-50 |
China |
|
|
|
|
|
|
|
|
|
|
2018/19 |
0 |
|
0 |
0 |
500 |
0 |
0 |
0 |
0 |
500 |
Cote d'Ivoire |
|
|
|
|
|
|
|
|
|
|
2016/17 |
0 |
|
0 |
18 |
0 |
0 |
0 |
0 |
0 |
18 |
2017/18 |
-39 |
|
18 |
20 |
0 |
0 |
0 |
0 |
0 |
38 |
2018/19 |
22 |
|
38 |
75 |
0 |
100 |
0 |
0 |
0 |
13 |
Czech Republic |
|
|
|
|
|
|
|
|
|
|
2018/19 |
0 |
|
0 |
0 |
-2 |
0 |
-2 |
0 |
-2 |
0 |
Egypt |
|
|
|
|
|
|
|
|
|
|
2018/19 |
-4 |
|
0 |
0 |
0 |
0 |
0 |
0 |
0 |
0 |
Germany |
|
|
|
|
|
|
|
|
|
|
2018/19 |
0 |
|
0 |
0 |
-10 |
-5 |
-5 |
0 |
-5 |
0 |
India |
|
|
|
|
|
|
|
|
|
|
2018/19 |
0 |
|
0 |
-1,500 |
0 |
0 |
0 |
0 |
0 |
-1,500 |
Indonesia |
|
|
|
|
|
|
|
|
|
|
2018/19 |
0 |
|
0 |
0 |
-300 |
0 |
-300 |
0 |
-300 |
0 |
Iran |
|
|
|
|
|
|
|
|
|
|
2018/19 |
-5 |
|
0 |
0 |
0 |
0 |
0 |
0 |
0 |
0 |
Foreign Agricultural Service/USDA |
5 |
May 2019 |
Office of Global Analysis |
|
|
vk.com/id446425943
Summary of Changes in estimates and Forecasts from Last Month (Continued)
(1,000 480 lb Bales and 1,000 Ha)
Country Mktg |
Area |
Beginning |
Production |
Imports |
Exports |
Use |
Loss |
Total Dom. |
Ending |
Year |
Harvested |
Stocks |
|
|
|
|
|
Cons. |
Stocks |
|
|
|
|
|
|
|
|
|
|
Kazakhstan |
|
|
|
|
|
|
|
|
|
2018/19 |
-2 |
0 |
0 |
0 |
0 |
0 |
0 |
0 |
0 |
Kyrgyzstan |
|
|
|
|
|
|
|
|
|
2018/19 |
-2 |
0 |
0 |
0 |
0 |
0 |
0 |
0 |
0 |
Malaysia |
|
|
|
|
|
|
|
|
|
2018/19 |
0 |
0 |
0 |
-25 |
0 |
0 |
0 |
0 |
-25 |
Mali |
|
|
|
|
|
|
|
|
|
2018/19 |
-10 |
0 |
-90 |
0 |
0 |
0 |
0 |
0 |
-90 |
Mexico |
|
|
|
|
|
|
|
|
|
2018/19 |
0 |
0 |
-35 |
0 |
-100 |
0 |
0 |
0 |
65 |
Mozambique |
|
|
|
|
|
|
|
|
|
2018/19 |
5 |
0 |
20 |
0 |
10 |
0 |
0 |
0 |
10 |
Netherlands |
|
|
|
|
|
|
|
|
|
2016/17 |
0 |
0 |
0 |
1 |
0 |
1 |
0 |
1 |
0 |
2017/18 |
0 |
0 |
0 |
11 |
0 |
10 |
0 |
10 |
1 |
2018/19 |
0 |
1 |
0 |
16 |
0 |
15 |
0 |
15 |
2 |
Poland |
|
|
|
|
|
|
|
|
|
2018/19 |
0 |
0 |
0 |
-4 |
0 |
-4 |
0 |
-4 |
0 |
Russia |
|
|
|
|
|
|
|
|
|
2018/19 |
0 |
0 |
0 |
-30 |
0 |
-30 |
0 |
-30 |
0 |
Senegal |
|
|
|
|
|
|
|
|
|
2018/19 |
-4 |
0 |
-11 |
0 |
-10 |
0 |
0 |
0 |
-1 |
South Africa |
|
|
|
|
|
|
|
|
|
2018/19 |
-1 |
0 |
4 |
0 |
0 |
0 |
0 |
0 |
4 |
Spain |
|
|
|
|
|
|
|
|
|
2018/19 |
0 |
0 |
0 |
0 |
-25 |
10 |
0 |
10 |
15 |
Syria |
|
|
|
|
|
|
|
|
|
2014/15 |
0 |
0 |
0 |
0 |
15 |
0 |
0 |
0 |
-15 |
2015/16 |
0 |
-15 |
0 |
0 |
30 |
0 |
0 |
0 |
-45 |
2016/17 |
0 |
-45 |
0 |
0 |
-45 |
0 |
0 |
0 |
0 |
2017/18 |
0 |
0 |
0 |
0 |
10 |
0 |
0 |
0 |
-10 |
2018/19 |
0 |
-10 |
10 |
0 |
15 |
10 |
0 |
10 |
-25 |
Foreign Agricultural Service/USDA |
6 |
May 2019 |
Office of Global Analysis |
|
|
vk.com/id446425943
Summary of Changes in estimates and Forecasts from Last Month (Continued)
(1,000 480 lb Bales and 1,000 Ha)
Country Mktg |
Area |
Beginning |
Production |
Imports |
Exports |
Use |
Loss |
Total Dom. |
Ending |
Year |
Harvested |
Stocks |
|
|
|
|
|
Cons. |
Stocks |
|
|
|
|
|
|
|
|
|
|
Tajikistan |
|
|
|
|
|
|
|
|
|
2018/19 |
-10 |
0 |
0 |
0 |
-75 |
35 |
0 |
35 |
40 |
Togo |
|
|
|
|
|
|
|
|
|
2018/19 |
25 |
0 |
10 |
0 |
10 |
0 |
0 |
0 |
0 |
United States |
|
|
|
|
|
|
|
|
|
2018/19 |
-132 |
0 |
-23 |
0 |
-250 |
0 |
-23 |
-23 |
250 |
Venezuela |
|
|
|
|
|
|
|
|
|
2018/19 |
0 |
0 |
0 |
-3 |
0 |
0 |
0 |
0 |
-3 |
Vietnam |
|
|
|
|
|
|
|
|
|
2018/19 |
0 |
0 |
0 |
-200 |
0 |
-200 |
0 |
-200 |
0 |
|
|
|
|
|
|
|
|
|
|
World |
|
|
|
|
|
|
|
|
|
World |
|
|
|
|
|
|
|
|
|
2014/15 |
0 |
0 |
0 |
0 |
15 |
0 |
0 |
0 |
-15 |
2015/16 |
0 |
-15 |
0 |
0 |
30 |
0 |
0 |
0 |
-45 |
2016/17 |
0 |
-45 |
18 |
1 |
-45 |
1 |
0 |
1 |
18 |
2017/18 |
-39 |
18 |
20 |
11 |
10 |
10 |
0 |
10 |
29 |
2018/19 |
-43 |
29 |
-495 |
-62 |
-55 |
-475 |
-23 |
-498 |
25 |
|
|
|
|
|
|
|
|
|
|
Foreign Agricultural Service/USDA |
7 |
May 2019 |
Office of Global Analysis |
|
|

vk.com/id446425943
Table 01 Cotton World Supply, Use, and Trade (Season Beginning August 1)
(1000 MT)
|
|
|
|
|
|
|
|
|
|
|
|
May |
|
|
2014/15 |
2015/16 |
2016/17 |
2017/18 |
2018/19 |
2019/20 |
|
||||||
Production |
|
|
|
|
|
|
|
|
|
|
|
none |
|
India |
6,423 |
5,639 |
5,879 |
6,314 |
5,552 |
|
6,205 |
||||||
China |
6,532 |
4,790 |
4,953 |
5,987 |
6,042 |
|
6,042 |
||||||
United States |
3,553 |
2,806 |
3,738 |
4,555 |
3,999 |
|
4,790 |
||||||
Brazil |
1,563 |
1,289 |
1,528 |
2,007 |
2,787 |
|
2,613 |
||||||
Pakistan |
2,308 |
1,524 |
1,676 |
1,785 |
1,676 |
|
1,742 |
||||||
Turkey |
697 |
577 |
697 |
871 |
806 |
|
893 |
||||||
Uzbekistan |
849 |
827 |
811 |
840 |
718 |
|
680 |
||||||
Other |
|
4,032 |
|
3,483 |
|
3,944 |
|
4,589 |
|
4,206 |
|
4,350 |
|
Total |
25,957 |
20,936 |
23,227 |
26,951 |
25,786 |
|
27,315 |
||||||
USE Dom. Consumption |
|
|
|
|
|
|
|
|
|
|
|
none |
|
China |
7,512 |
7,838 |
8,382 |
8,927 |
8,818 |
|
9,036 |
||||||
India |
5,334 |
5,389 |
5,302 |
5,258 |
5,400 |
|
5,508 |
||||||
Pakistan |
2,308 |
2,243 |
2,243 |
2,351 |
2,308 |
|
2,330 |
||||||
Bangladesh |
1,263 |
1,372 |
1,481 |
1,633 |
1,742 |
|
1,829 |
||||||
Vietnam |
893 |
980 |
1,176 |
1,459 |
1,524 |
|
1,655 |
||||||
Turkey |
1,393 |
1,459 |
1,426 |
1,622 |
1,415 |
|
1,459 |
||||||
Brazil |
740 |
675 |
697 |
740 |
762 |
|
784 |
||||||
Other |
|
4,993 |
|
4,700 |
|
4,590 |
|
4,740 |
|
4,748 |
|
4,818 |
|
Total |
24,436 |
24,655 |
25,296 |
26,730 |
26,717 |
|
27,418 |
||||||
Imports |
|
|
|
|
|
|
|
|
|
|
|
none |
|
China |
1,804 |
959 |
1,096 |
1,246 |
1,851 |
|
2,395 |
||||||
Bangladesh |
1,252 |
1,388 |
1,481 |
1,655 |
1,742 |
|
1,829 |
||||||
Vietnam |
931 |
1,002 |
1,197 |
1,524 |
1,546 |
|
1,655 |
||||||
Indonesia |
728 |
640 |
738 |
762 |
697 |
|
697 |
||||||
Turkey |
800 |
918 |
801 |
876 |
653 |
|
653 |
||||||
Pakistan |
207 |
718 |
533 |
718 |
653 |
|
631 |
||||||
India |
267 |
233 |
596 |
365 |
305 |
|
305 |
||||||
Other |
|
1,864 |
|
1,858 |
|
1,765 |
|
1,791 |
|
1,704 |
|
1,709 |
|
Total |
7,852 |
7,717 |
8,207 |
8,937 |
9,151 |
|
9,874 |
||||||
Exports |
|
|
|
|
|
|
|
|
|
|
|
none |
|
United States |
2,449 |
1,993 |
3,248 |
3,450 |
3,211 |
|
3,701 |
||||||
Brazil |
851 |
939 |
607 |
909 |
1,263 |
|
1,785 |
||||||
India |
914 |
1,255 |
991 |
1,128 |
914 |
|
980 |
||||||
Australia |
523 |
616 |
812 |
852 |
914 |
|
523 |
||||||
Benin |
163 |
142 |
174 |
218 |
288 |
|
305 |
||||||
Greece |
254 |
209 |
221 |
234 |
272 |
|
299 |
||||||
Mali |
185 |
218 |
239 |
283 |
283 |
|
294 |
||||||
Other |
|
2,475 |
|
2,174 |
|
1,950 |
|
1,836 |
|
2,004 |
|
1,986 |
|
Total |
7,815 |
7,544 |
8,243 |
8,911 |
9,151 |
|
9,873 |
||||||
Ending Stocks |
|
|
|
|
|
|
|
|
|
|
|
none |
|
China |
14,461 |
12,345 |
9,998 |
8,278 |
7,320 |
|
6,694 |
||||||
Brazil |
1,548 |
1,243 |
1,509 |
1,885 |
2,658 |
|
2,718 |
||||||
India |
2,305 |
1,534 |
1,716 |
2,009 |
1,551 |
|
1,573 |
||||||
United States |
795 |
827 |
599 |
936 |
1,012 |
|
1,393 |
||||||
Pakistan |
629 |
569 |
504 |
616 |
605 |
|
611 |
||||||
Bangladesh |
290 |
330 |
355 |
404 |
431 |
|
458 |
||||||
Turkey |
347 |
334 |
333 |
387 |
332 |
|
338 |
||||||
Other |
|
2,886 |
|
2,477 |
|
2,497 |
|
3,138 |
|
2,739 |
|
2,694 |
|
Total |
23,262 |
19,659 |
17,509 |
17,653 |
16,649 |
|
16,479 |
||||||
|
|
|
|
|
|
|
|
|
|
|
|
|
|
Foreign Agricultural Service/USDA |
8 |
May 2019 |
Office of Global Analysis |
|
|

vk.com/id446425943
Table 02 Cotton World Supply, Use, and Trade (Season Beginning August 1)
(1000 Bales)
|
|
|
|
|
|
|
|
|
|
|
|
May |
|
|
2014/15 |
2015/16 |
2016/17 |
2017/18 |
2018/19 |
2019/20 |
|
||||||
Production |
|
|
|
|
|
|
|
|
|
|
|
none |
|
Brazil |
7,180 |
5,920 |
7,020 |
9,220 |
12,800 |
|
12,000 |
||||||
China |
30,000 |
22,000 |
22,750 |
27,500 |
27,750 |
|
27,750 |
||||||
India |
29,500 |
25,900 |
27,000 |
29,000 |
25,500 |
|
28,500 |
||||||
Pakistan |
10,600 |
7,000 |
7,700 |
8,200 |
7,700 |
|
8,000 |
||||||
Turkey |
3,200 |
2,650 |
3,200 |
4,000 |
3,700 |
|
4,100 |
||||||
United States |
16,319 |
12,888 |
17,170 |
20,923 |
18,367 |
|
22,000 |
||||||
Uzbekistan |
3,900 |
3,800 |
3,725 |
3,860 |
3,300 |
|
3,125 |
||||||
Other |
|
18,520 |
|
15,998 |
|
18,116 |
|
21,079 |
|
19,317 |
|
19,979 |
|
Total |
119,219 |
96,156 |
106,681 |
123,782 |
118,434 |
|
125,454 |
||||||
USE Dom. Consumption |
|
|
|
|
|
|
|
|
|
|
|
none |
|
Bangladesh |
5,800 |
6,300 |
6,800 |
7,500 |
8,000 |
|
8,400 |
||||||
Brazil |
3,400 |
3,100 |
3,200 |
3,400 |
3,500 |
|
3,600 |
||||||
China |
34,500 |
36,000 |
38,500 |
41,000 |
40,500 |
|
41,500 |
||||||
India |
24,500 |
24,750 |
24,350 |
24,150 |
24,800 |
|
25,300 |
||||||
Indonesia |
3,250 |
3,000 |
3,300 |
3,500 |
3,200 |
|
3,200 |
||||||
Pakistan |
10,600 |
10,300 |
10,300 |
10,800 |
10,600 |
|
10,700 |
||||||
Turkey |
6,400 |
6,700 |
6,550 |
7,450 |
6,500 |
|
6,700 |
||||||
United States |
3,575 |
3,450 |
3,250 |
3,225 |
3,100 |
|
3,100 |
||||||
Uzbekistan |
1,750 |
1,800 |
2,000 |
2,500 |
2,750 |
|
3,000 |
||||||
Vietnam |
4,100 |
4,500 |
5,400 |
6,700 |
7,000 |
|
7,600 |
||||||
Other |
14,356 |
13,337 |
12,532 |
12,544 |
12,757 |
12,828 |
|||||||
Total |
|
|
|
|
|
|
|
|
|
|
|
|
|
112,231 |
113,237 |
116,182 |
122,769 |
122,707 |
|
125,928 |
|||||||
Imports |
|
|
|
|
|
|
|
|
|
|
|
none |
|
Bangladesh |
5,750 |
6,375 |
6,800 |
7,600 |
8,000 |
|
8,400 |
||||||
China |
8,284 |
4,406 |
5,032 |
5,725 |
8,500 |
|
11,000 |
||||||
India |
1,226 |
1,072 |
2,736 |
1,677 |
1,400 |
|
1,400 |
||||||
Indonesia |
3,345 |
2,941 |
3,391 |
3,498 |
3,200 |
|
3,200 |
||||||
Korea, South |
1,321 |
1,175 |
1,025 |
904 |
800 |
|
775 |
||||||
Mexico |
830 |
975 |
1,000 |
925 |
850 |
|
850 |
||||||
Pakistan |
950 |
3,300 |
2,450 |
3,300 |
3,000 |
|
2,900 |
||||||
Thailand |
1,475 |
1,275 |
1,226 |
1,149 |
1,175 |
|
1,175 |
||||||
Turkey |
3,675 |
4,218 |
3,679 |
4,024 |
3,000 |
|
3,000 |
||||||
Vietnam |
4,275 |
4,600 |
5,500 |
7,000 |
7,100 |
|
7,600 |
||||||
Other |
4,934 |
5,107 |
4,857 |
5,246 |
5,003 |
5,051 |
|||||||
Total |
|
|
|
|
|
|
|
|
|
|
|
|
|
36,065 |
35,444 |
37,696 |
41,048 |
42,028 |
|
45,351 |
|||||||
Exports |
|
|
|
|
|
|
|
|
|
|
|
none |
|
Australia |
2,404 |
2,828 |
3,731 |
3,915 |
4,200 |
|
2,400 |
||||||
Benin |
750 |
650 |
800 |
1,000 |
1,325 |
|
1,400 |
||||||
Brazil |
3,910 |
4,314 |
2,789 |
4,174 |
5,800 |
|
8,200 |
||||||
Burkina |
1,300 |
1,100 |
1,150 |
1,150 |
1,100 |
|
1,100 |
||||||
Cameroon |
475 |
550 |
500 |
400 |
550 |
|
550 |
||||||
Cote d'Ivoire |
860 |
780 |
625 |
620 |
850 |
|
800 |
||||||
Greece |
1,165 |
959 |
1,017 |
1,076 |
1,250 |
|
1,375 |
||||||
India |
4,199 |
5,764 |
4,550 |
5,182 |
4,200 |
|
4,500 |
||||||
Mali |
850 |
1,000 |
1,100 |
1,300 |
1,300 |
|
1,350 |
||||||
United States |
11,246 |
9,153 |
14,917 |
15,847 |
14,750 |
|
17,000 |
||||||
Other |
8,734 |
7,553 |
6,682 |
6,264 |
6,706 |
6,673 |
|||||||
Total |
|
|
|
|
|
|
|
|
|
|
|
|
|
35,893 |
34,651 |
37,861 |
40,928 |
42,031 |
|
45,348 |
|||||||
Ending Stocks |
|
|
|
|
|
|
|
|
|
|
|
none |
|
Bangladesh |
1,331 |
1,515 |
1,630 |
1,855 |
1,980 |
|
2,105 |
||||||
Brazil |
7,112 |
5,709 |
6,929 |
8,657 |
12,207 |
|
12,482 |
||||||
China |
66,420 |
56,698 |
45,919 |
38,019 |
33,619 |
|
30,744 |
||||||
India |
10,586 |
7,044 |
7,880 |
9,225 |
7,125 |
|
7,225 |
||||||
Pakistan |
2,890 |
2,615 |
2,315 |
2,830 |
2,780 |
|
2,805 |
||||||
Turkey |
1,596 |
1,533 |
1,528 |
1,777 |
1,527 |
|
1,552 |
||||||
United States |
3,650 |
3,800 |
2,750 |
4,300 |
4,650 |
|
6,400 |
||||||
Other |
13,257 |
11,376 |
11,467 |
14,414 |
12,581 |
12,375 |
|||||||
Total |
|
|
|
|
|
|
|
|
|
|
|
|
|
106,842 |
90,290 |
80,418 |
81,077 |
76,469 |
|
75,688 |
|||||||
|
|
|
|
|
|
|
|
|
|
|
|
|
|
Foreign Agricultural Service/USDA |
9 |
May 2019 |
Office of Global Analysis |
|
|
vk.com/id446425943
Table 04 Cotton Area, Yield, and Production
|
|
Area |
|
|
|
Yield |
|
|
|
|
|
|
Production |
|
Change in Production |
|
||||||||
Country / Region |
|
(Million hectares) |
(Kilograms per hectare) |
|
|
|
(Million 480 lb. bales) |
|
|
|
|
|
|
|||||||||||
|
|
Prel. |
|
2019/20 Proj. |
2017/18 |
Prel. |
|
|
2019/20 Proj. |
|
|
|
|
Prel. |
2019/20 Proj. |
From last month |
From last year |
|||||||
|
2017/18 |
2018/19 |
|
|
May |
2018/19 |
|
|
May |
|
2017/18 |
|
2018/19 |
|
May |
MBales |
|
Percent |
MBales |
|
Percent |
|||
|
|
|
|
|
|
|
|
|
|
|||||||||||||||
World |
33.58 |
33.22 |
34.54 |
803 |
776 |
|
791 |
123.78 |
118.43 |
125.45 |
|
|
|
7.02 |
|
5.93 |
||||||||
United States |
4.49 |
4.13 |
5.08 |
1,014 |
968 |
|
944 |
20.92 |
18.37 |
22.00 |
|
|
|
3.63 |
|
19.78 |
||||||||
Total Foreign |
29.09 |
29.09 |
29.46 |
770 |
749 |
|
765 |
102.86 |
100.07 |
103.45 |
|
|
|
3.39 |
|
3.38 |
||||||||
none |
|
|
|
|
|
|
|
|
|
|
|
|
|
|
|
|
|
|
|
|
|
|
|
|
Western Hemisphere |
|
|
|
|
|
|
|
|
|
|
|
|
|
|
|
|
|
|
|
|
|
|
|
|
Brazil |
1.18 |
1.60 |
1.55 |
1,708 |
1,747 |
|
1,686 |
9.22 |
12.80 |
12.00 |
|
|
|
-0.80 |
|
-6.25 |
||||||||
Mexico |
0.21 |
0.24 |
0.24 |
1,617 |
1,546 |
|
1,588 |
1.56 |
1.69 |
1.75 |
|
|
|
0.06 |
|
3.55 |
||||||||
Argentina |
0.32 |
0.42 |
0.42 |
558 |
596 |
|
612 |
0.82 |
1.15 |
1.18 |
|
|
|
0.03 |
|
2.61 |
||||||||
Paraguay |
0.01 |
0.01 |
0.01 |
416 |
416 |
|
416 |
0.02 |
0.02 |
0.02 |
|
|
|
0.00 |
|
0.00 |
||||||||
Peru |
0.02 |
0.02 |
0.02 |
1,012 |
1,025 |
|
1,025 |
0.08 |
0.08 |
0.08 |
|
|
|
0.00 |
|
0.00 |
||||||||
Colombia |
0.01 |
0.01 |
0.01 |
968 |
968 |
|
968 |
0.04 |
0.04 |
0.04 |
|
|
|
0.00 |
|
0.00 |
||||||||
Africa |
|
|
|
|
|
|
|
|
|
|
|
|
|
|
|
|
|
|
|
|
|
|
|
|
Burkina |
0.85 |
0.64 |
0.73 |
307 |
313 |
|
360 |
1.20 |
0.92 |
1.20 |
|
|
|
0.28 |
|
30.43 |
||||||||
Mali |
0.71 |
0.72 |
0.74 |
432 |
381 |
|
419 |
1.40 |
1.26 |
1.43 |
|
|
|
0.17 |
|
13.10 |
||||||||
Cote d'Ivoire |
0.33 |
0.39 |
0.41 |
536 |
486 |
|
441 |
0.81 |
0.88 |
0.83 |
|
|
|
-0.05 |
|
-5.14 |
||||||||
Cameroon |
0.23 |
0.25 |
0.25 |
484 |
523 |
|
492 |
0.50 |
0.60 |
0.57 |
|
|
|
-0.04 |
|
-5.83 |
||||||||
Benin |
0.53 |
0.65 |
0.68 |
468 |
469 |
|
468 |
1.14 |
1.40 |
1.45 |
|
|
|
0.05 |
|
3.57 |
||||||||
Chad |
0.12 |
0.06 |
0.22 |
181 |
145 |
|
198 |
0.10 |
0.04 |
0.20 |
|
|
|
0.16 |
|
400.00 |
||||||||
Togo |
0.16 |
0.19 |
0.19 |
299 |
282 |
|
312 |
0.22 |
0.24 |
0.27 |
|
|
|
0.03 |
|
10.42 |
||||||||
Senegal |
0.02 |
0.02 |
0.02 |
359 |
301 |
|
331 |
0.03 |
0.03 |
0.04 |
|
|
|
0.01 |
|
20.69 |
||||||||
Egypt |
0.09 |
0.14 |
0.10 |
718 |
772 |
|
762 |
0.30 |
0.50 |
0.35 |
|
|
|
-0.15 |
|
-30.00 |
||||||||
Zimbabwe |
0.20 |
0.20 |
0.20 |
294 |
218 |
|
207 |
0.27 |
0.20 |
0.19 |
|
|
|
-0.01 |
|
-5.00 |
||||||||
Nigeria |
0.27 |
0.27 |
0.27 |
190 |
190 |
|
190 |
0.24 |
0.24 |
0.24 |
|
|
|
0.00 |
|
0.00 |
||||||||
Asia Oceania |
|
|
|
|
|
|
|
|
|
|
|
|
|
|
|
|
|
|
|
|
|
|
|
|
China |
3.40 |
3.50 |
3.45 |
1,761 |
1,726 |
|
1,751 |
27.50 |
27.75 |
27.75 |
|
|
|
0.00 |
|
0.00 |
||||||||
India |
12.45 |
12.25 |
12.35 |
507 |
453 |
|
502 |
29.00 |
25.50 |
28.50 |
|
|
|
3.00 |
|
11.76 |
||||||||
Pakistan |
2.70 |
2.40 |
2.50 |
661 |
699 |
|
697 |
8.20 |
7.70 |
8.00 |
|
|
|
0.30 |
|
3.90 |
||||||||
Kazakhstan |
0.13 |
0.13 |
0.13 |
523 |
561 |
|
587 |
0.30 |
0.33 |
0.35 |
|
|
|
0.02 |
|
4.55 |
||||||||
Tajikistan |
0.19 |
0.18 |
0.18 |
671 |
544 |
|
544 |
0.57 |
0.45 |
0.45 |
|
|
|
0.00 |
|
0.00 |
||||||||
Turkmenistan |
0.55 |
0.55 |
0.55 |
535 |
364 |
|
459 |
1.34 |
0.91 |
1.15 |
|
|
|
0.24 |
|
26.37 |
||||||||
Uzbekistan |
1.25 |
1.10 |
1.01 |
672 |
653 |
|
674 |
3.86 |
3.30 |
3.13 |
|
|
|
-0.18 |
|
-5.30 |
||||||||
Turkey |
0.47 |
0.52 |
0.54 |
1,853 |
1,549 |
|
1,653 |
4.00 |
3.70 |
4.10 |
|
|
|
0.40 |
|
10.81 |
||||||||
Australia |
0.53 |
0.30 |
0.30 |
1,972 |
1,814 |
|
1,597 |
4.80 |
2.50 |
2.20 |
|
|
|
-0.30 |
|
-12.00 |
||||||||
Syria |
0.03 |
0.03 |
0.03 |
1,161 |
1,219 |
|
1,219 |
0.16 |
0.14 |
0.14 |
|
|
|
0.00 |
|
0.00 |
||||||||
Burma |
0.25 |
0.24 |
0.24 |
634 |
635 |
|
635 |
0.73 |
0.70 |
0.70 |
|
|
|
0.00 |
|
0.00 |
||||||||
Europe |
|
|
|
|
|
|
|
|
|
|
|
|
|
|
|
|
|
|
|
|
|
|
|
|
Greece |
0.23 |
0.25 |
0.26 |
1,157 |
1,253 |
|
1,231 |
1.22 |
1.41 |
1.47 |
|
|
|
0.06 |
|
4.26 |
||||||||
Others |
1.68 |
1.83 |
1.89 |
420 |
427 |
|
427 |
3.24 |
3.60 |
3.71 |
|
|
|
0.11 |
|
3.09 |
||||||||
Note: Yeild for Total Foreign and Others is an incorrect calculation.
Foreign Agricultural Service/USDA |
10 |
May 2019 |
Office of Global Analysis |
|
|